| Param | Original file | Final file |
|---|---|---|
| Filename | modeM0/AS1A13_093T12_9000006118_45675cztM0_level2.fits | modeM0/AS1A13_093T12_9000006118_45675cztM0_level2_quad_clean.evt |
| Size (bytes) | 454,484,160 | 108,673,920 |
| Size | 433.4 MB | 103.6 MB |
| Events in quadrant A | 5,549,622 | 733,026 |
| Events in quadrant B | 3,190,251 | 753,257 |
| Events in quadrant C | 3,413,720 | 714,394 |
| Events in quadrant D | 4,171,370 | 641,777 |
| Mode M0 | |||
|---|---|---|---|
| Quadrant | BADHDUFLAG | Total packets | Discarded packets |
| A | 0 | 20615 | 1 |
| B | 0 | 13746 | 1 |
| C | 0 | 14755 | 1 |
| D | 0 | 16799 | 3 |
| Mode SS | |||
|---|---|---|---|
| Quadrant | BADHDUFLAG | Total packets | Discarded packets |
| A | 0 | 130 | 0 |
| B | 0 | 130 | 0 |
| C | 0 | 130 | 0 |
| D | 0 | 130 | 0 |
| Mode M9 | |||
|---|---|---|---|
| Quadrant | BADHDUFLAG | Total packets | Discarded packets |
| A | 0 | 12 | 0 |
| B | 0 | 12 | 0 |
| C | 0 | 12 | 0 |
| D | 0 | 12 | 0 |
| Quadrant | Total seconds | Saturated seconds | Saturation percentage |
|---|---|---|---|
| A | 6425 | 98 | 1.525292% |
| B | 6425 | 80 | 1.245136% |
| C | 6425 | 102 | 1.587549% |
| D | 6424 | 252 | 3.922790% |
Noise dominated data is calculated using 1-second bins in cleaned event files. If a bin has >2000 counts, and if more than 50% of those come from <1% of pixels, then it is considered to be noise-dominated and hence unusable.
| Quadrant | # 1 sec bins | Bins with >0 counts | Bins with >2000 counts | High rate bins dominated by noise | Noise dominated (total time) | Noise dominated (detector-on time) | Marked lightcurve |
|---|---|---|---|---|---|---|---|
| A | 7575 | 6426 | 4 | 4 | 0.05% | 0.06% | 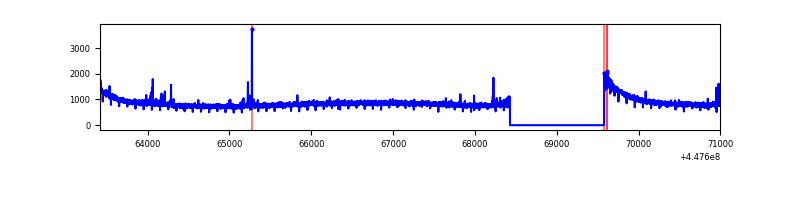 |
| B | 7575 | 6426 | 42 | 42 | 0.55% | 0.65% | 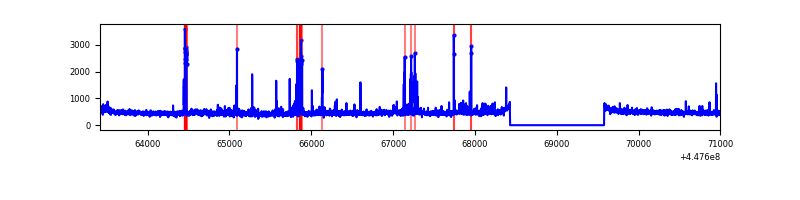 |
| C | 7575 | 6425 | 87 | 87 | 1.15% | 1.35% | 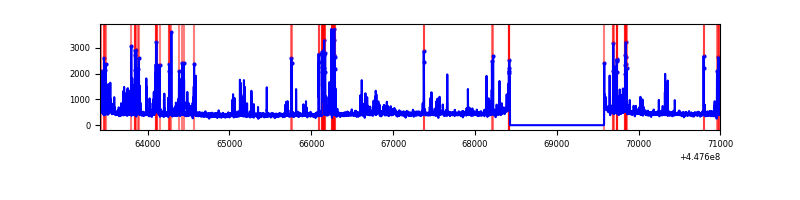 |
| D | 7574 | 6425 | 233 | 233 | 3.08% | 3.63% | 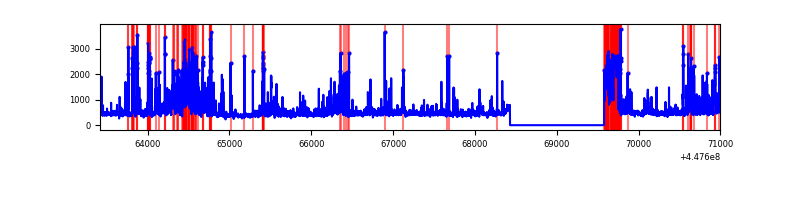 |
Top three noisy pixels from each quadrant. If the there are fewer than three noisy pixels in the level2.evt file, extra rows are filled as -1
| Pixel properties | Quadrant properties | ||||||
|---|---|---|---|---|---|---|---|
| Quadrant | DetID | PixID | Counts | Sigma | Mean | Median | Sigma |
| A | 10 | 83 | 2686705 | 18015.45 | 725 | 712 | 149.1 |
| A | 13 | 248 | 41470 | 273.37 | 725 | 712 | 149.1 |
| A | 13 | 6 | 10682 | 66.87 | 725 | 712 | 149.1 |
| B | 5 | 172 | 133557 | 953.95 | 720 | 698 | 139.3 |
| B | 7 | 221 | 53027 | 375.73 | 720 | 698 | 139.3 |
| B | 0 | 155 | 51053 | 361.56 | 720 | 698 | 139.3 |
| C | 14 | 254 | 669409 | 4113.37 | 698 | 704 | 162.6 |
| C | 0 | 207 | 9829 | 56.13 | 698 | 704 | 162.6 |
| C | 3 | 233 | 5592 | 30.07 | 698 | 704 | 162.6 |
| D | 13 | 249 | 1113617 | 6352.37 | 693 | 672 | 175.2 |
| D | 1 | 52 | 267561 | 1523.33 | 693 | 672 | 175.2 |
| D | 2 | 249 | 86039 | 487.25 | 693 | 672 | 175.2 |
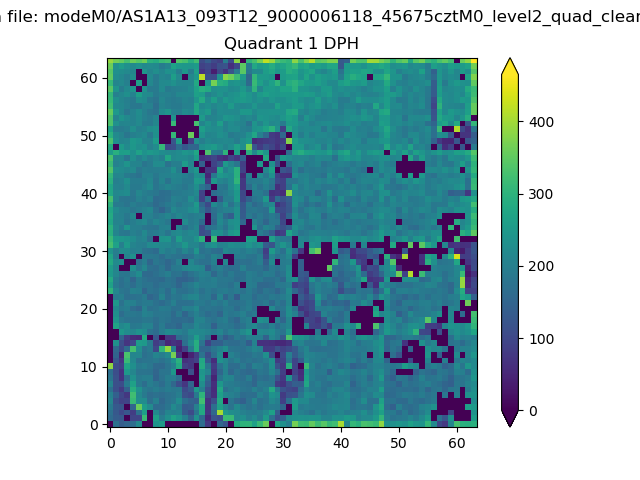
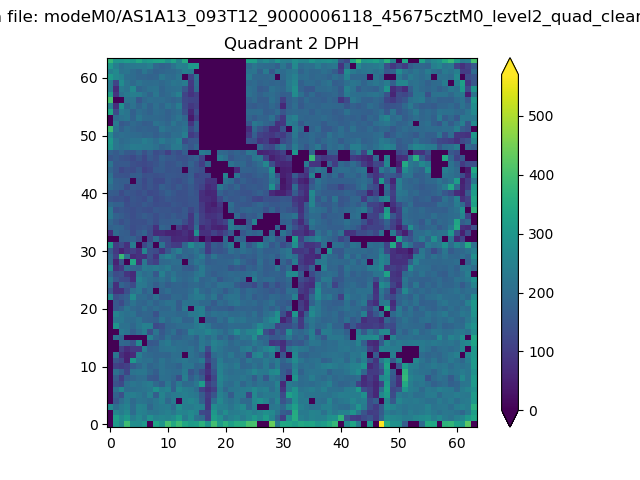
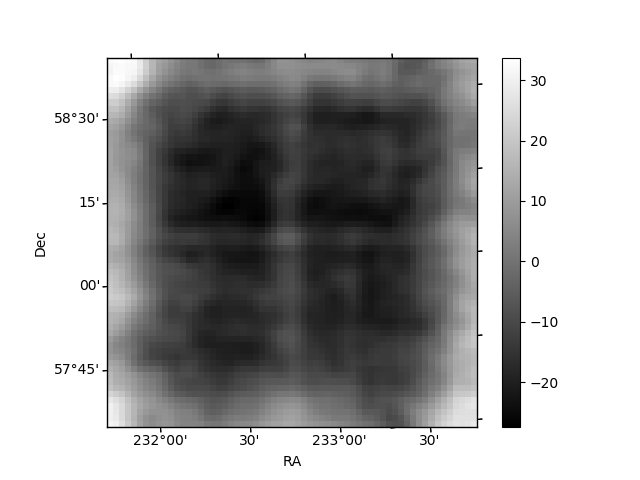
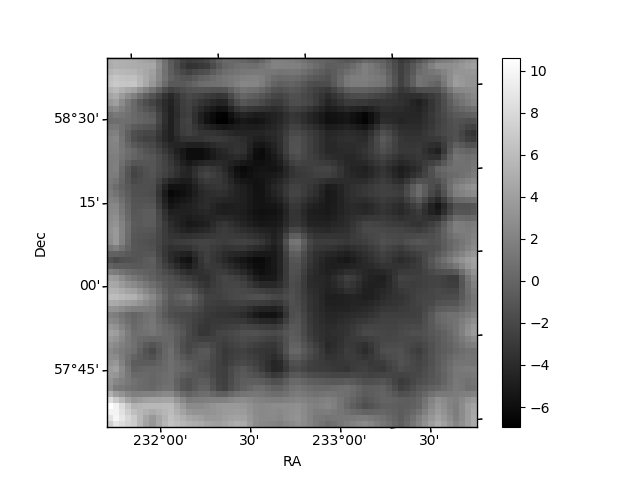
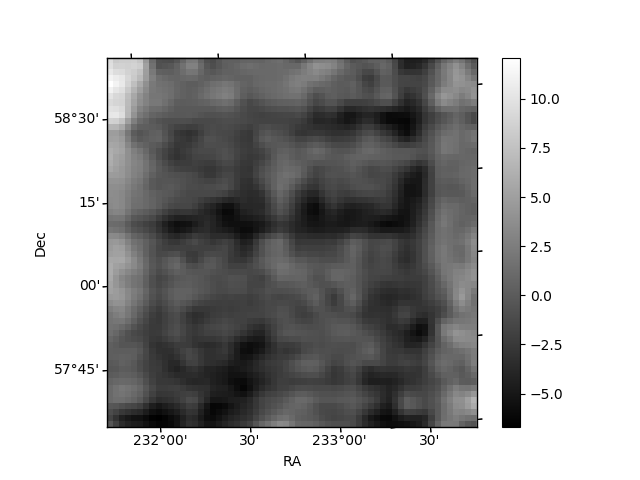
Histogram calculated using DETX and DETY for each event in the final _common_clean file
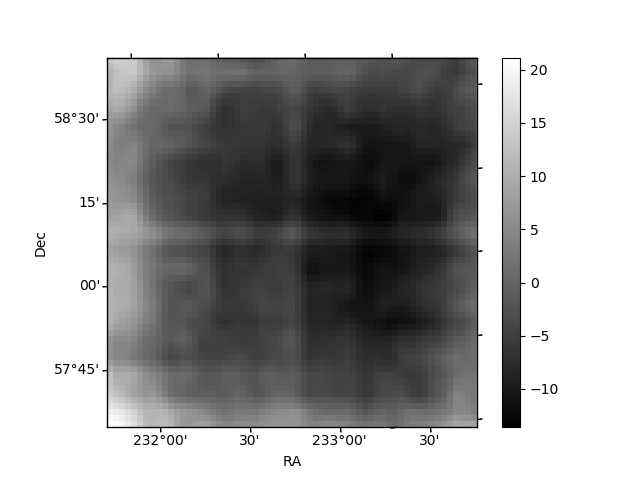
| Quadrant A |  |
 |
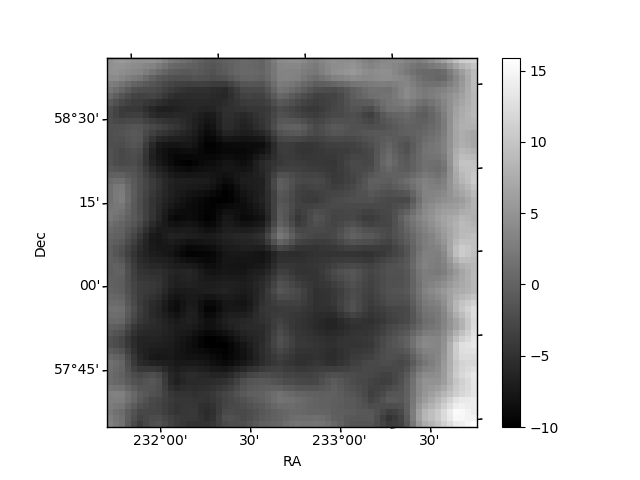
Quadrant B |
|---|---|---|---|
| Quadrant D | 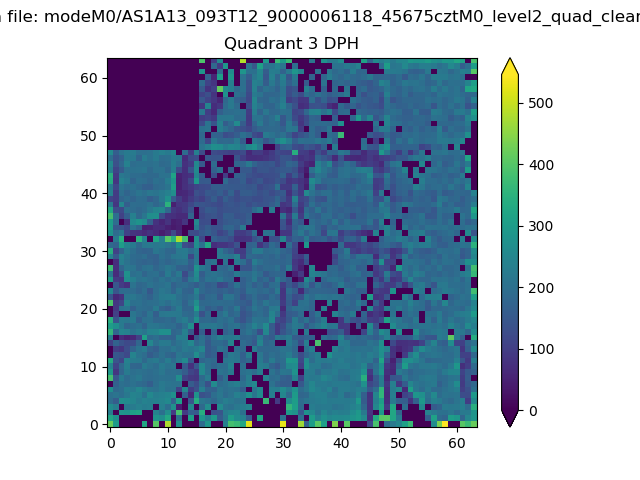 |
 |
Quadrant C |
| Plot type | Count rate plots | Images |
|---|---|---|
| Comparison with Poisson distribution Blue bars denote a histogram of data divided into 1 sec bins. Red curve is a Poisson curve with rate = median count rate of data. |
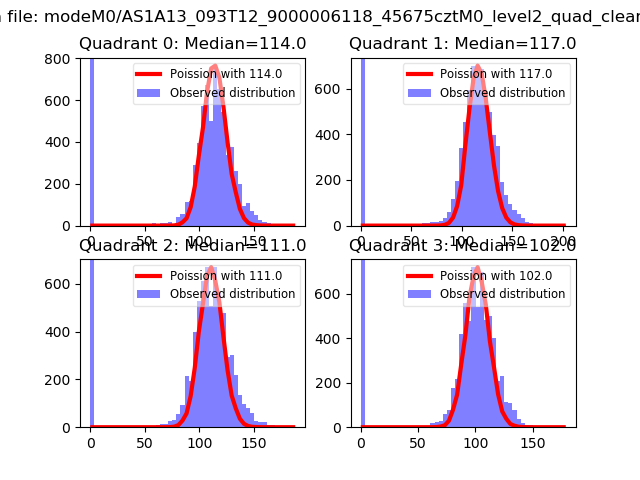 |
 |
| Quadrant-wise count rates Data is divided into 100 sec bins |
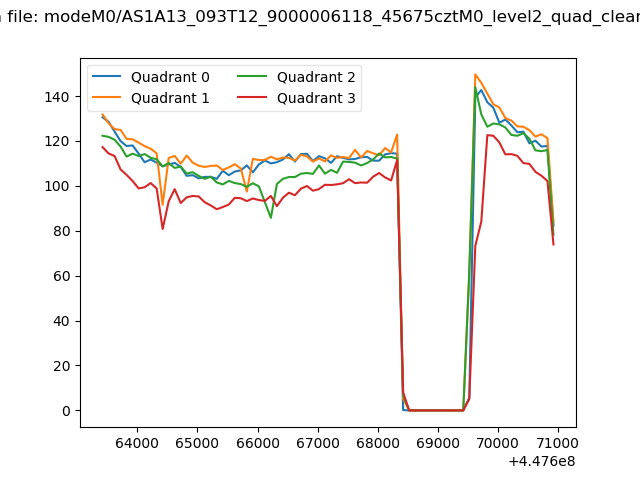 |
|
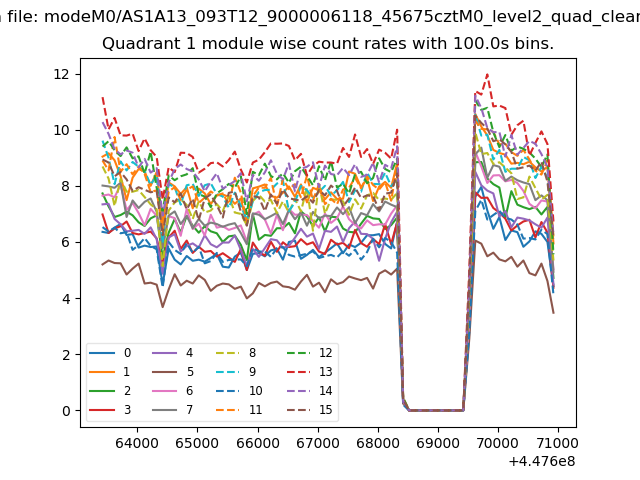
| Module-wise count rates for Quadrant A Data is divided into 100 sec bins |
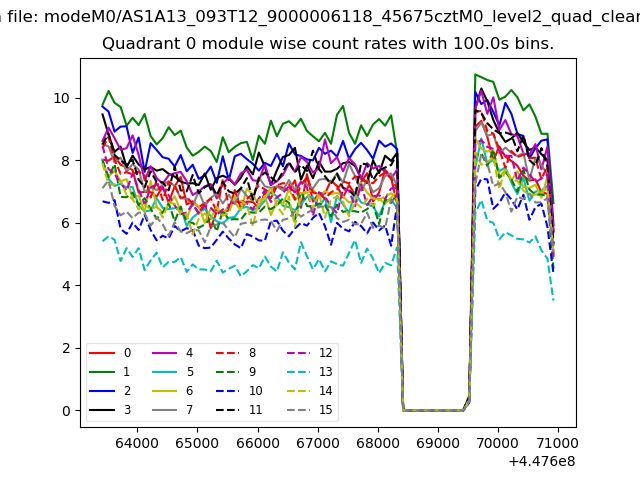 |
 |
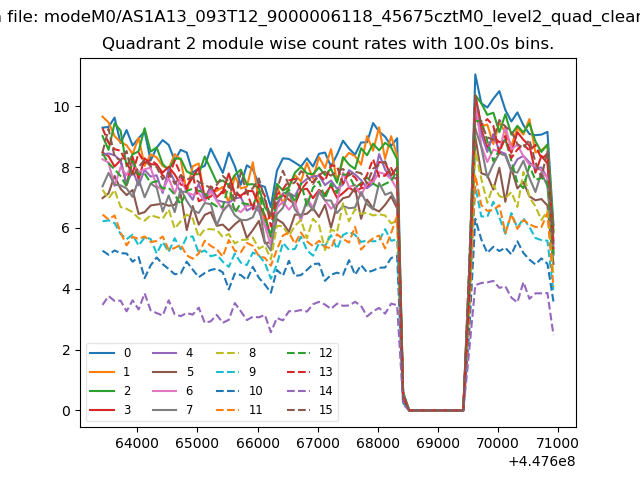
| Module-wise count rates for Quadrant B Data is divided into 100 sec bins |
 |
 |
| Module-wise count rates for Quadrant C Data is divided into 100 sec bins |
 |
 |
| Module-wise count rates for Quadrant D Data is divided into 100 sec bins |
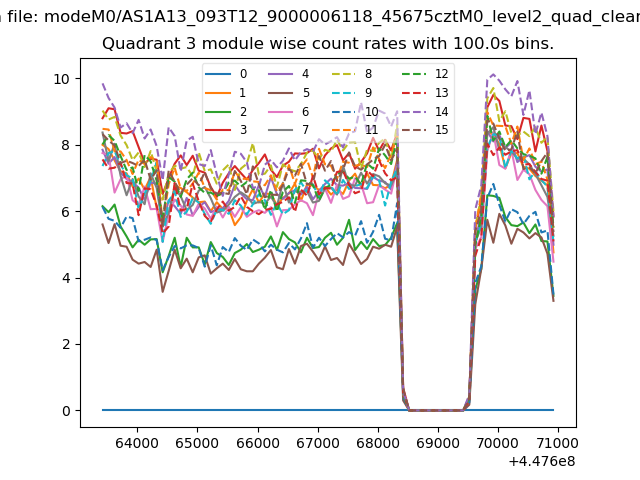 |
 |
| Parameter | Plot |
|---|---|
| CZT HV Monitor | 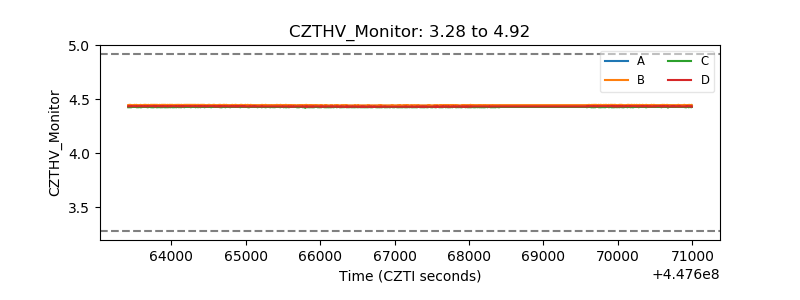 |
| D_VDD | 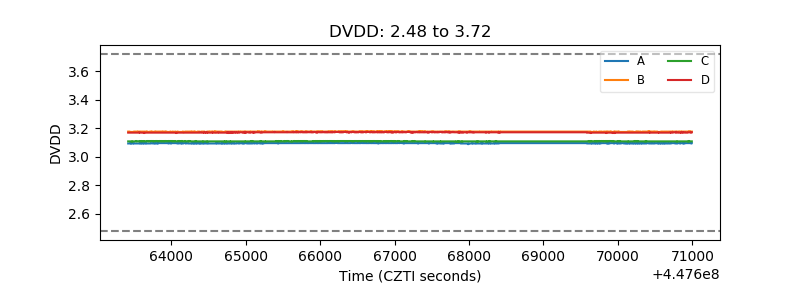 |
| Temperature 1 | 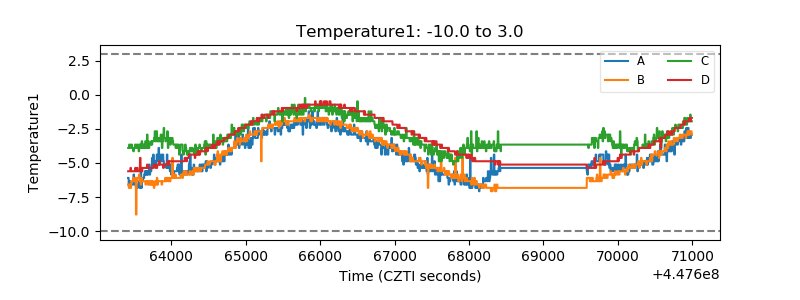 |
| Veto HV Monitor | 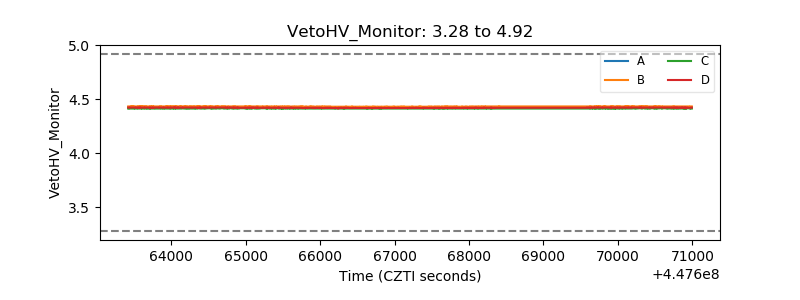 |
| Veto LLD | 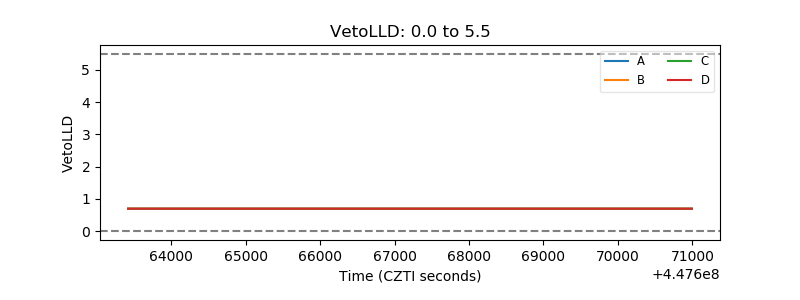 |
| Alpha Counter | 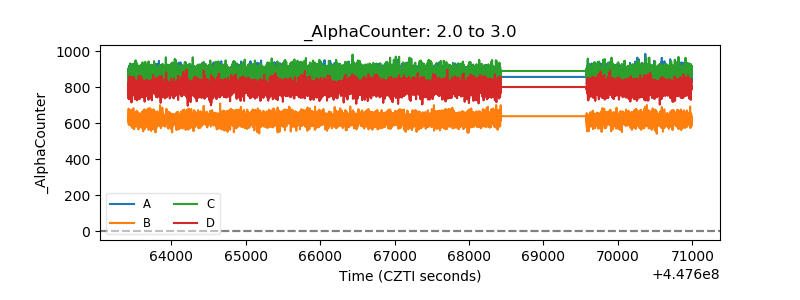 |
| _CPM_Rate | 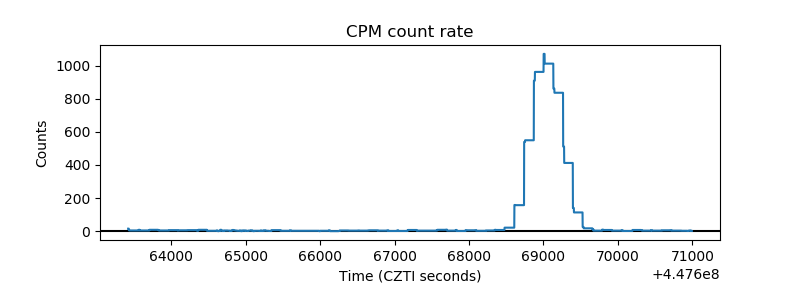 |
| CZT Counter | 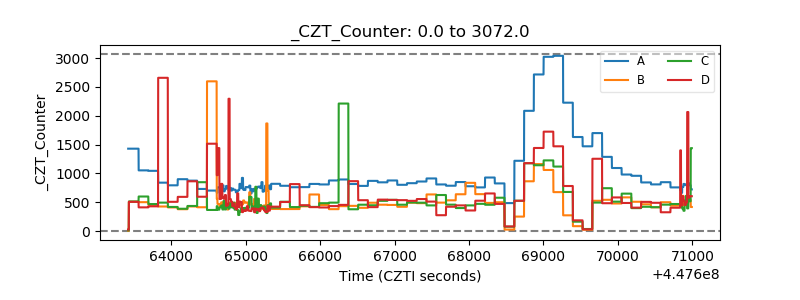 |
| +2.5 Volts monitor | 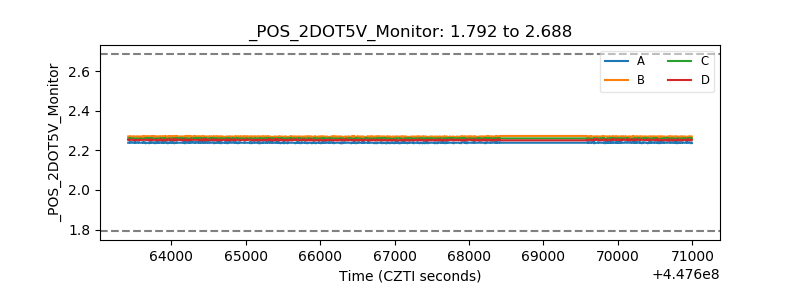 |
| +5 Volts monitor | 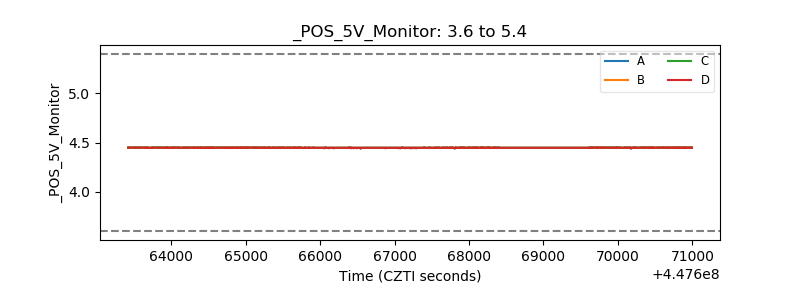 |
| _ROLL_ROT | 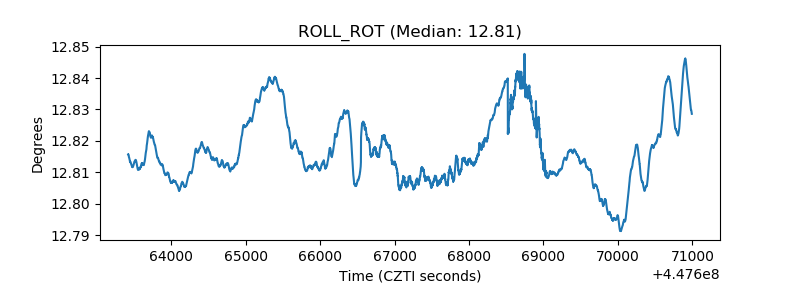 |
| _Roll_DEC | 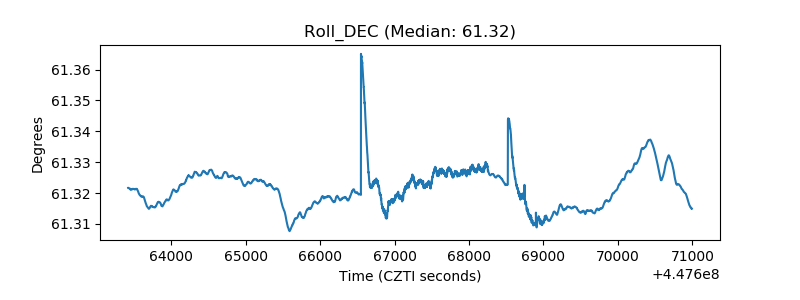 |
| _Roll_RA | 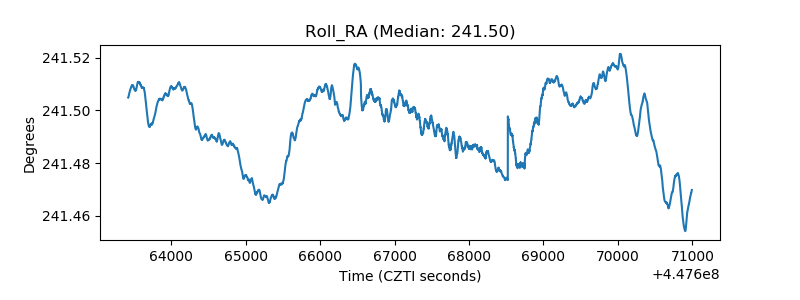 |
| Veto Counter | 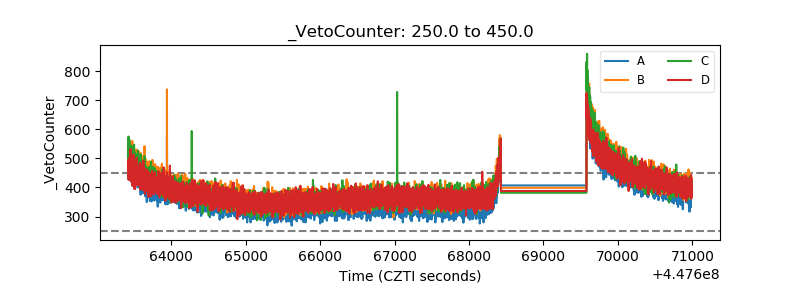 |