| Param | Original file | Final file |
|---|---|---|
| Filename | modeM0/AS1A13_093T12_9000006118_45676cztM0_level2.fits | modeM0/AS1A13_093T12_9000006118_45676cztM0_level2_quad_clean.evt |
| Size (bytes) | 417,597,120 | 99,426,240 |
| Size | 398.3 MB | 94.8 MB |
| Events in quadrant A | 5,110,897 | 669,486 |
| Events in quadrant B | 2,927,383 | 692,945 |
| Events in quadrant C | 2,931,596 | 653,964 |
| Events in quadrant D | 4,043,578 | 594,078 |
| Mode M0 | |||
|---|---|---|---|
| Quadrant | BADHDUFLAG | Total packets | Discarded packets |
| A | 0 | 18641 | 1 |
| B | 0 | 12426 | 1 |
| C | 0 | 12648 | 1 |
| D | 0 | 15817 | 1 |
| Mode SS | |||
|---|---|---|---|
| Quadrant | BADHDUFLAG | Total packets | Discarded packets |
| A | 0 | 116 | 0 |
| B | 0 | 116 | 0 |
| C | 0 | 116 | 0 |
| D | 0 | 116 | 0 |
| Mode M9 | |||
|---|---|---|---|
| Quadrant | BADHDUFLAG | Total packets | Discarded packets |
| A | 0 | 12 | 0 |
| B | 0 | 12 | 0 |
| C | 0 | 12 | 0 |
| D | 0 | 12 | 0 |
| Quadrant | Total seconds | Saturated seconds | Saturation percentage |
|---|---|---|---|
| A | 5725 | 178 | 3.109170% |
| B | 5726 | 87 | 1.519385% |
| C | 5726 | 102 | 1.781348% |
| D | 5726 | 256 | 4.470835% |
Noise dominated data is calculated using 1-second bins in cleaned event files. If a bin has >2000 counts, and if more than 50% of those come from <1% of pixels, then it is considered to be noise-dominated and hence unusable.
| Quadrant | # 1 sec bins | Bins with >0 counts | Bins with >2000 counts | High rate bins dominated by noise | Noise dominated (total time) | Noise dominated (detector-on time) | Marked lightcurve |
|---|---|---|---|---|---|---|---|
| A | 6915 | 5725 | 9 | 9 | 0.13% | 0.16% | 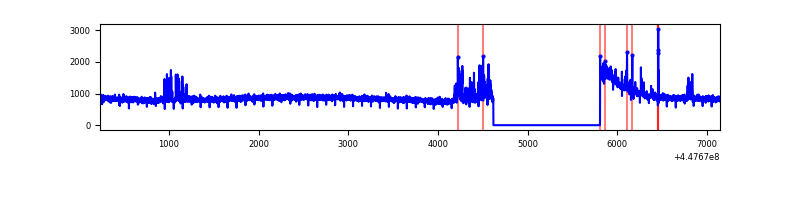 |
| B | 6916 | 5726 | 11 | 11 | 0.16% | 0.19% | 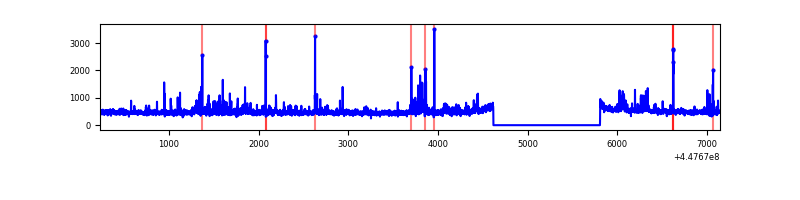 |
| C | 6916 | 5727 | 46 | 46 | 0.67% | 0.80% | 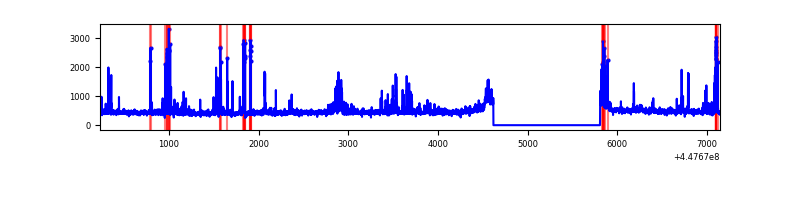 |
| D | 6916 | 5727 | 194 | 194 | 2.81% | 3.39% | 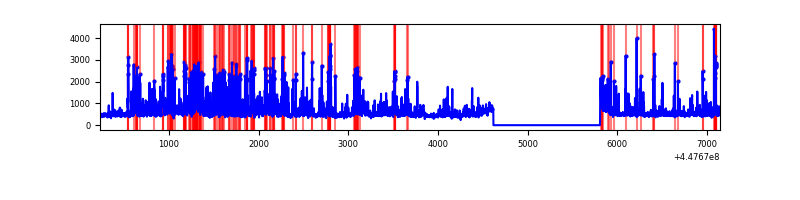 |
Top three noisy pixels from each quadrant. If the there are fewer than three noisy pixels in the level2.evt file, extra rows are filled as -1
| Pixel properties | Quadrant properties | ||||||
|---|---|---|---|---|---|---|---|
| Quadrant | DetID | PixID | Counts | Sigma | Mean | Median | Sigma |
| A | 10 | 83 | 2367865 | 17435.27 | 662 | 650 | 135.8 |
| A | 13 | 248 | 165627 | 1215.11 | 662 | 650 | 135.8 |
| A | 13 | 6 | 10693 | 73.97 | 662 | 650 | 135.8 |
| B | 5 | 172 | 62231 | 483.13 | 658 | 640 | 127.5 |
| B | 5 | 255 | 54074 | 419.14 | 658 | 640 | 127.5 |
| B | 0 | 190 | 48204 | 373.1 | 658 | 640 | 127.5 |
| C | 14 | 254 | 318147 | 2132.63 | 642 | 644 | 148.9 |
| C | 1 | 3 | 65005 | 432.3 | 642 | 644 | 148.9 |
| C | 0 | 207 | 18910 | 122.69 | 642 | 644 | 148.9 |
| D | 1 | 52 | 1025420 | 6296.4 | 645 | 624 | 162.8 |
| D | 13 | 249 | 353097 | 2165.61 | 645 | 624 | 162.8 |
| D | 2 | 249 | 92366 | 563.67 | 645 | 624 | 162.8 |
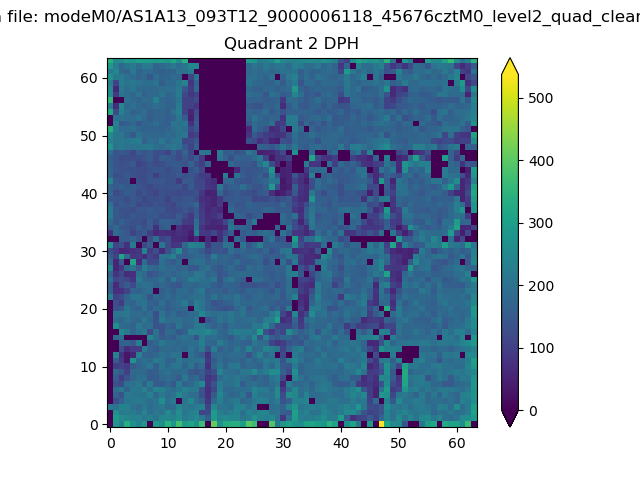
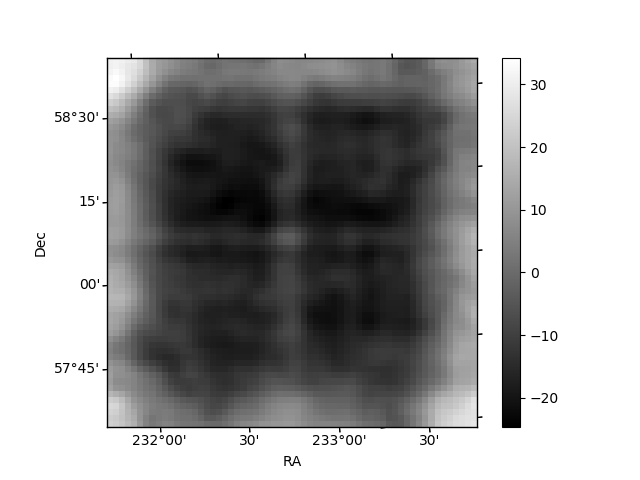
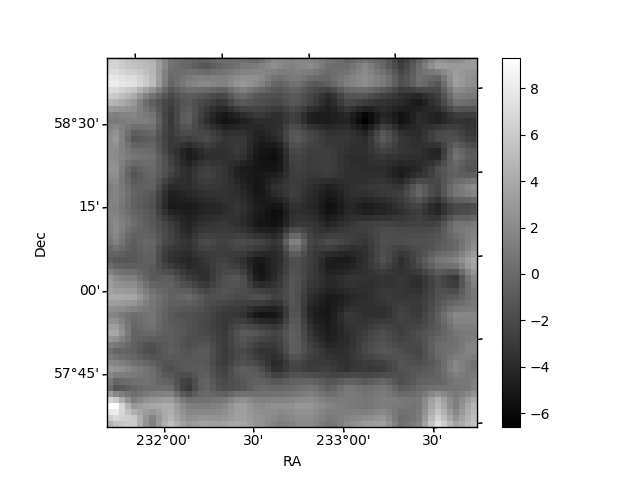
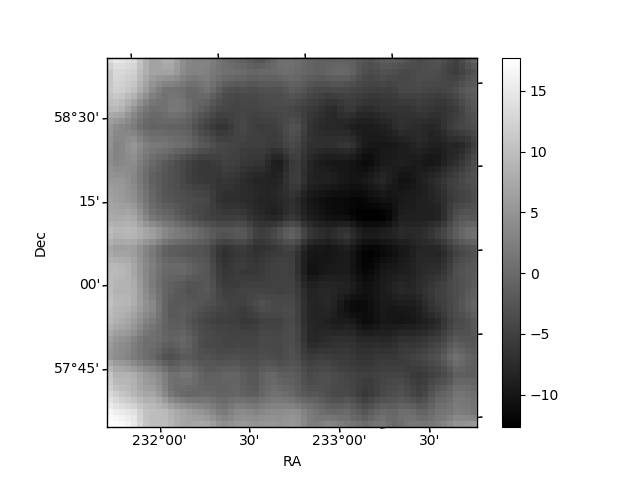
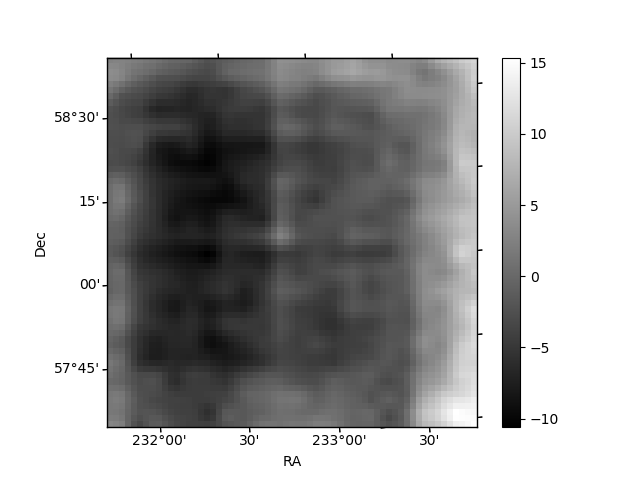
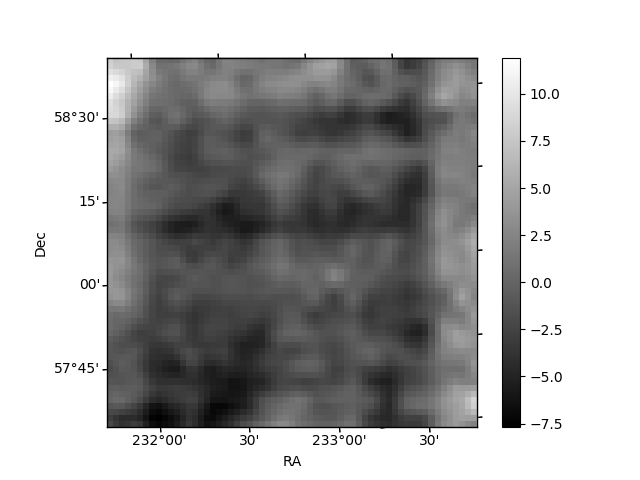
Histogram calculated using DETX and DETY for each event in the final _common_clean file
| Quadrant A | 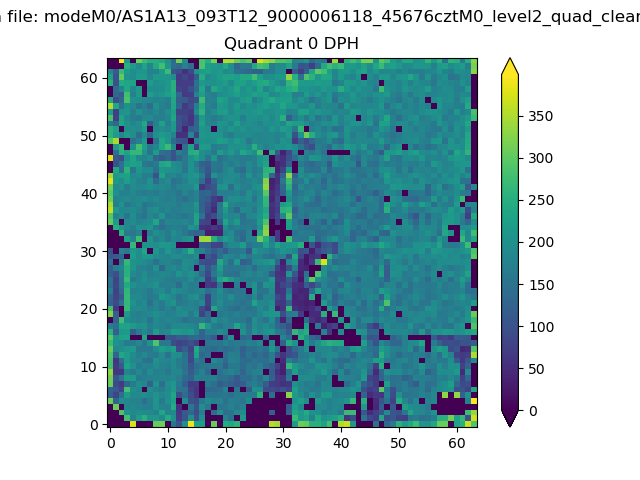 |
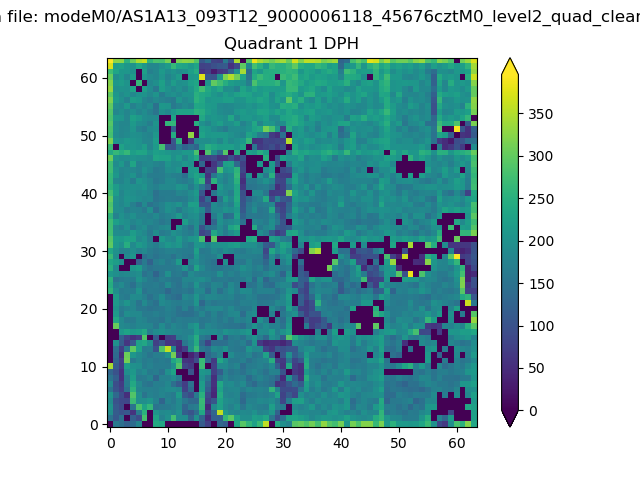 |
Quadrant B |
|---|---|---|---|
| Quadrant D | 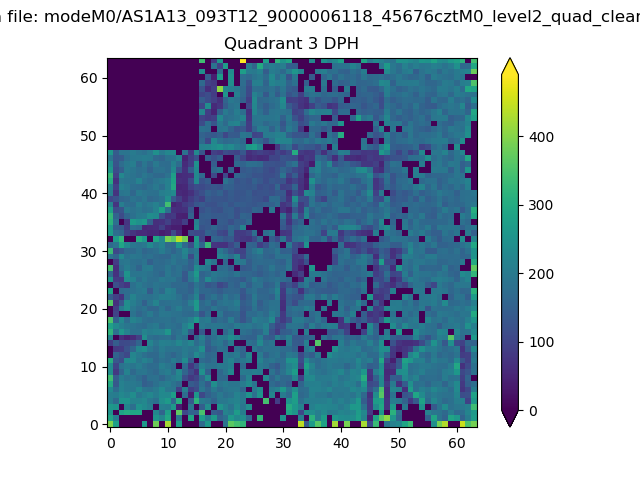 |
 |
Quadrant C |
| Plot type | Count rate plots | Images |
|---|---|---|
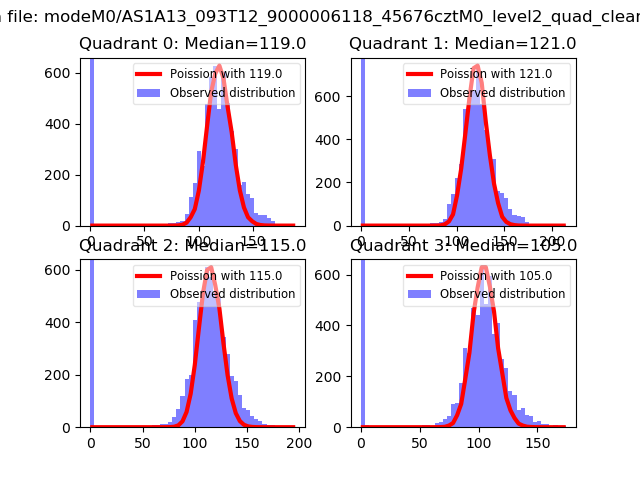
| Comparison with Poisson distribution Blue bars denote a histogram of data divided into 1 sec bins. Red curve is a Poisson curve with rate = median count rate of data. |
 |
 |
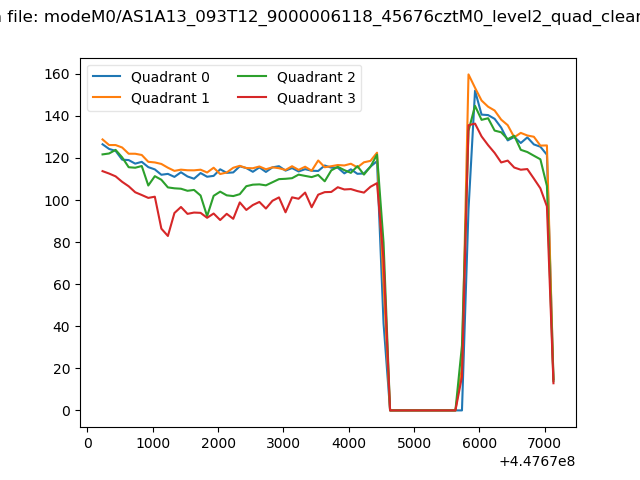
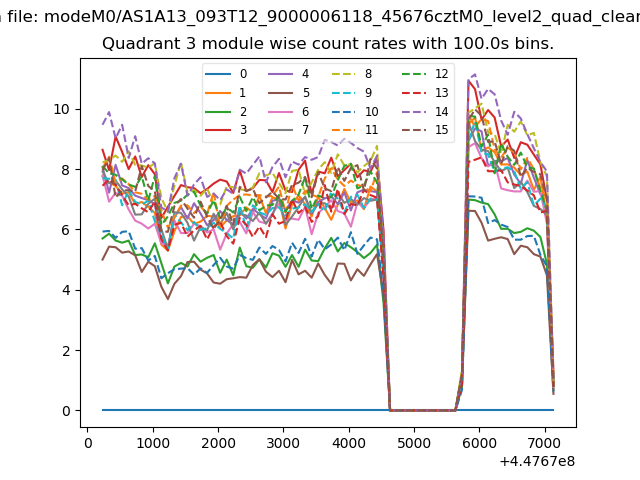
| Quadrant-wise count rates Data is divided into 100 sec bins |
 |
|
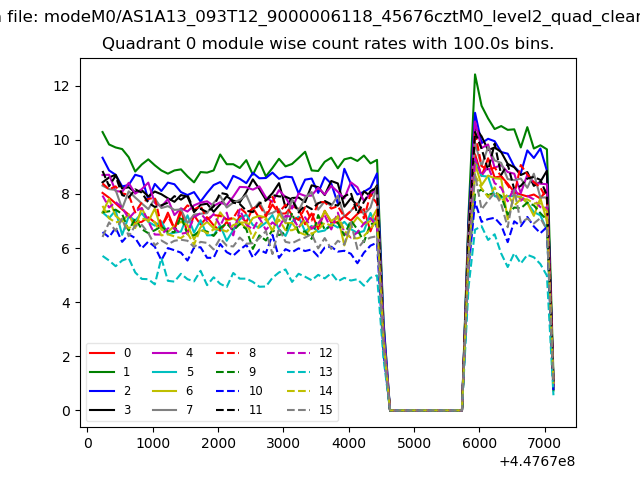
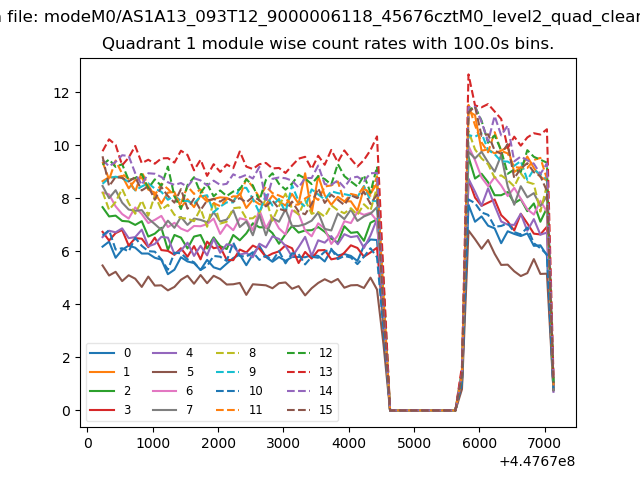
| Module-wise count rates for Quadrant A Data is divided into 100 sec bins |
 |
 |
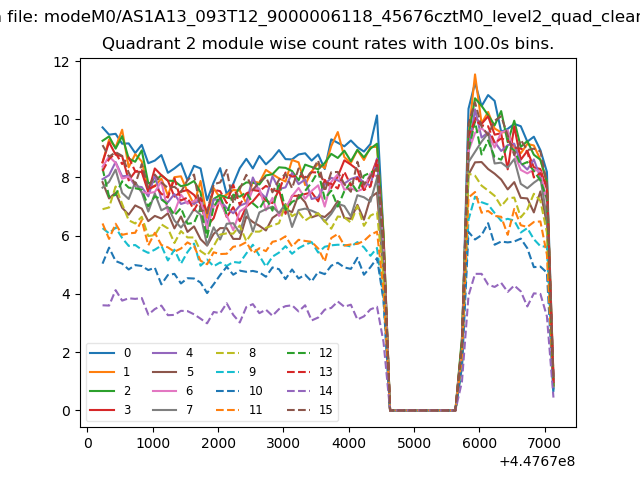
| Module-wise count rates for Quadrant B Data is divided into 100 sec bins |
 |
 |
| Module-wise count rates for Quadrant C Data is divided into 100 sec bins |
 |
 |
| Module-wise count rates for Quadrant D Data is divided into 100 sec bins |
 |
 |
| Parameter | Plot |
|---|---|
| CZT HV Monitor |  |
| D_VDD | 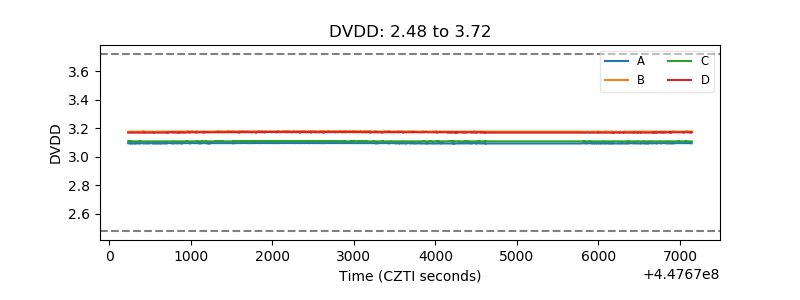 |
| Temperature 1 | 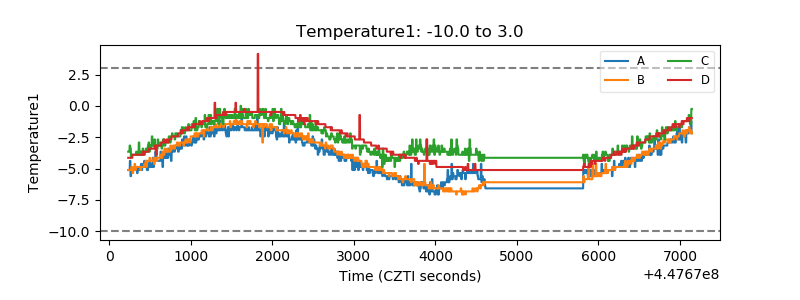 |
| Veto HV Monitor | 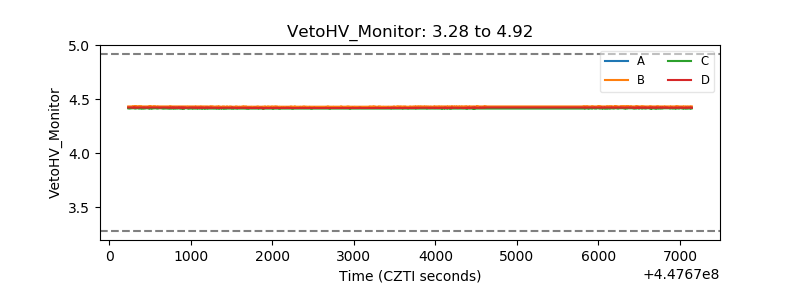 |
| Veto LLD | 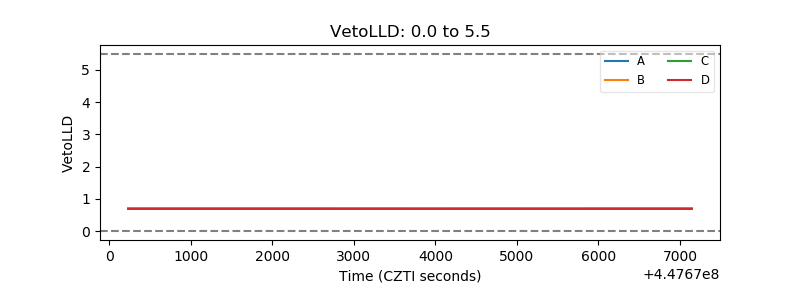 |
| Alpha Counter | 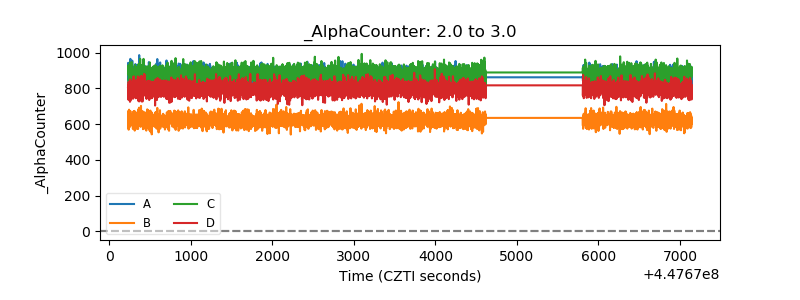 |
| _CPM_Rate | 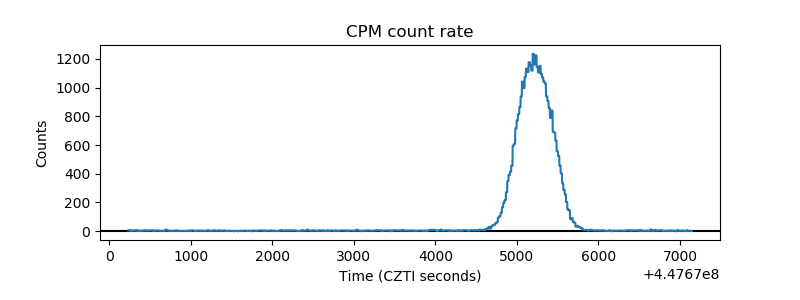 |
| CZT Counter | 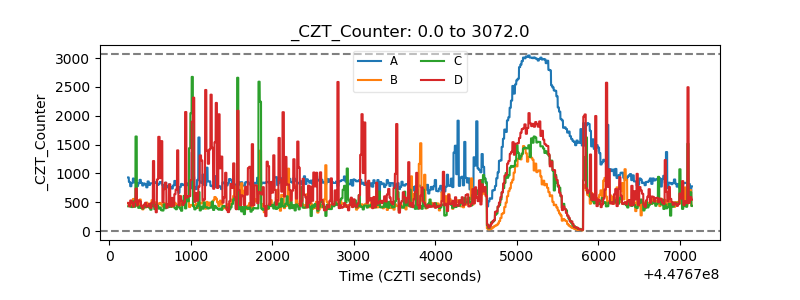 |
| +2.5 Volts monitor | 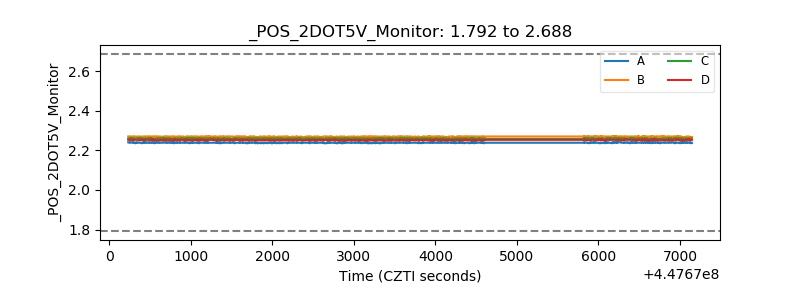 |
| +5 Volts monitor | 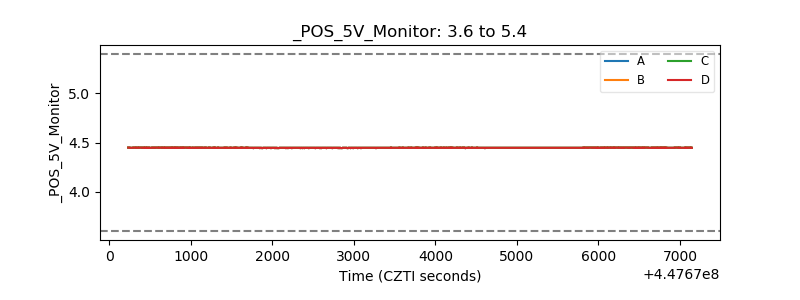 |
| _ROLL_ROT | 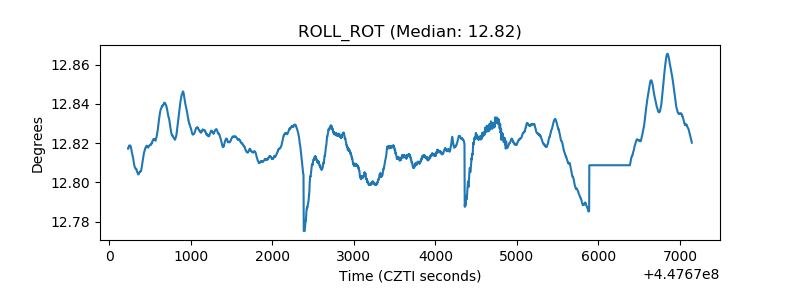 |
| _Roll_DEC | 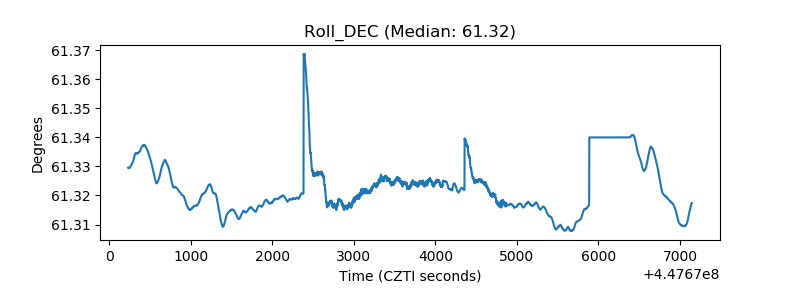 |
| _Roll_RA | 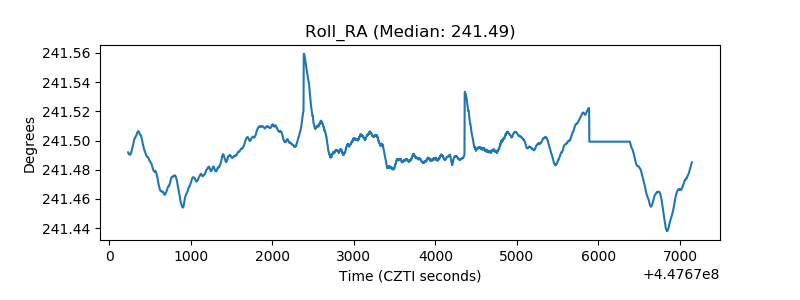 |
| Veto Counter | 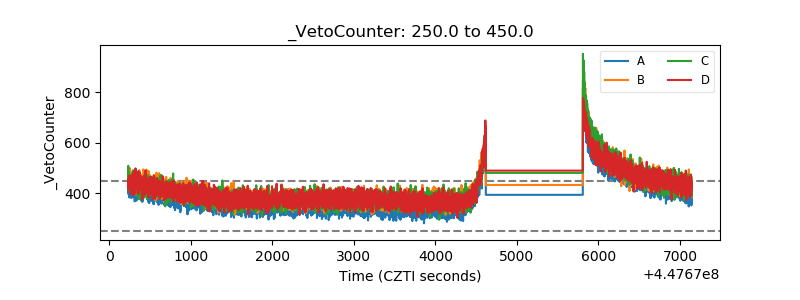 |