| Param | Original file | Final file |
|---|---|---|
| Filename | modeM0/AS1A13_093T12_9000006118_45677cztM0_level2.fits | modeM0/AS1A13_093T12_9000006118_45677cztM0_level2_quad_clean.evt |
| Size (bytes) | 457,464,960 | 106,862,400 |
| Size | 436.3 MB | 101.9 MB |
| Events in quadrant A | 5,469,837 | 726,914 |
| Events in quadrant B | 3,650,279 | 737,239 |
| Events in quadrant C | 3,262,882 | 705,606 |
| Events in quadrant D | 4,075,550 | 639,239 |
| Mode M0 | |||
|---|---|---|---|
| Quadrant | BADHDUFLAG | Total packets | Discarded packets |
| A | 0 | 19811 | 1 |
| B | 0 | 14728 | 1 |
| C | 0 | 13768 | 1 |
| D | 0 | 16235 | 1 |
| Mode SS | |||
|---|---|---|---|
| Quadrant | BADHDUFLAG | Total packets | Discarded packets |
| A | 0 | 122 | 0 |
| B | 0 | 122 | 0 |
| C | 0 | 122 | 0 |
| D | 0 | 122 | 0 |
| Mode M9 | |||
|---|---|---|---|
| Quadrant | BADHDUFLAG | Total packets | Discarded packets |
| A | 0 | 13 | 0 |
| B | 0 | 13 | 0 |
| C | 0 | 13 | 0 |
| D | 0 | 13 | 0 |
| Quadrant | Total seconds | Saturated seconds | Saturation percentage |
|---|---|---|---|
| A | 6120 | 204 | 3.333333% |
| B | 6121 | 252 | 4.116974% |
| C | 6121 | 137 | 2.238196% |
| D | 6121 | 273 | 4.460056% |
Noise dominated data is calculated using 1-second bins in cleaned event files. If a bin has >2000 counts, and if more than 50% of those come from <1% of pixels, then it is considered to be noise-dominated and hence unusable.
| Quadrant | # 1 sec bins | Bins with >0 counts | Bins with >2000 counts | High rate bins dominated by noise | Noise dominated (total time) | Noise dominated (detector-on time) | Marked lightcurve |
|---|---|---|---|---|---|---|---|
| A | 7345 | 6120 | 17 | 17 | 0.23% | 0.28% | 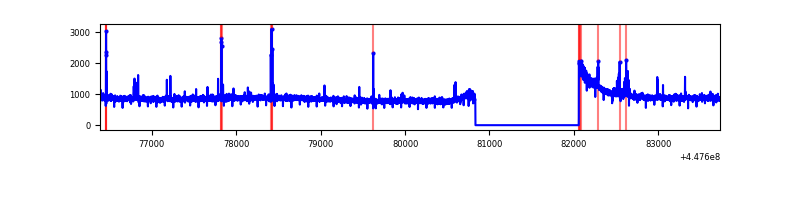 |
| B | 7346 | 6121 | 97 | 97 | 1.32% | 1.58% | 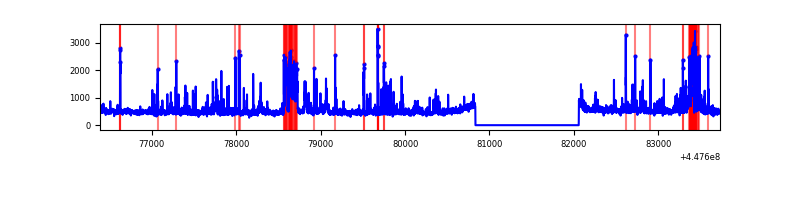 |
| C | 7346 | 6121 | 81 | 81 | 1.10% | 1.32% | 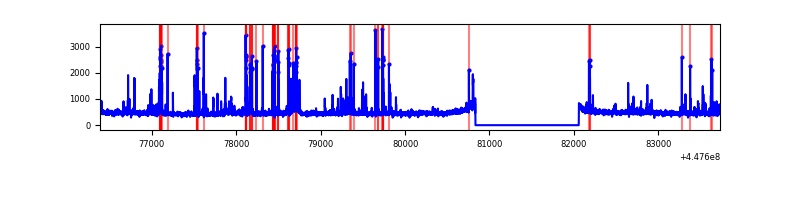 |
| D | 7346 | 6121 | 138 | 138 | 1.88% | 2.25% | 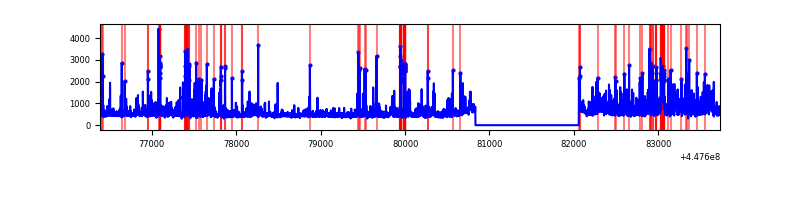 |
Top three noisy pixels from each quadrant. If the there are fewer than three noisy pixels in the level2.evt file, extra rows are filled as -1
| Pixel properties | Quadrant properties | ||||||
|---|---|---|---|---|---|---|---|
| Quadrant | DetID | PixID | Counts | Sigma | Mean | Median | Sigma |
| A | 10 | 83 | 2571999 | 17316.18 | 720 | 706 | 148.5 |
| A | 13 | 248 | 69015 | 460.02 | 720 | 706 | 148.5 |
| A | 0 | 243 | 14994 | 96.22 | 720 | 706 | 148.5 |
| B | 5 | 172 | 260933 | 1910.88 | 706 | 686 | 136.2 |
| B | 12 | 18 | 163400 | 1194.74 | 706 | 686 | 136.2 |
| B | 0 | 186 | 80184 | 583.72 | 706 | 686 | 136.2 |
| C | 14 | 254 | 388072 | 2397.5 | 695 | 698 | 161.6 |
| C | 0 | 207 | 90738 | 557.27 | 695 | 698 | 161.6 |
| C | 9 | 54 | 32960 | 199.67 | 695 | 698 | 161.6 |
| D | 1 | 52 | 792083 | 4536.19 | 697 | 676 | 174.5 |
| D | 13 | 249 | 290372 | 1660.48 | 697 | 676 | 174.5 |
| D | 12 | 1 | 103397 | 588.78 | 697 | 676 | 174.5 |
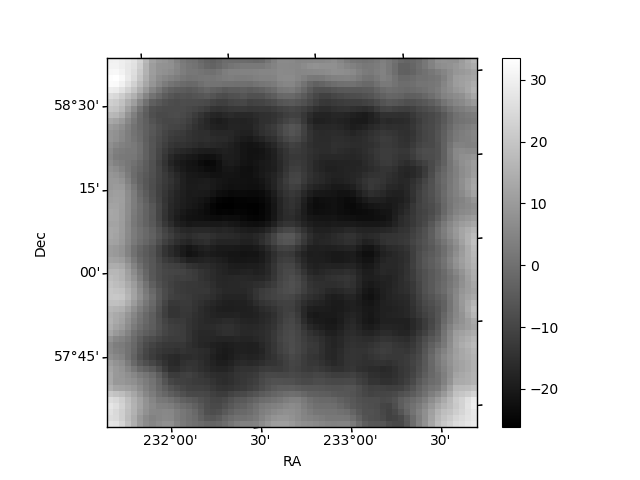
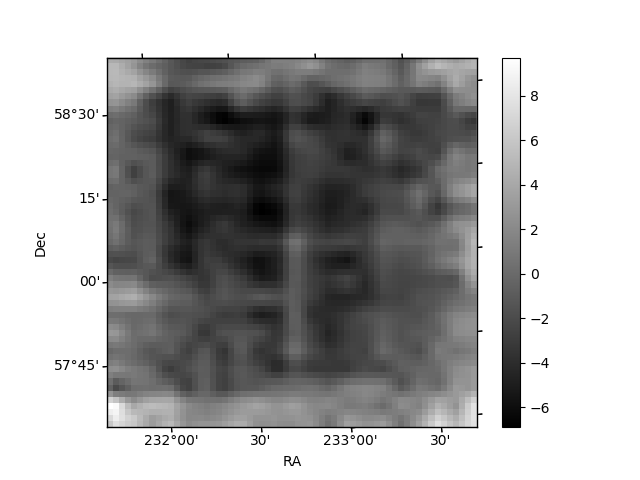
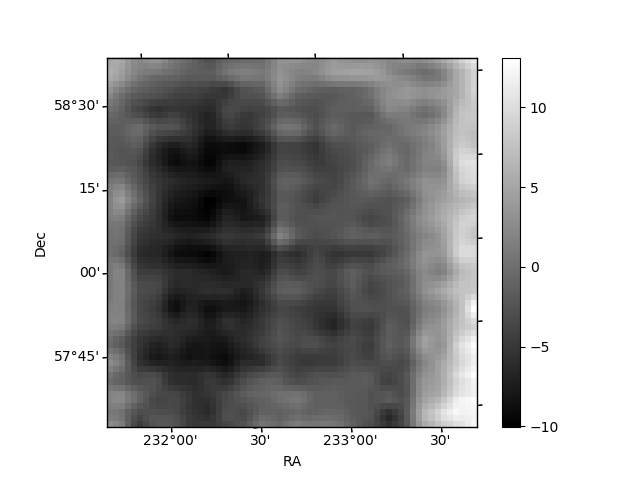
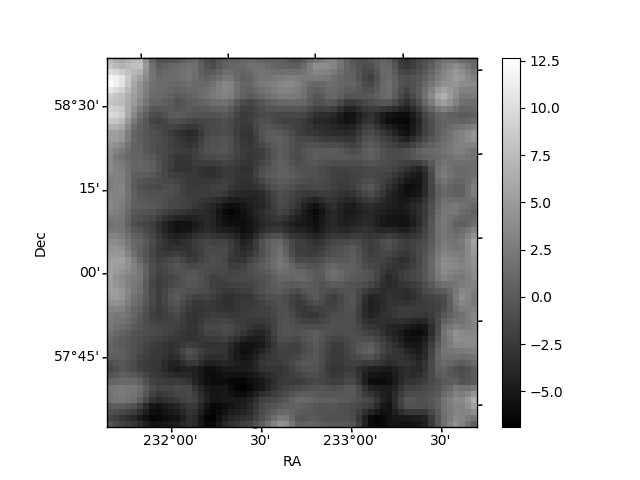
Histogram calculated using DETX and DETY for each event in the final _common_clean file
| Quadrant A | 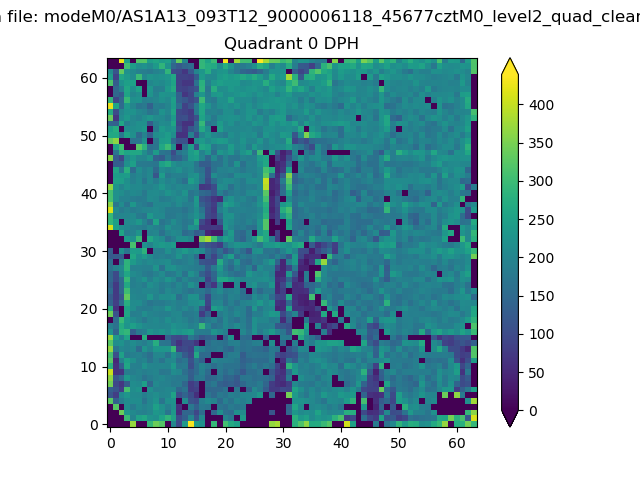 |
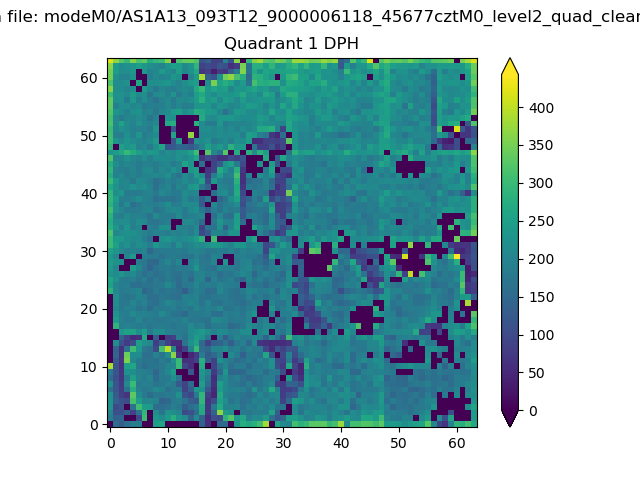 |
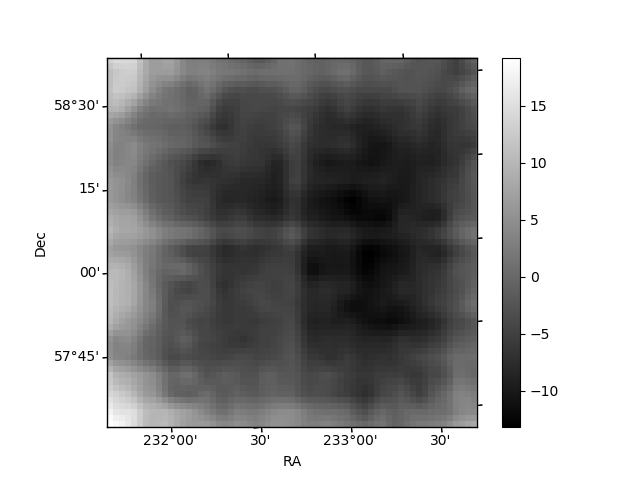
Quadrant B |
|---|---|---|---|
| Quadrant D | 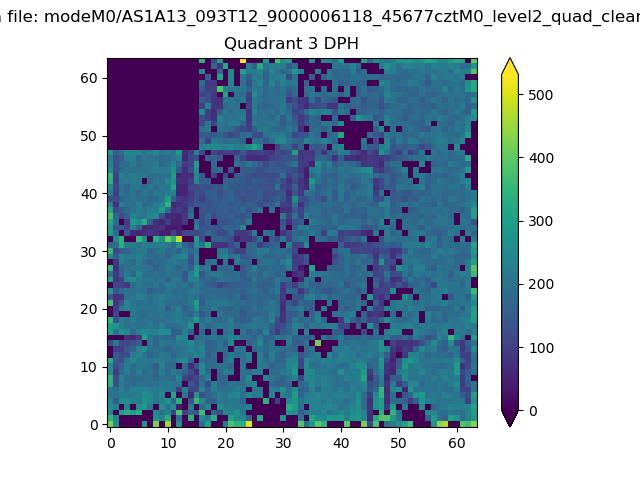 |
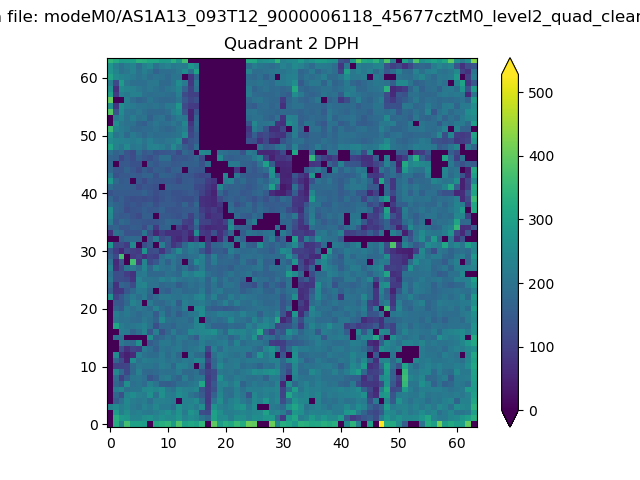 |
Quadrant C |
| Plot type | Count rate plots | Images |
|---|---|---|
| Comparison with Poisson distribution Blue bars denote a histogram of data divided into 1 sec bins. Red curve is a Poisson curve with rate = median count rate of data. |
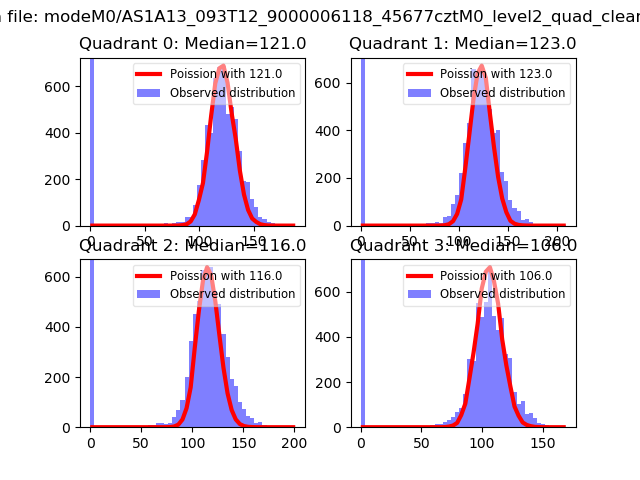 |
 |
| Quadrant-wise count rates Data is divided into 100 sec bins |
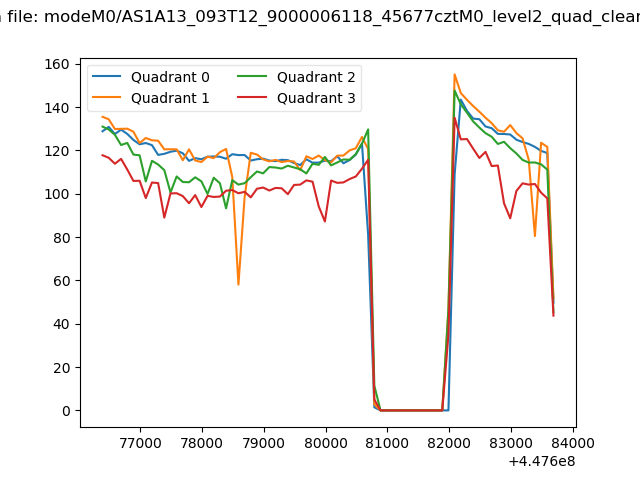 |
|
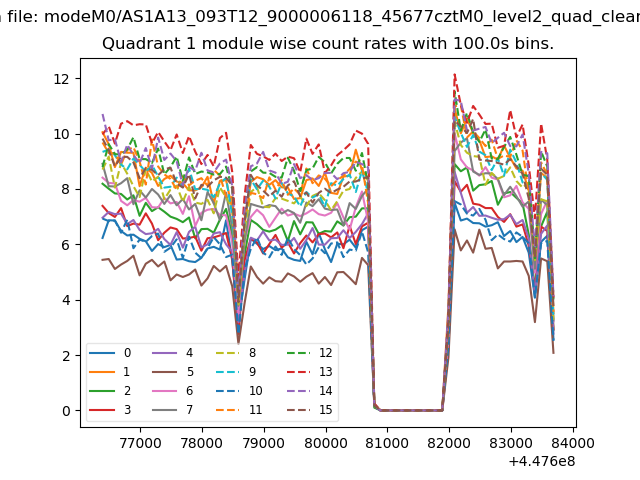
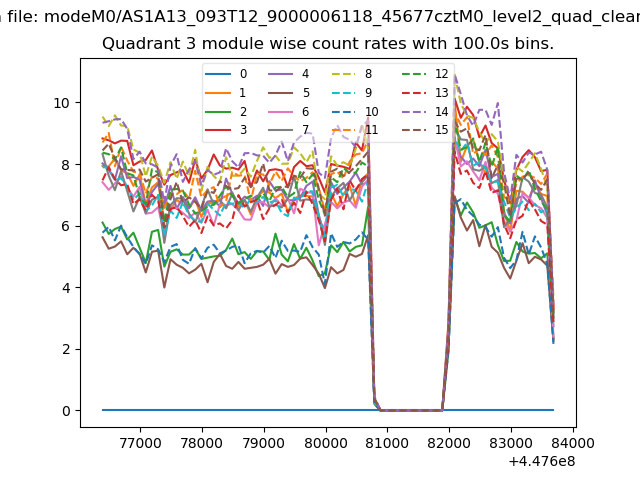
| Module-wise count rates for Quadrant A Data is divided into 100 sec bins |
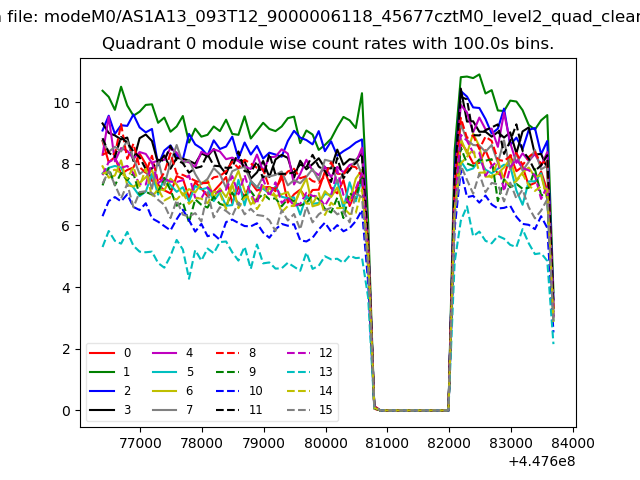 |
 |
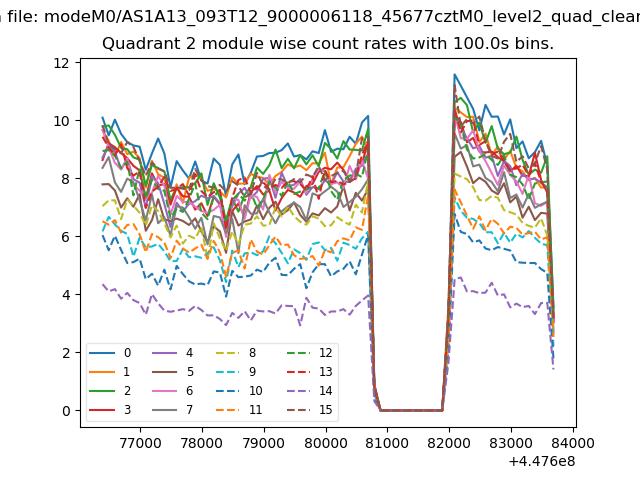
| Module-wise count rates for Quadrant B Data is divided into 100 sec bins |
 |
 |
| Module-wise count rates for Quadrant C Data is divided into 100 sec bins |
 |
 |
| Module-wise count rates for Quadrant D Data is divided into 100 sec bins |
 |
 |
| Parameter | Plot |
|---|---|
| CZT HV Monitor | 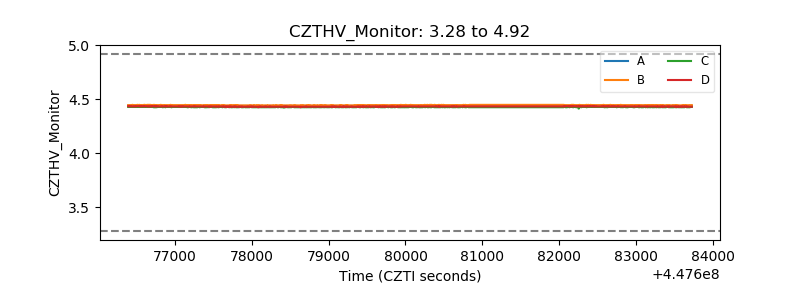 |
| D_VDD | 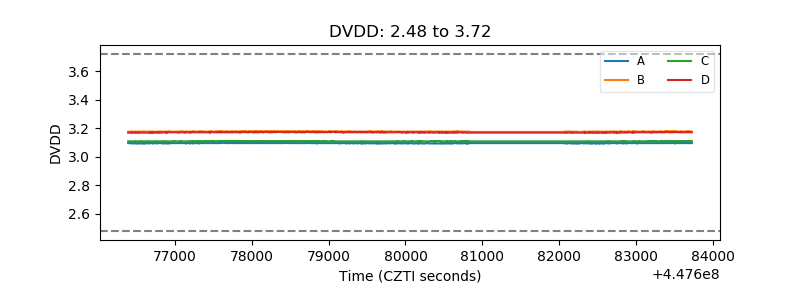 |
| Temperature 1 | 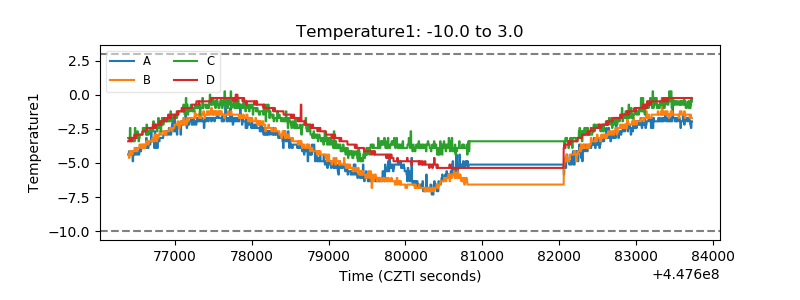 |
| Veto HV Monitor | 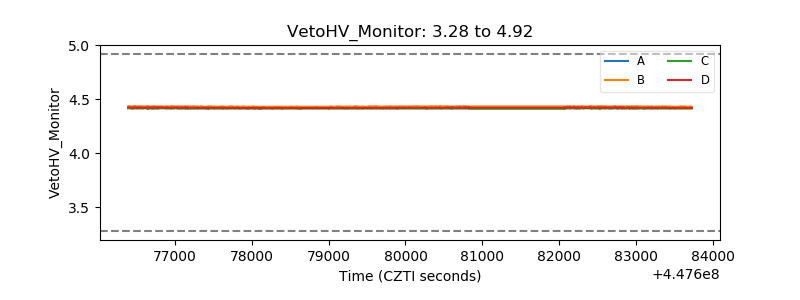 |
| Veto LLD | 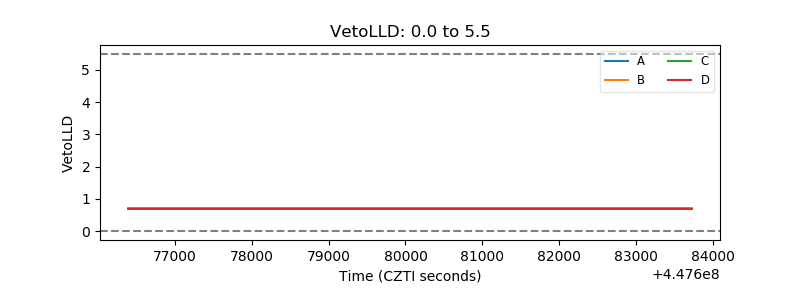 |
| Alpha Counter | 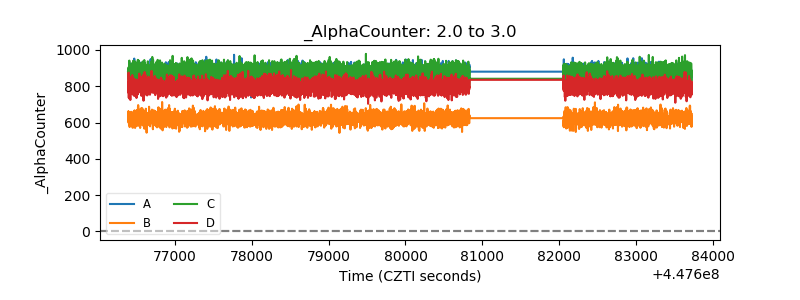 |
| _CPM_Rate | 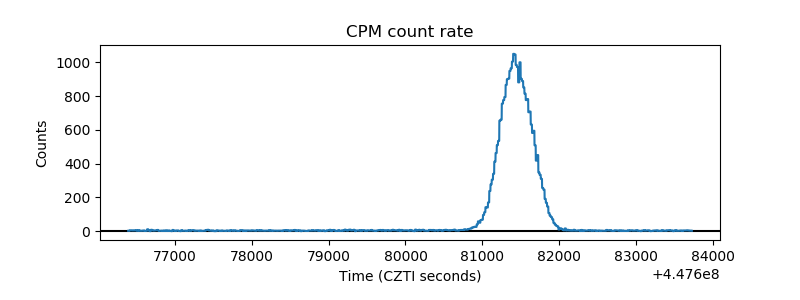 |
| CZT Counter | 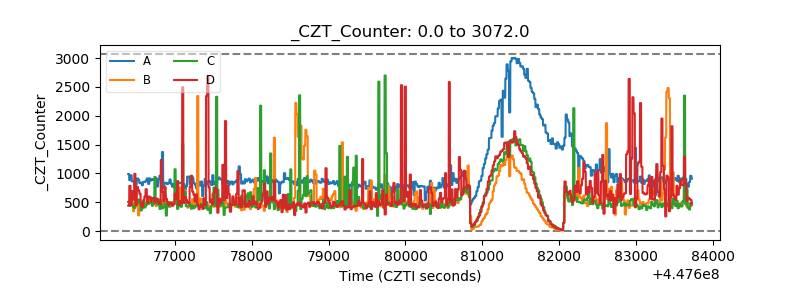 |
| +2.5 Volts monitor | 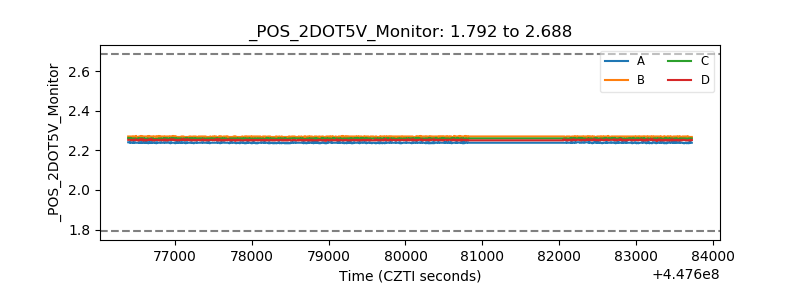 |
| +5 Volts monitor |  |
| _ROLL_ROT | 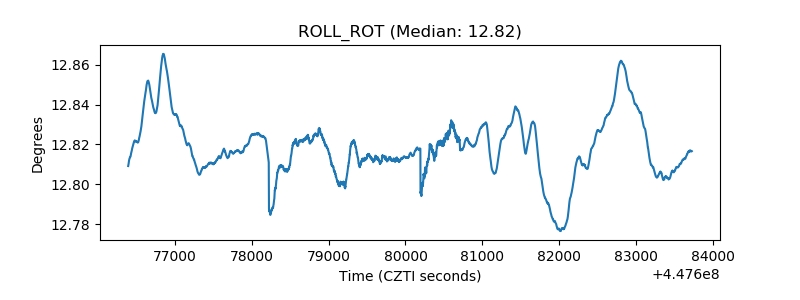 |
| _Roll_DEC | 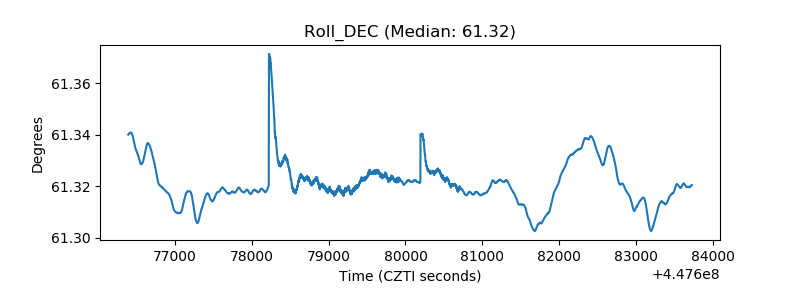 |
| _Roll_RA | 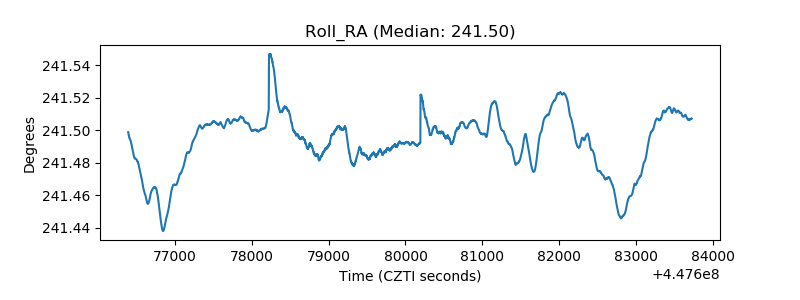 |
| Veto Counter | 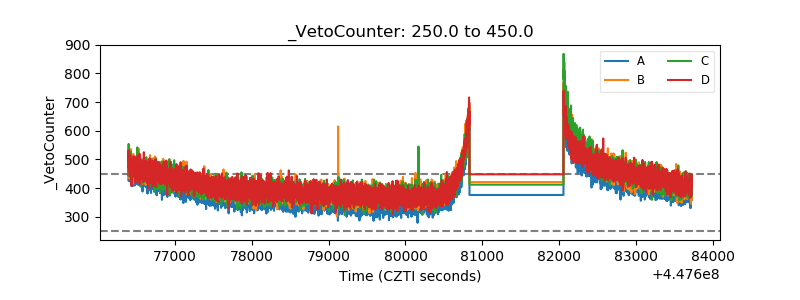 |