| Param | Original file | Final file |
|---|---|---|
| Filename | modeM0/AS1A13_071T05_9000006120_45678cztM0_level2.fits | modeM0/AS1A13_071T05_9000006120_45678cztM0_level2_quad_clean.evt |
| Size (bytes) | 222,768,000 | 42,808,320 |
| Size | 212.4 MB | 40.8 MB |
| Events in quadrant A | 2,465,478 | 280,866 |
| Events in quadrant B | 1,577,077 | 295,476 |
| Events in quadrant C | 1,936,286 | 283,550 |
| Events in quadrant D | 2,071,308 | 257,391 |
| Mode M0 | |||
|---|---|---|---|
| Quadrant | BADHDUFLAG | Total packets | Discarded packets |
| A | 0 | 8958 | 3 |
| B | 0 | 6227 | 1 |
| C | 0 | 7368 | 1 |
| D | 0 | 7866 | 1 |
| Mode M9 | |||
|---|---|---|---|
| Quadrant | BADHDUFLAG | Total packets | Discarded packets |
| A | 0 | 12 | 0 |
| B | 0 | 12 | 0 |
| C | 0 | 12 | 0 |
| D | 0 | 12 | 0 |
| Mode SS | |||
|---|---|---|---|
| Quadrant | BADHDUFLAG | Total packets | Discarded packets |
| A | 0 | 50 | 0 |
| B | 0 | 50 | 0 |
| C | 0 | 50 | 0 |
| D | 0 | 50 | 0 |
| Quadrant | Total seconds | Saturated seconds | Saturation percentage |
|---|---|---|---|
| A | 2498 | 259 | 10.368295% |
| B | 2498 | 190 | 7.606085% |
| C | 2498 | 226 | 9.047238% |
| D | 2498 | 265 | 10.608487% |
Noise dominated data is calculated using 1-second bins in cleaned event files. If a bin has >2000 counts, and if more than 50% of those come from <1% of pixels, then it is considered to be noise-dominated and hence unusable.
| Quadrant | # 1 sec bins | Bins with >0 counts | Bins with >2000 counts | High rate bins dominated by noise | Noise dominated (total time) | Noise dominated (detector-on time) | Marked lightcurve |
|---|---|---|---|---|---|---|---|
| A | 3618 | 2498 | 13 | 13 | 0.36% | 0.52% | 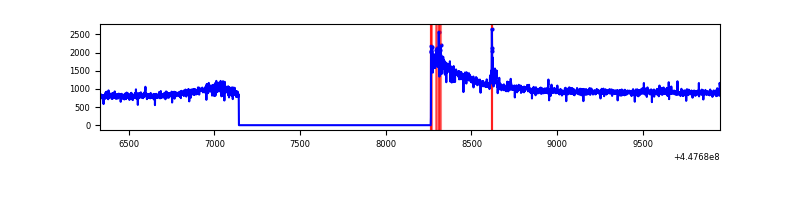 |
| B | 3618 | 2498 | 35 | 35 | 0.97% | 1.40% | 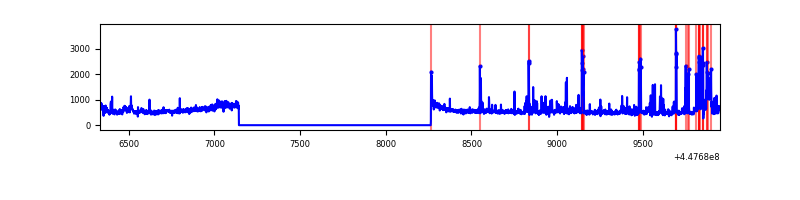 |
| C | 3617 | 2497 | 129 | 129 | 3.57% | 5.17% | 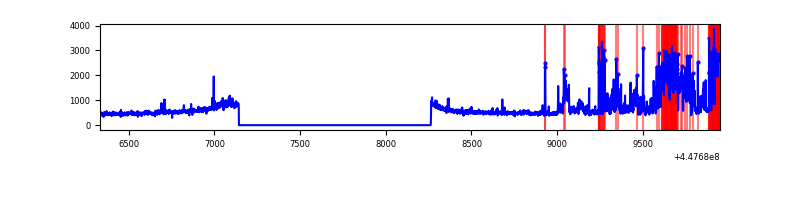 |
| D | 3618 | 2498 | 126 | 126 | 3.48% | 5.04% | 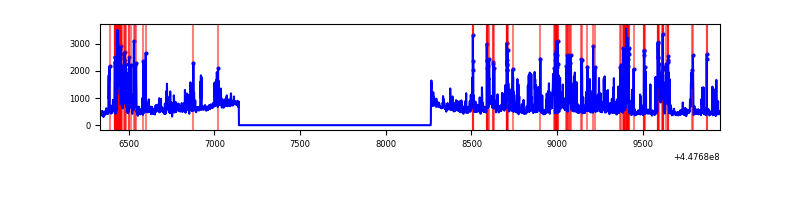 |
Top three noisy pixels from each quadrant. If the there are fewer than three noisy pixels in the level2.evt file, extra rows are filled as -1
| Pixel properties | Quadrant properties | ||||||
|---|---|---|---|---|---|---|---|
| Quadrant | DetID | PixID | Counts | Sigma | Mean | Median | Sigma |
| A | 10 | 83 | 1178325 | 17072.34 | 323 | 315 | 69.0 |
| A | 13 | 248 | 24331 | 348.05 | 323 | 315 | 69.0 |
| A | 2 | 79 | 6301 | 86.75 | 323 | 315 | 69.0 |
| B | 5 | 172 | 150822 | 2278.32 | 321 | 310 | 66.1 |
| B | 3 | 112 | 35269 | 529.18 | 321 | 310 | 66.1 |
| B | 0 | 189 | 22976 | 343.1 | 321 | 310 | 66.1 |
| C | 9 | 54 | 554328 | 7378.71 | 314 | 314 | 75.1 |
| C | 14 | 254 | 88455 | 1173.92 | 314 | 314 | 75.1 |
| C | 2 | 14 | 54628 | 723.39 | 314 | 314 | 75.1 |
| D | 1 | 52 | 641111 | 7819.59 | 318 | 308 | 81.9 |
| D | 13 | 249 | 155348 | 1891.92 | 318 | 308 | 81.9 |
| D | 5 | 171 | 32360 | 391.12 | 318 | 308 | 81.9 |
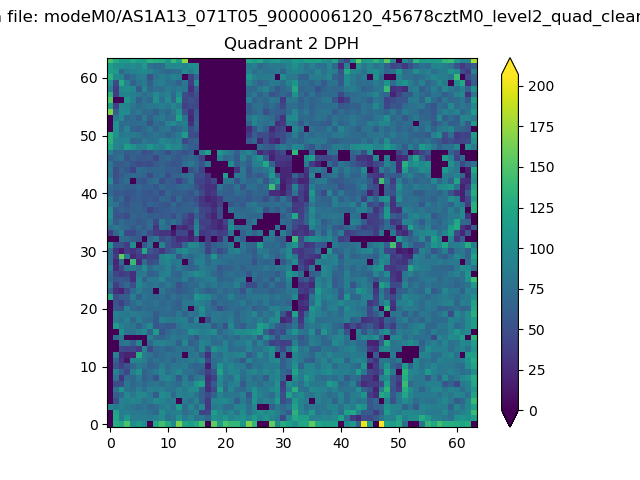
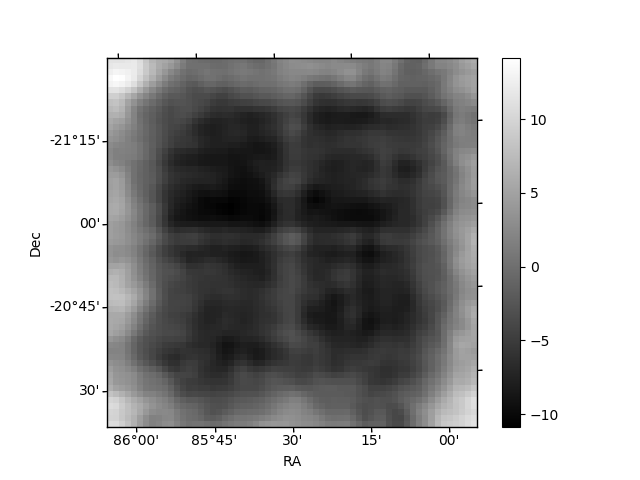
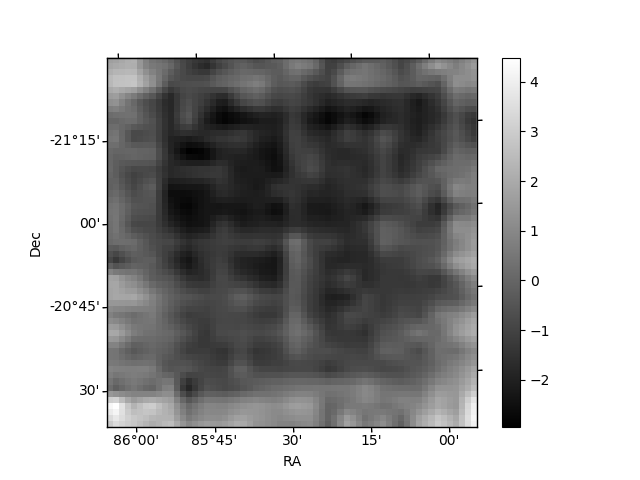
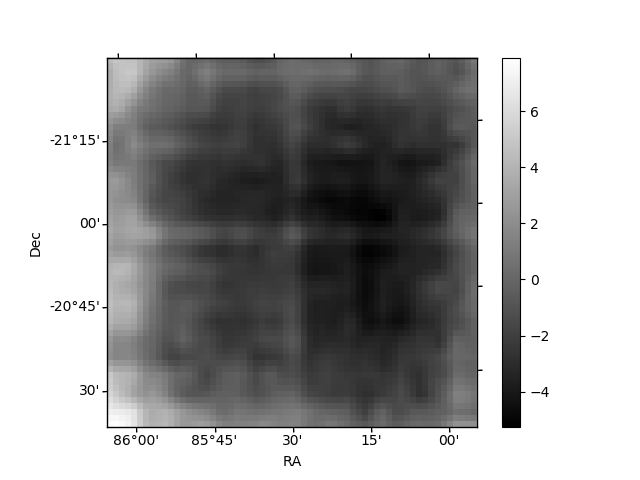
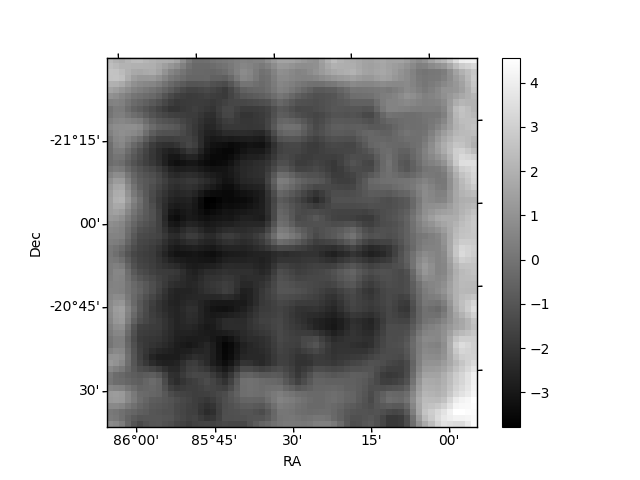
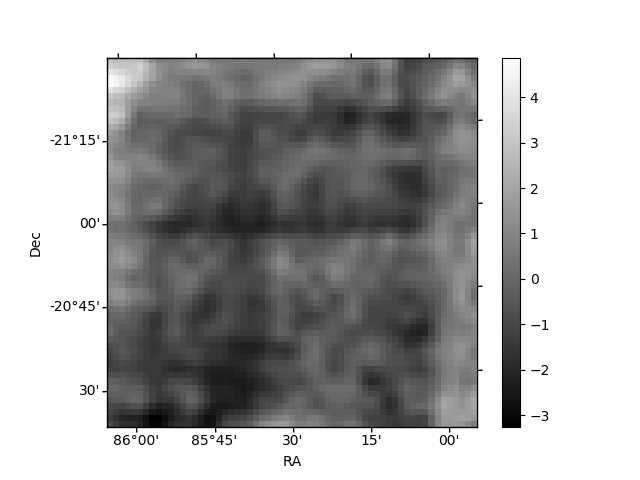
Histogram calculated using DETX and DETY for each event in the final _common_clean file
| Quadrant A | 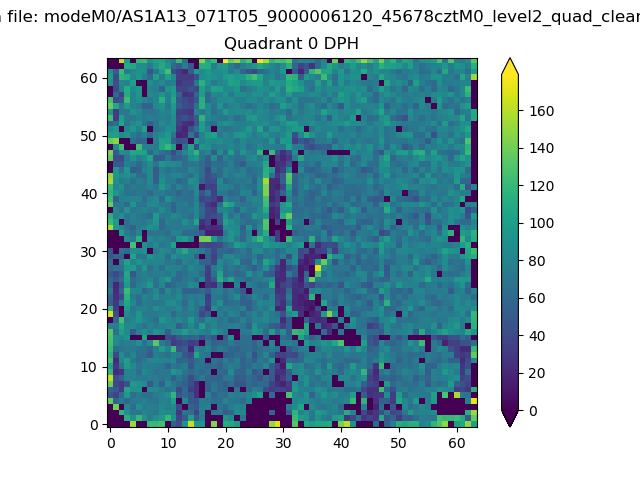 |
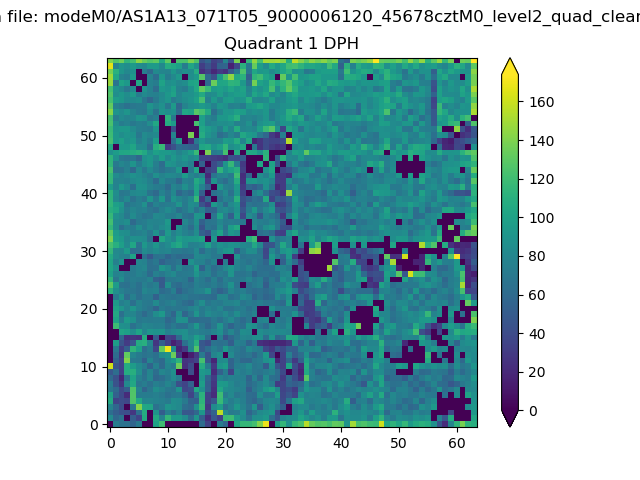 |
Quadrant B |
|---|---|---|---|
| Quadrant D | 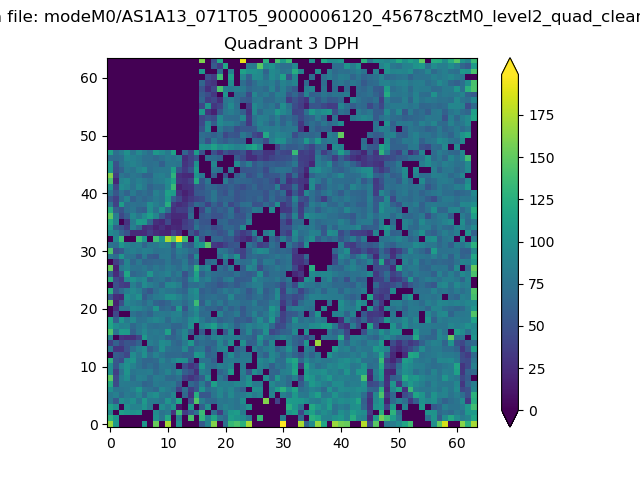 |
 |
Quadrant C |
| Plot type | Count rate plots | Images |
|---|---|---|
| Comparison with Poisson distribution Blue bars denote a histogram of data divided into 1 sec bins. Red curve is a Poisson curve with rate = median count rate of data. |
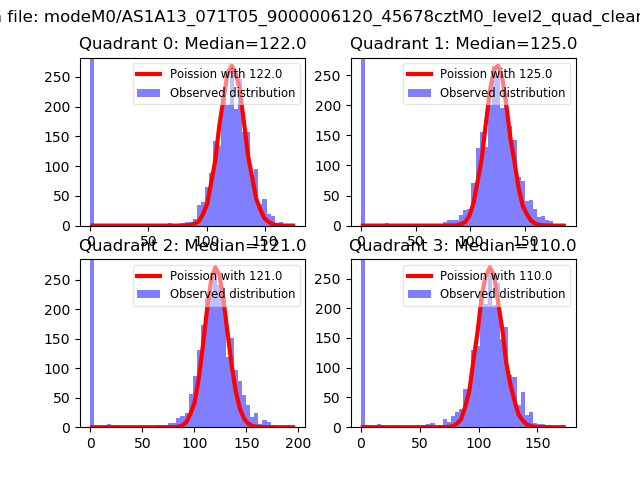 |
 |
| Quadrant-wise count rates Data is divided into 100 sec bins |
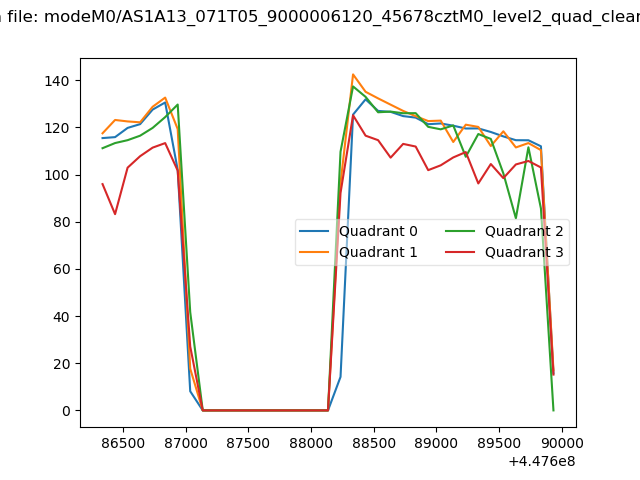 |
|
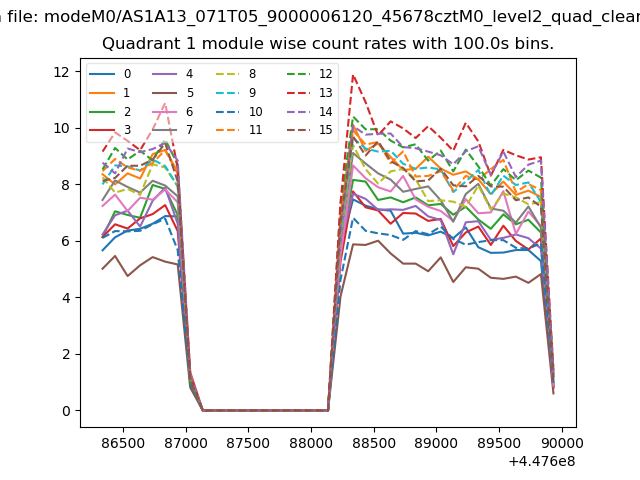
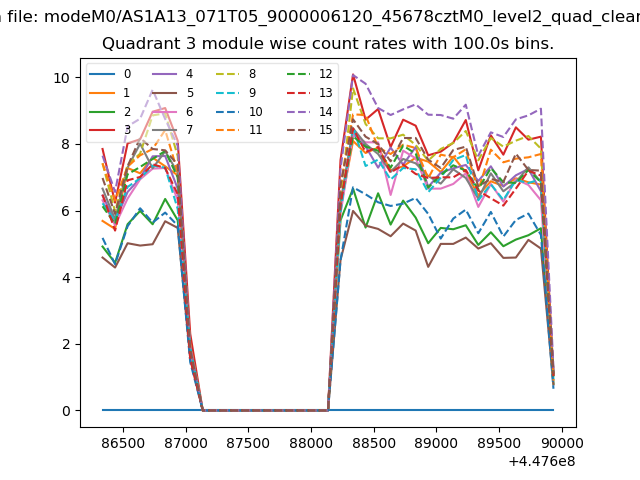
| Module-wise count rates for Quadrant A Data is divided into 100 sec bins |
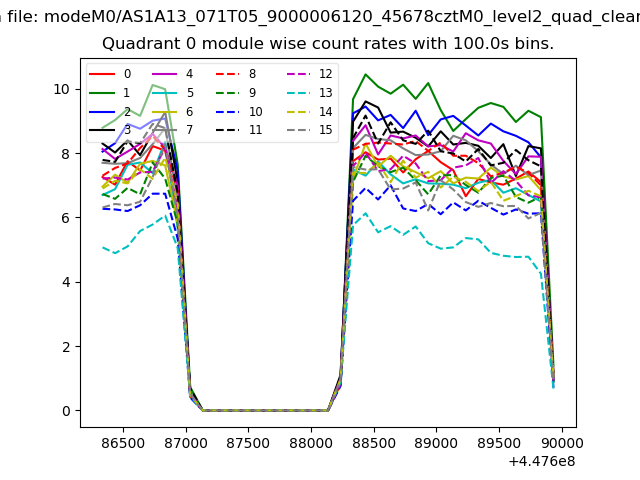 |
 |
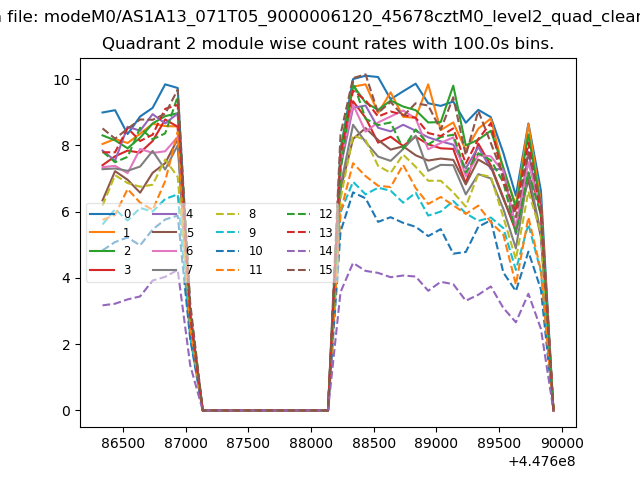
| Module-wise count rates for Quadrant B Data is divided into 100 sec bins |
 |
 |
| Module-wise count rates for Quadrant C Data is divided into 100 sec bins |
 |
 |
| Module-wise count rates for Quadrant D Data is divided into 100 sec bins |
 |
 |
| Parameter | Plot |
|---|---|
| CZT HV Monitor |  |
| D_VDD | 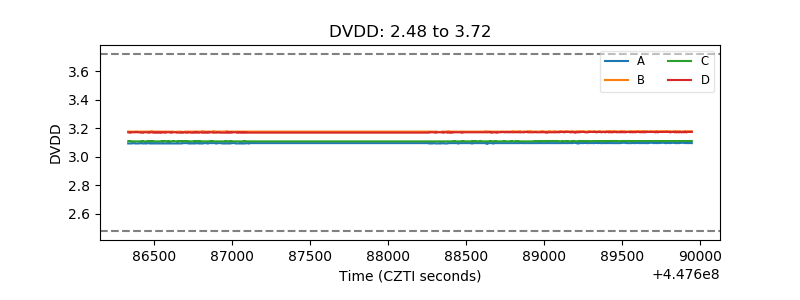 |
| Temperature 1 | 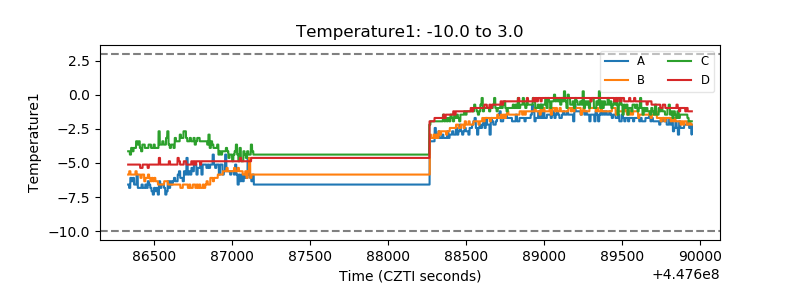 |
| Veto HV Monitor | 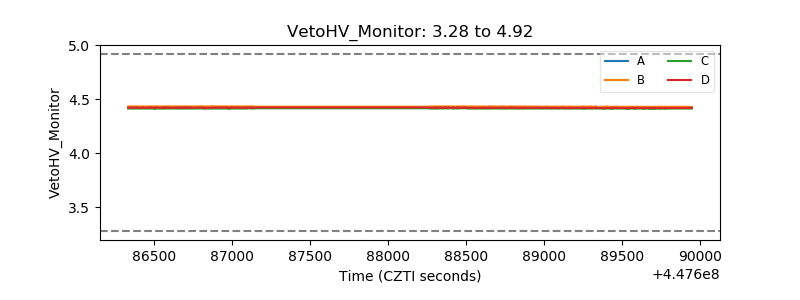 |
| Veto LLD | 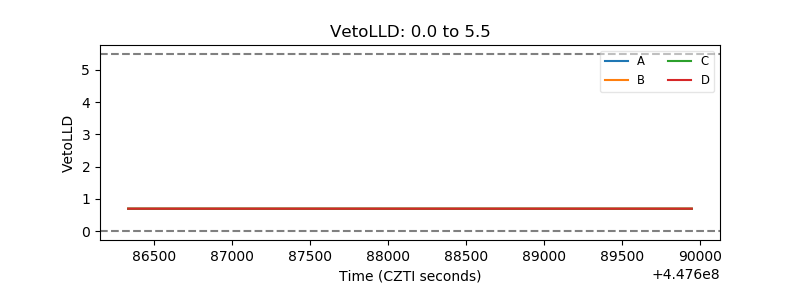 |
| Alpha Counter | 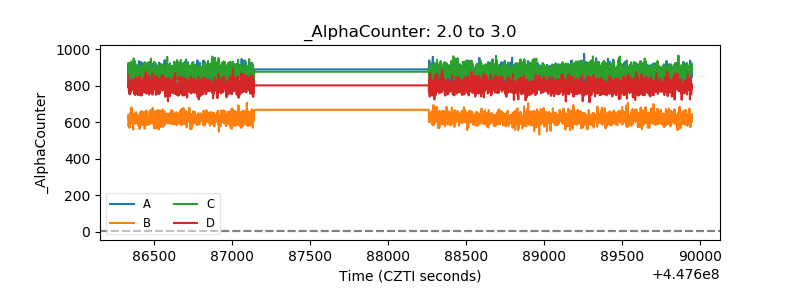 |
| _CPM_Rate | 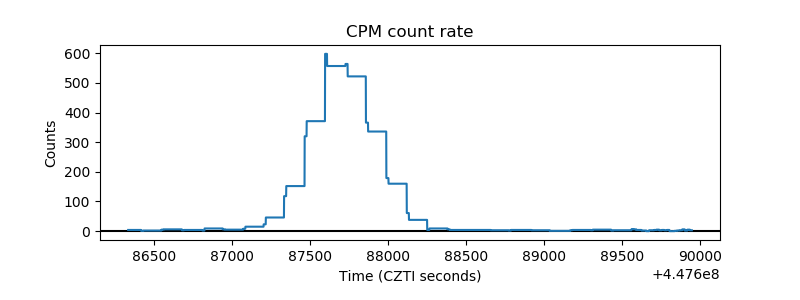 |
| CZT Counter | 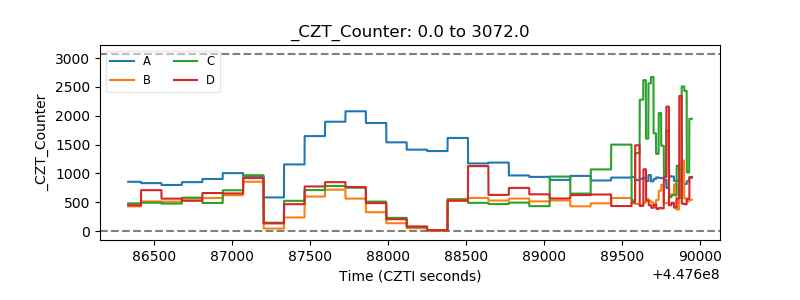 |
| +2.5 Volts monitor | 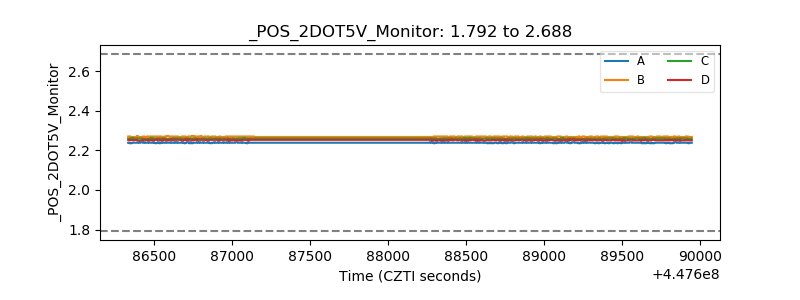 |
| +5 Volts monitor | 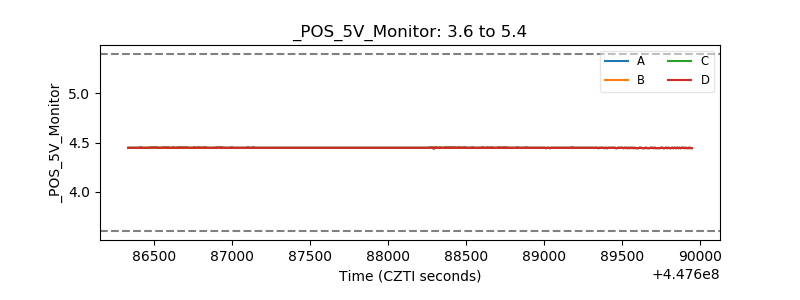 |
| _ROLL_ROT | 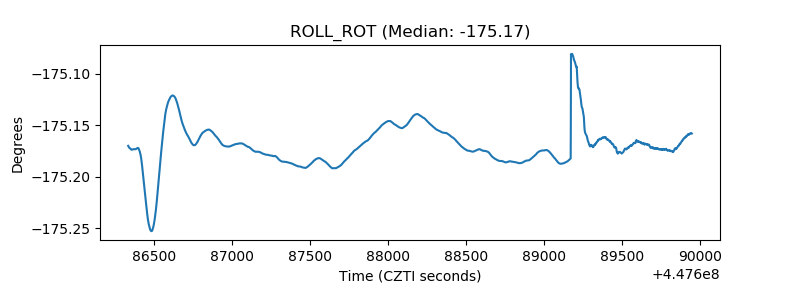 |
| _Roll_DEC | 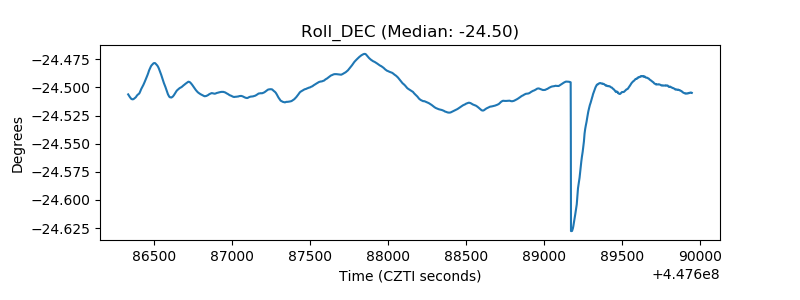 |
| _Roll_RA | 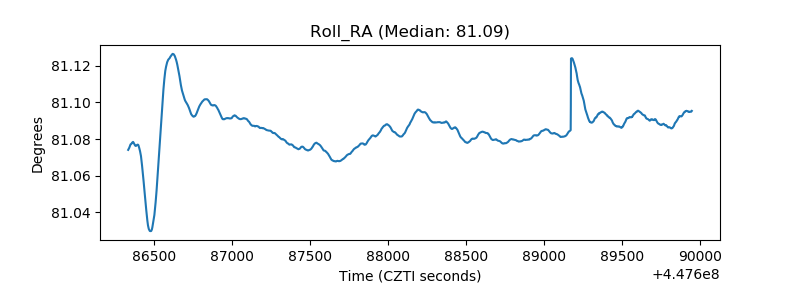 |
| Veto Counter | 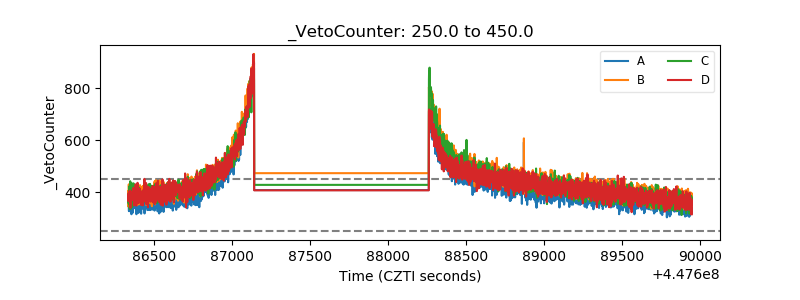 |