| Param | Original file | Final file |
|---|---|---|
| Filename | modeM0/AS1A13_071T05_9000006120_45679cztM0_level2.fits | modeM0/AS1A13_071T05_9000006120_45679cztM0_level2_quad_clean.evt |
| Size (bytes) | 560,589,120 | 96,091,200 |
| Size | 534.6 MB | 91.6 MB |
| Events in quadrant A | 5,403,274 | 662,057 |
| Events in quadrant B | 3,926,558 | 671,546 |
| Events in quadrant C | 5,992,958 | 592,865 |
| Events in quadrant D | 4,964,840 | 564,763 |
| Mode M0 | |||
|---|---|---|---|
| Quadrant | BADHDUFLAG | Total packets | Discarded packets |
| A | 0 | 19859 | 1 |
| B | 0 | 15632 | 1 |
| C | 0 | 21805 | 1 |
| D | 0 | 18919 | 1 |
| Mode M9 | |||
|---|---|---|---|
| Quadrant | BADHDUFLAG | Total packets | Discarded packets |
| A | 0 | 10 | 0 |
| B | 0 | 10 | 0 |
| C | 0 | 10 | 0 |
| D | 0 | 10 | 0 |
| Mode SS | |||
|---|---|---|---|
| Quadrant | BADHDUFLAG | Total packets | Discarded packets |
| A | 0 | 122 | 0 |
| B | 0 | 122 | 0 |
| C | 0 | 122 | 0 |
| D | 0 | 122 | 0 |
| Quadrant | Total seconds | Saturated seconds | Saturation percentage |
|---|---|---|---|
| A | 5985 | 213 | 3.558897% |
| B | 5986 | 299 | 4.994988% |
| C | 5986 | 827 | 13.815570% |
| D | 5986 | 662 | 11.059138% |
Noise dominated data is calculated using 1-second bins in cleaned event files. If a bin has >2000 counts, and if more than 50% of those come from <1% of pixels, then it is considered to be noise-dominated and hence unusable.
| Quadrant | # 1 sec bins | Bins with >0 counts | Bins with >2000 counts | High rate bins dominated by noise | Noise dominated (total time) | Noise dominated (detector-on time) | Marked lightcurve |
|---|---|---|---|---|---|---|---|
| A | 6975 | 5986 | 8 | 8 | 0.11% | 0.13% | 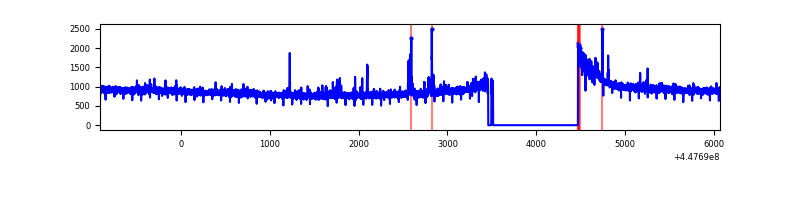 |
| B | 6976 | 5987 | 202 | 202 | 2.90% | 3.37% | 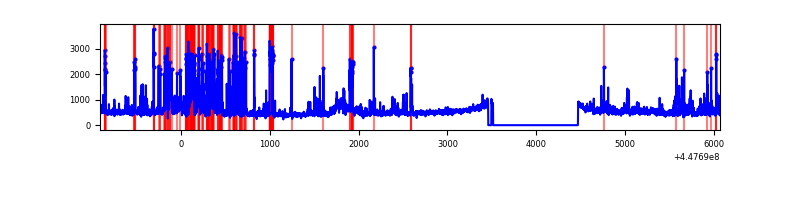 |
| C | 6976 | 5987 | 824 | 824 | 11.81% | 13.76% | 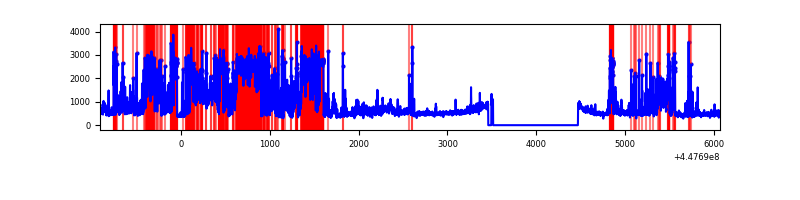 |
| D | 6976 | 5987 | 596 | 596 | 8.54% | 9.95% | 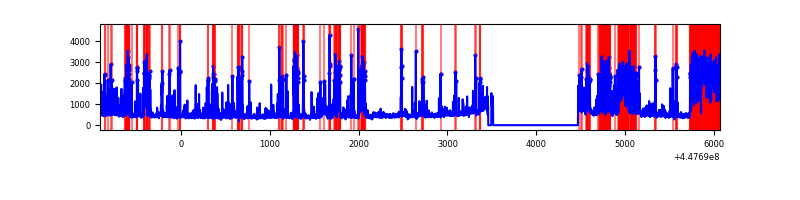 |
Top three noisy pixels from each quadrant. If the there are fewer than three noisy pixels in the level2.evt file, extra rows are filled as -1
| Pixel properties | Quadrant properties | ||||||
|---|---|---|---|---|---|---|---|
| Quadrant | DetID | PixID | Counts | Sigma | Mean | Median | Sigma |
| A | 10 | 83 | 2641720 | 18494.81 | 683 | 669 | 142.8 |
| A | 14 | 235 | 71544 | 496.32 | 683 | 669 | 142.8 |
| A | 0 | 243 | 18266 | 123.23 | 683 | 669 | 142.8 |
| B | 3 | 112 | 530173 | 3982.07 | 675 | 657 | 133.0 |
| B | 5 | 172 | 438448 | 3292.28 | 675 | 657 | 133.0 |
| B | 5 | 255 | 62203 | 462.84 | 675 | 657 | 133.0 |
| C | 9 | 54 | 3017987 | 19955.57 | 641 | 645 | 151.2 |
| C | 14 | 254 | 386265 | 2550.35 | 641 | 645 | 151.2 |
| C | 2 | 14 | 50756 | 331.42 | 641 | 645 | 151.2 |
| D | 1 | 52 | 1666611 | 9999.17 | 652 | 630 | 166.6 |
| D | 13 | 249 | 331637 | 1986.69 | 652 | 630 | 166.6 |
| D | 11 | 224 | 171148 | 1023.44 | 652 | 630 | 166.6 |
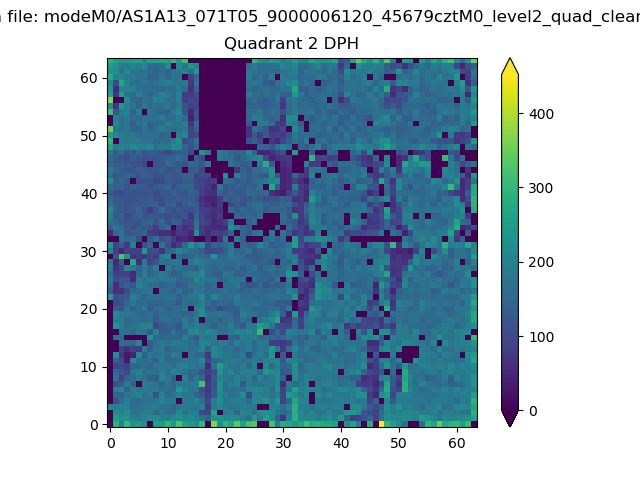
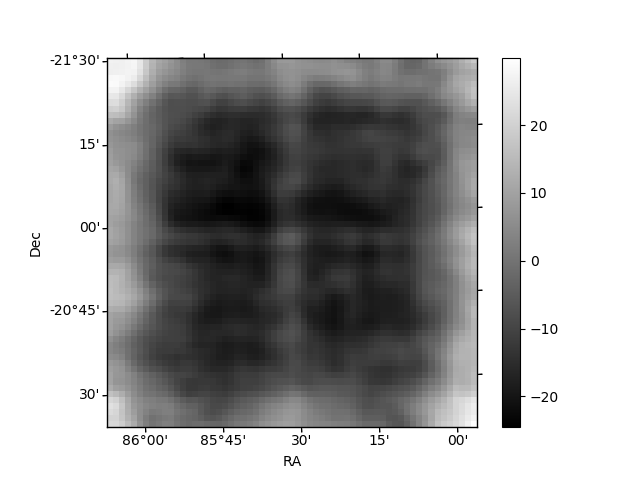
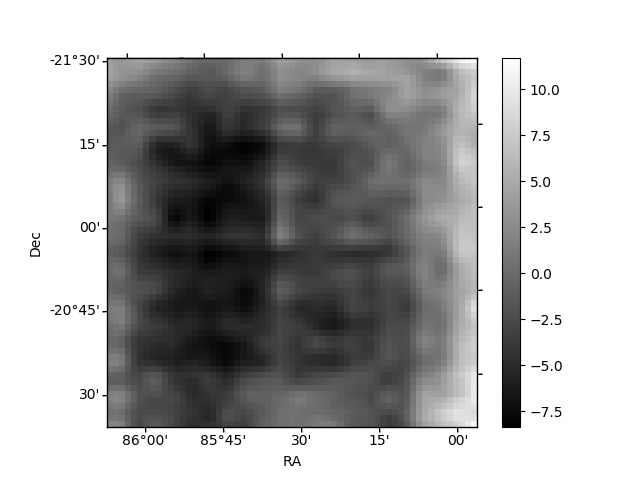
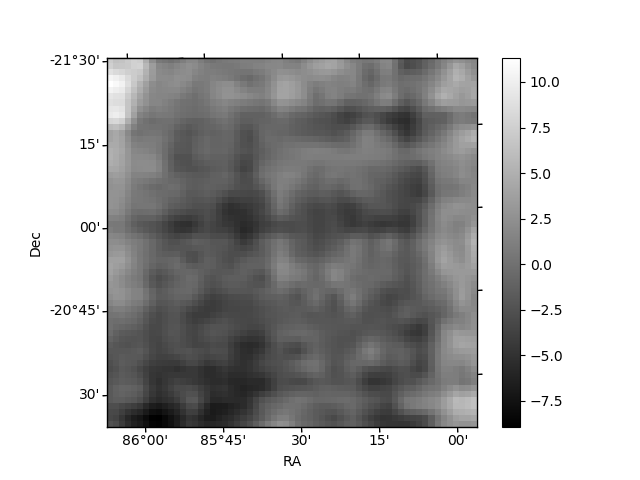
Histogram calculated using DETX and DETY for each event in the final _common_clean file
| Quadrant A | 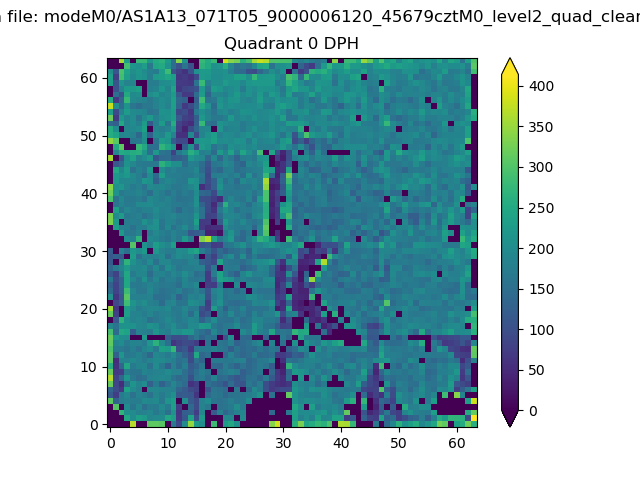 |
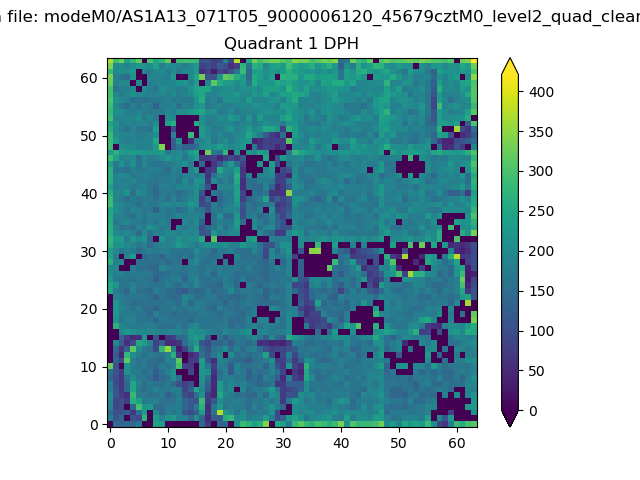 |
Quadrant B |
|---|---|---|---|
| Quadrant D | 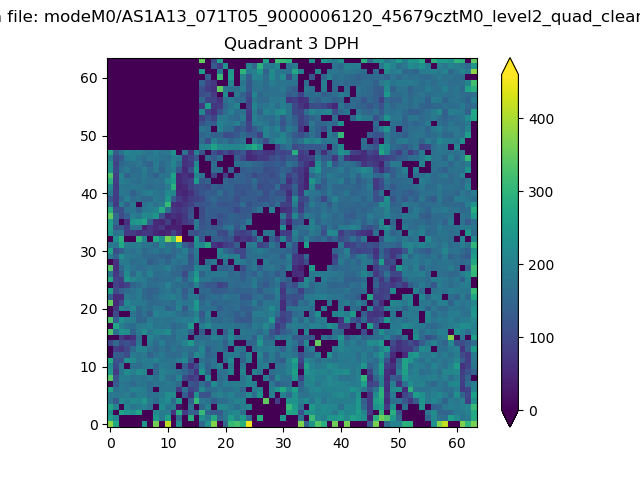 |
 |
Quadrant C |
| Plot type | Count rate plots | Images |
|---|---|---|
| Comparison with Poisson distribution Blue bars denote a histogram of data divided into 1 sec bins. Red curve is a Poisson curve with rate = median count rate of data. |
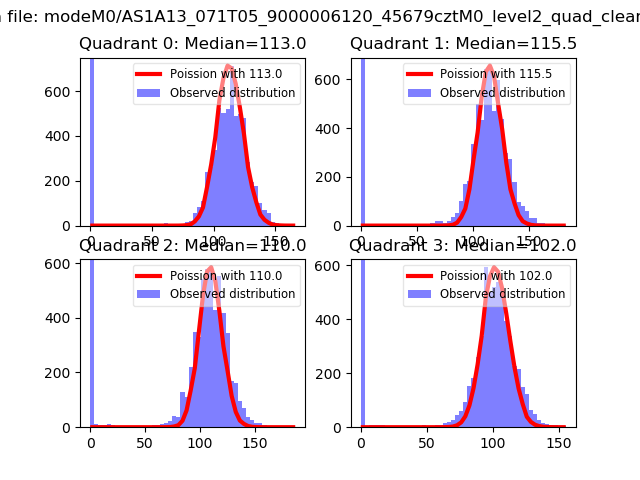 |
 |
| Quadrant-wise count rates Data is divided into 100 sec bins |
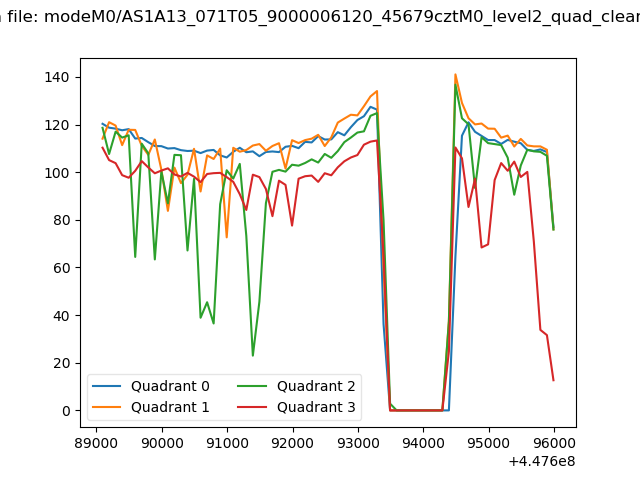 |
|
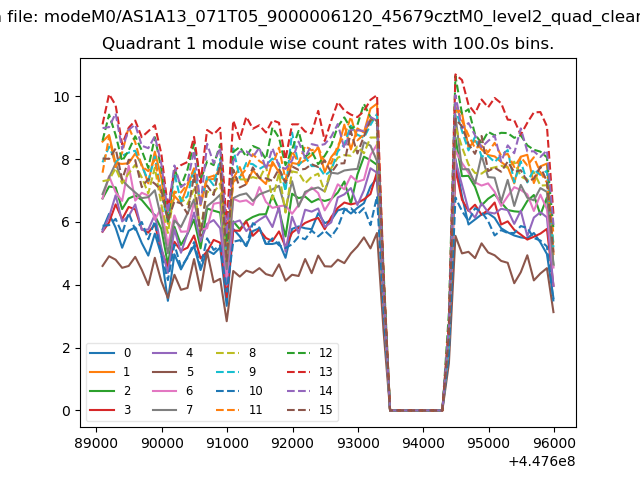
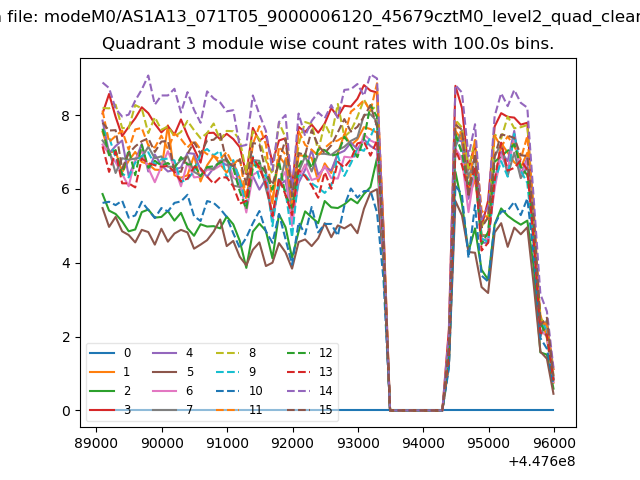
| Module-wise count rates for Quadrant A Data is divided into 100 sec bins |
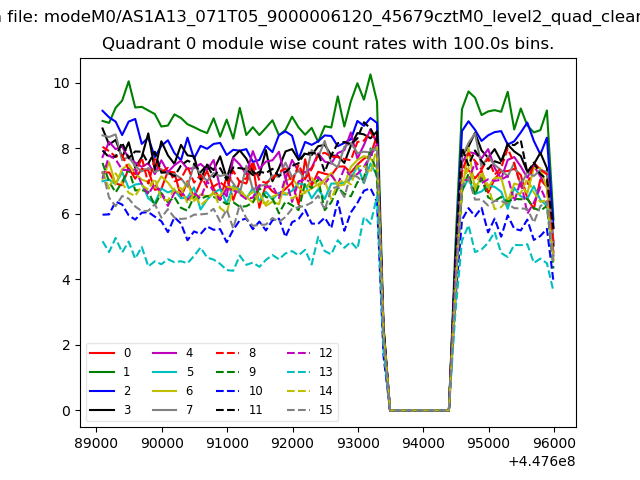 |
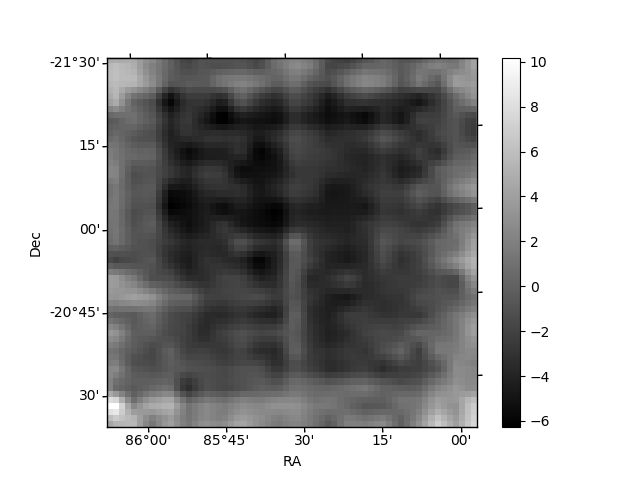 |
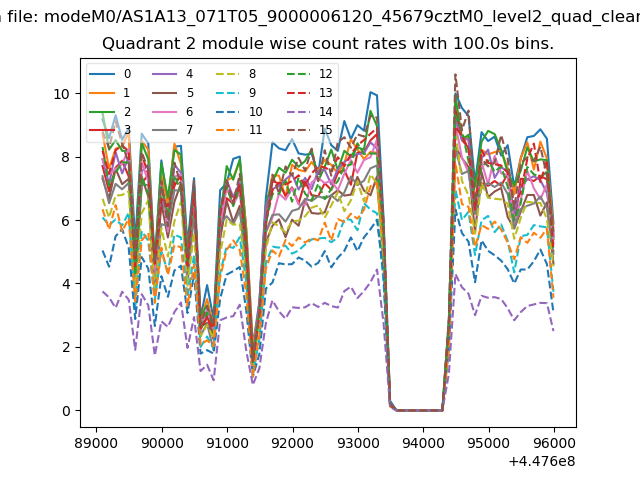
| Module-wise count rates for Quadrant B Data is divided into 100 sec bins |
 |
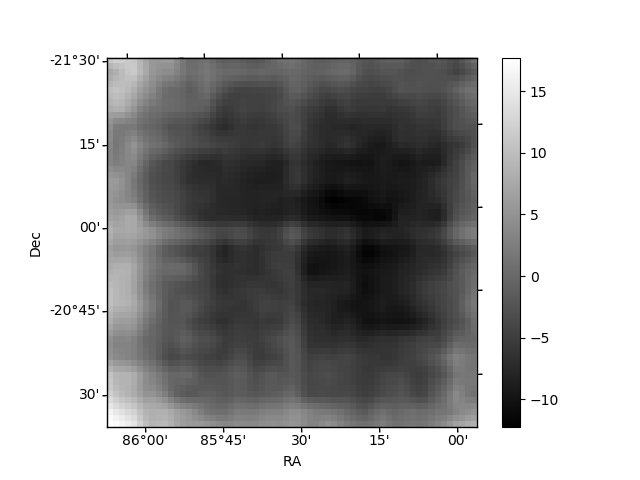 |
| Module-wise count rates for Quadrant C Data is divided into 100 sec bins |
 |
 |
| Module-wise count rates for Quadrant D Data is divided into 100 sec bins |
 |
 |
| Parameter | Plot |
|---|---|
| CZT HV Monitor | 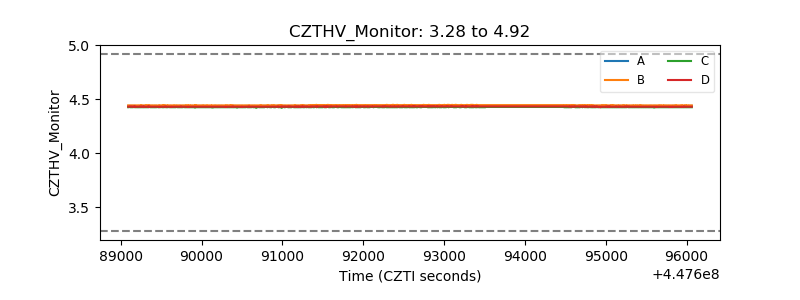 |
| D_VDD | 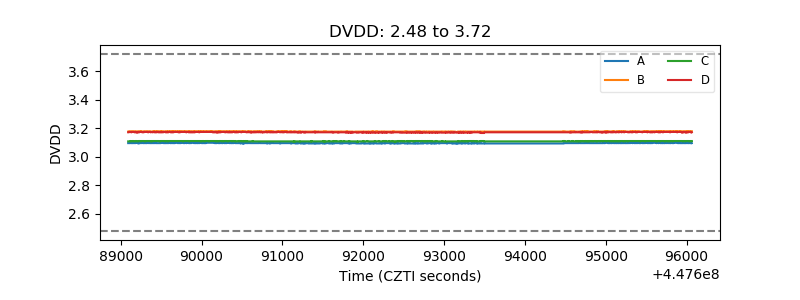 |
| Temperature 1 | 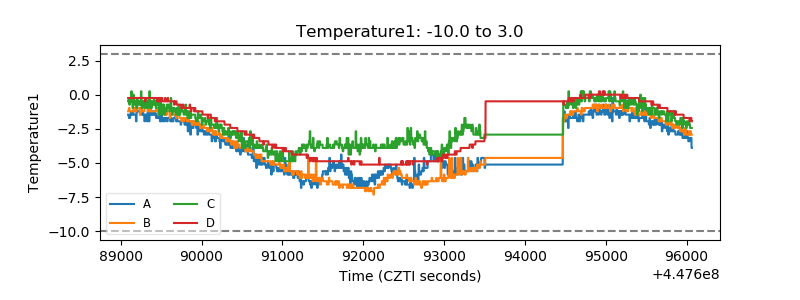 |
| Veto HV Monitor | 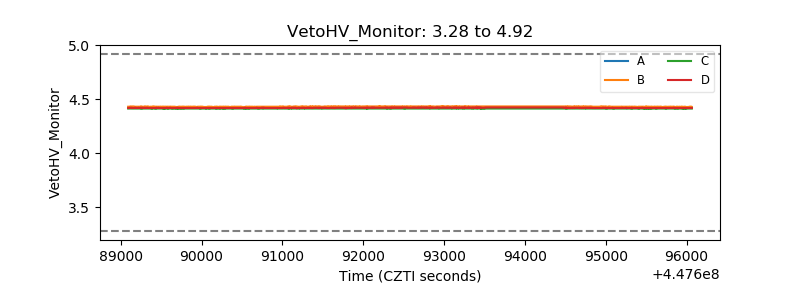 |
| Veto LLD | 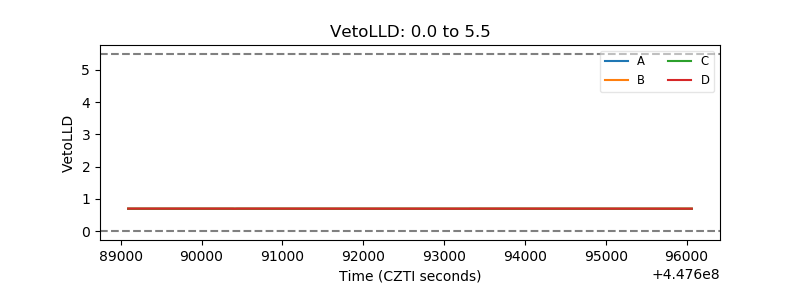 |
| Alpha Counter | 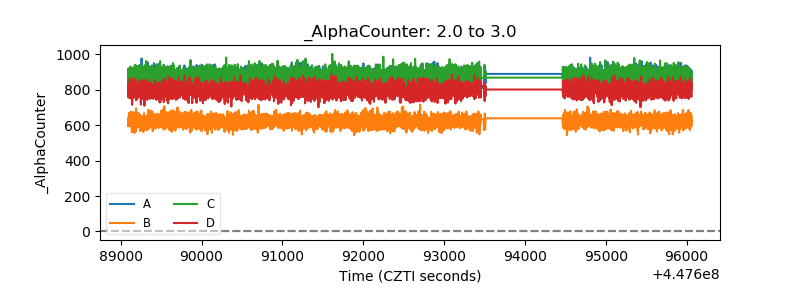 |
| _CPM_Rate | 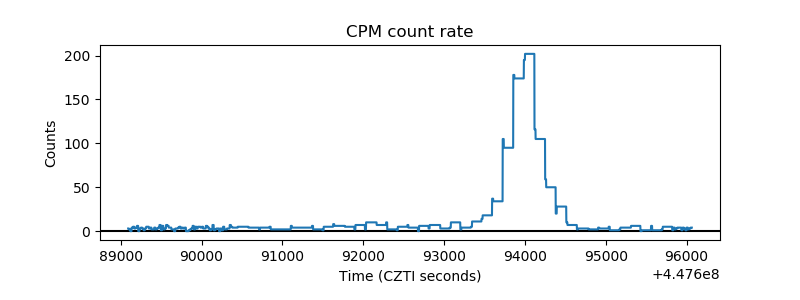 |
| CZT Counter | 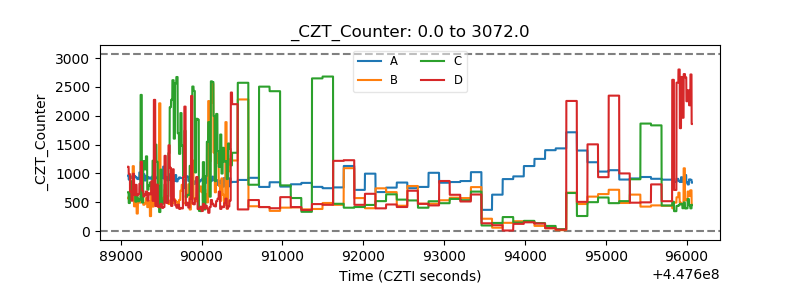 |
| +2.5 Volts monitor | 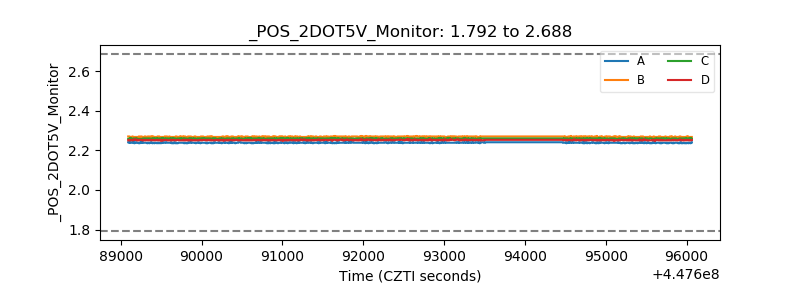 |
| +5 Volts monitor | 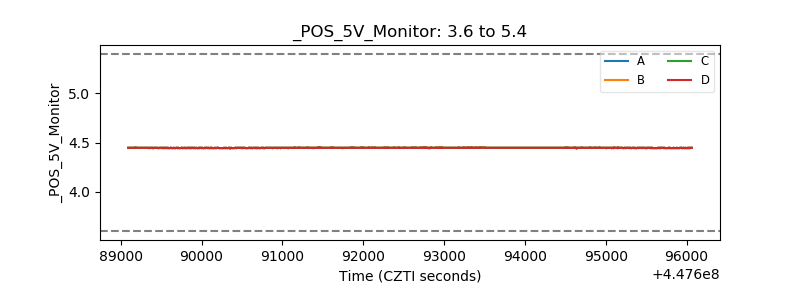 |
| _ROLL_ROT | 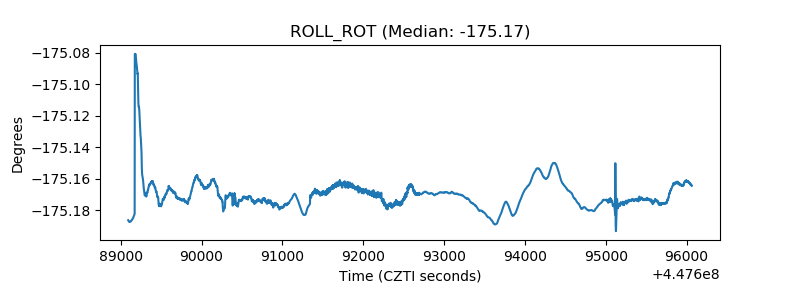 |
| _Roll_DEC | 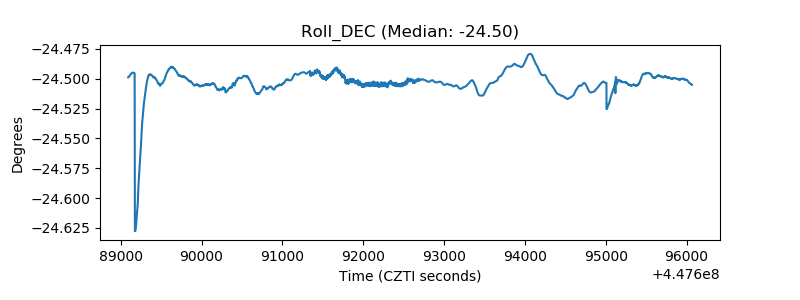 |
| _Roll_RA | 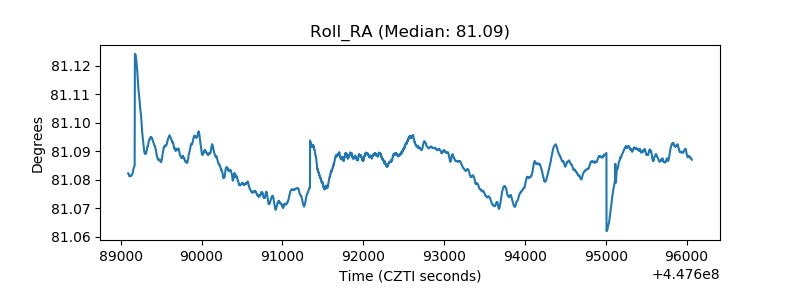 |
| Veto Counter | 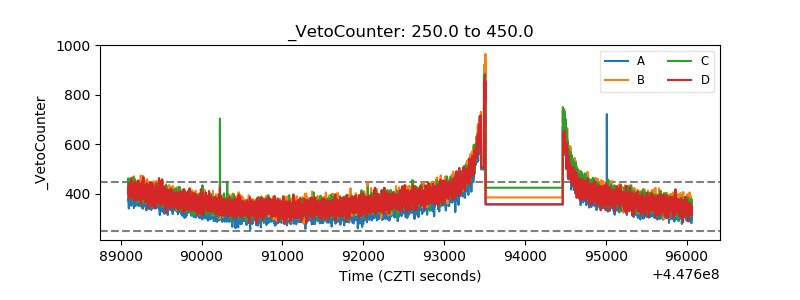 |