| Param | Original file | Final file |
|---|---|---|
| Filename | modeM0/AS1A13_071T05_9000006120_45680cztM0_level2.fits | modeM0/AS1A13_071T05_9000006120_45680cztM0_level2_quad_clean.evt |
| Size (bytes) | 697,752,000 | 106,113,600 |
| Size | 665.4 MB | 101.2 MB |
| Events in quadrant A | 6,151,692 | 743,498 |
| Events in quadrant B | 4,318,197 | 764,813 |
| Events in quadrant C | 6,186,094 | 699,564 |
| Events in quadrant D | 8,639,106 | 524,853 |
| Mode M0 | |||
|---|---|---|---|
| Quadrant | BADHDUFLAG | Total packets | Discarded packets |
| A | 0 | 22880 | 1 |
| B | 0 | 17300 | 1 |
| C | 0 | 23398 | 1 |
| D | 0 | 30421 | 1 |
| Mode M9 | |||
|---|---|---|---|
| Quadrant | BADHDUFLAG | Total packets | Discarded packets |
| A | 0 | 7 | 0 |
| B | 0 | 7 | 0 |
| C | 0 | 7 | 0 |
| D | 0 | 7 | 0 |
| Mode SS | |||
|---|---|---|---|
| Quadrant | BADHDUFLAG | Total packets | Discarded packets |
| A | 0 | 138 | 0 |
| B | 0 | 138 | 0 |
| C | 0 | 138 | 0 |
| D | 0 | 138 | 0 |
| Quadrant | Total seconds | Saturated seconds | Saturation percentage |
|---|---|---|---|
| A | 6895 | 191 | 2.770123% |
| B | 6895 | 244 | 3.538796% |
| C | 6896 | 622 | 9.019722% |
| D | 6896 | 1825 | 26.464617% |
Noise dominated data is calculated using 1-second bins in cleaned event files. If a bin has >2000 counts, and if more than 50% of those come from <1% of pixels, then it is considered to be noise-dominated and hence unusable.
| Quadrant | # 1 sec bins | Bins with >0 counts | Bins with >2000 counts | High rate bins dominated by noise | Noise dominated (total time) | Noise dominated (detector-on time) | Marked lightcurve |
|---|---|---|---|---|---|---|---|
| A | 7520 | 6896 | 7 | 7 | 0.09% | 0.10% | 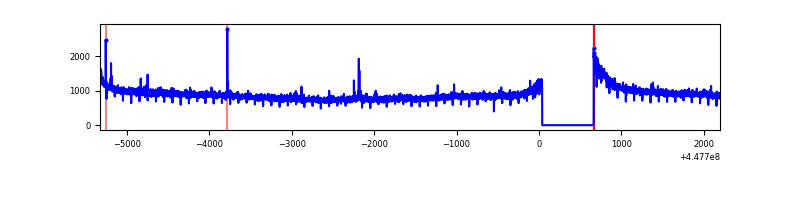 |
| B | 7520 | 6896 | 181 | 181 | 2.41% | 2.62% | 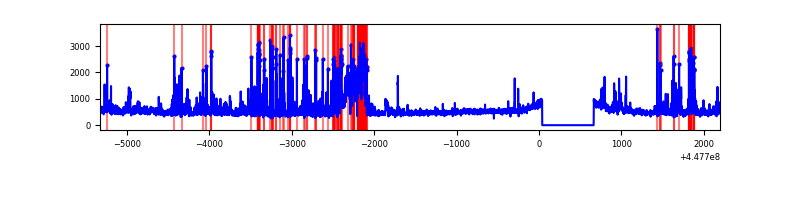 |
| C | 7521 | 6897 | 626 | 626 | 8.32% | 9.08% | 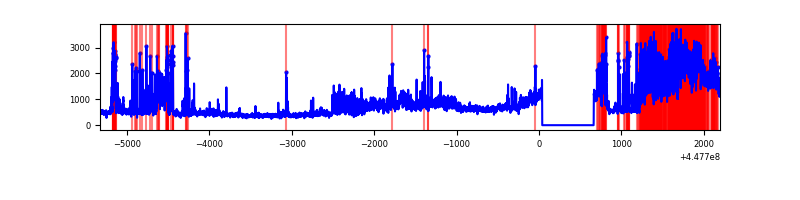 |
| D | 7521 | 6897 | 1714 | 1714 | 22.79% | 24.85% | 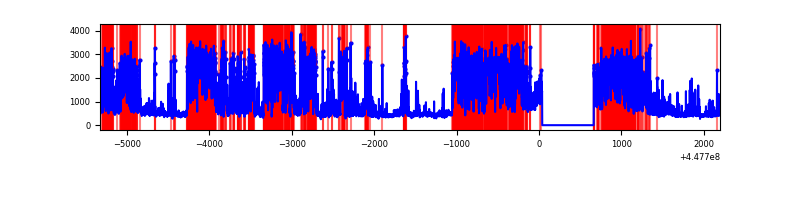 |
Top three noisy pixels from each quadrant. If the there are fewer than three noisy pixels in the level2.evt file, extra rows are filled as -1
| Pixel properties | Quadrant properties | ||||||
|---|---|---|---|---|---|---|---|
| Quadrant | DetID | PixID | Counts | Sigma | Mean | Median | Sigma |
| A | 10 | 83 | 3068997 | 18667.11 | 782 | 764 | 164.4 |
| A | 0 | 243 | 19356 | 113.11 | 782 | 764 | 164.4 |
| A | 14 | 235 | 18100 | 105.47 | 782 | 764 | 164.4 |
| B | 3 | 112 | 716965 | 4662.65 | 776 | 753 | 153.6 |
| B | 5 | 172 | 183923 | 1192.46 | 776 | 753 | 153.6 |
| B | 0 | 189 | 111604 | 721.66 | 776 | 753 | 153.6 |
| C | 9 | 54 | 2786094 | 15839.21 | 746 | 749 | 175.9 |
| C | 14 | 254 | 446265 | 2533.48 | 746 | 749 | 175.9 |
| C | 12 | 2 | 26871 | 148.55 | 746 | 749 | 175.9 |
| D | 1 | 52 | 5213018 | 29854.36 | 684 | 662 | 174.6 |
| D | 11 | 224 | 281453 | 1608.26 | 684 | 662 | 174.6 |
| D | 13 | 249 | 238805 | 1363.99 | 684 | 662 | 174.6 |
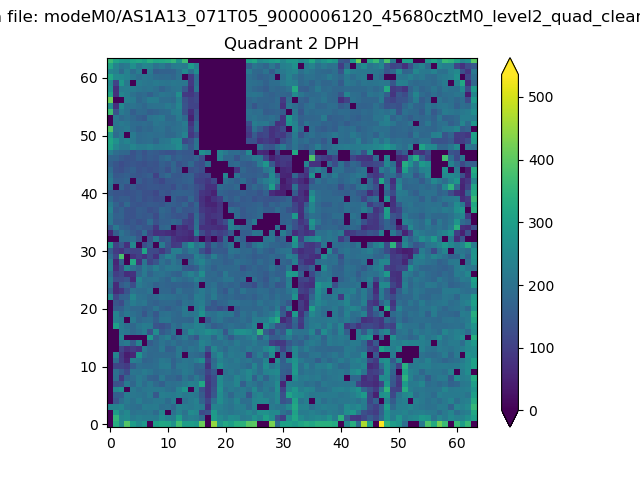
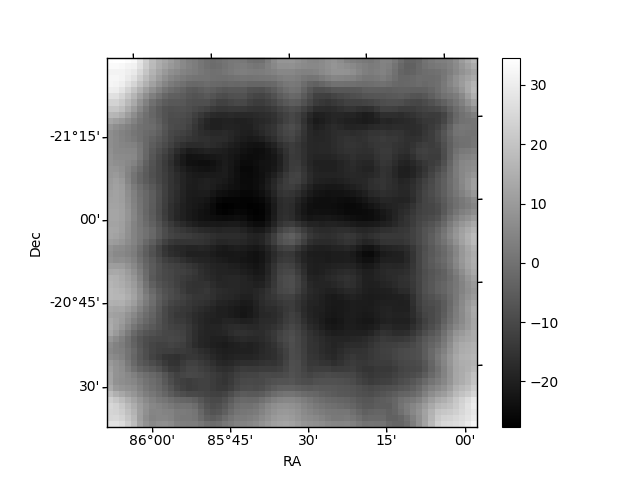
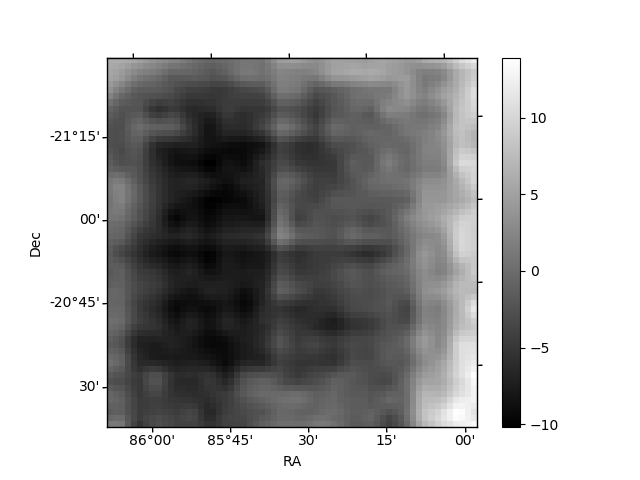
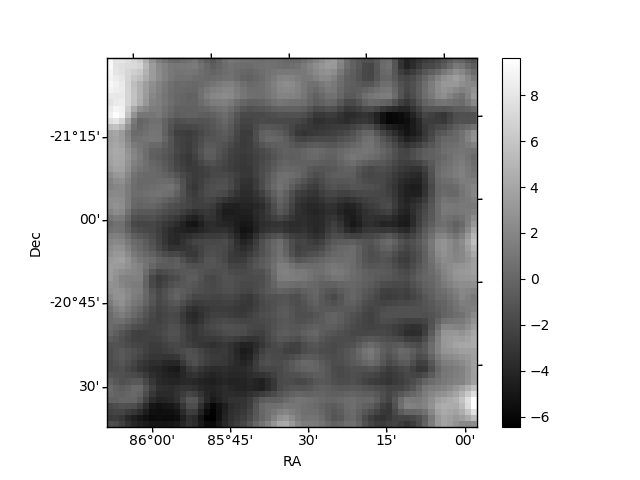
Histogram calculated using DETX and DETY for each event in the final _common_clean file
| Quadrant A | 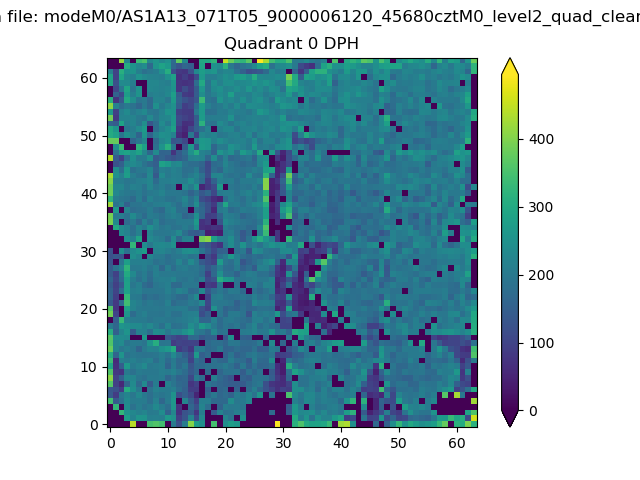 |
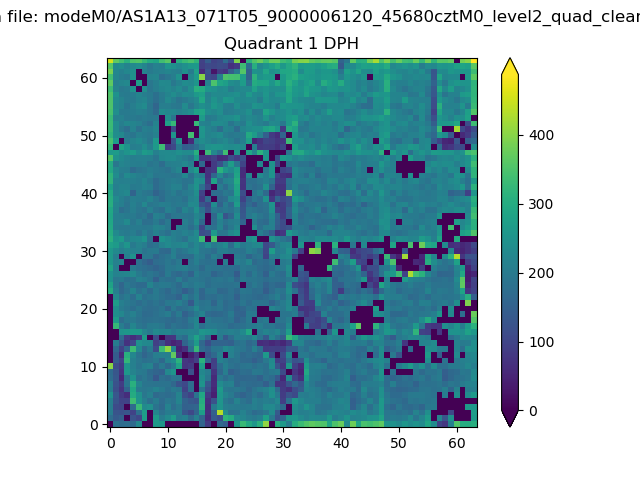 |
Quadrant B |
|---|---|---|---|
| Quadrant D | 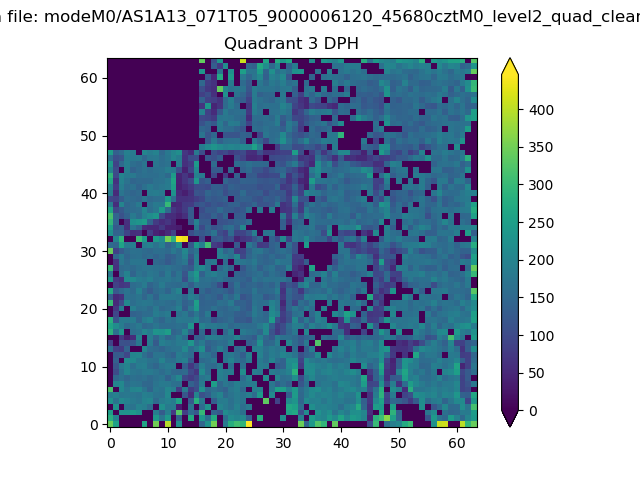 |
 |
Quadrant C |
| Plot type | Count rate plots | Images |
|---|---|---|
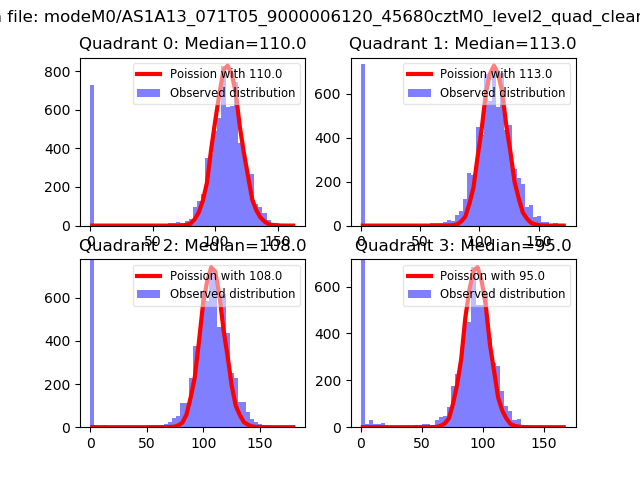
| Comparison with Poisson distribution Blue bars denote a histogram of data divided into 1 sec bins. Red curve is a Poisson curve with rate = median count rate of data. |
 |
 |
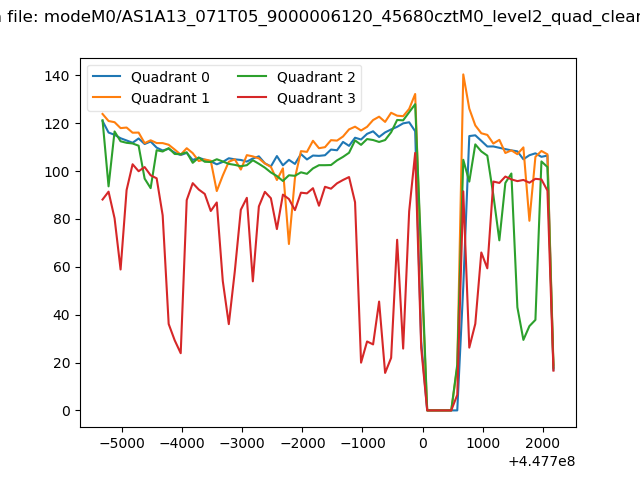
| Quadrant-wise count rates Data is divided into 100 sec bins |
 |
|
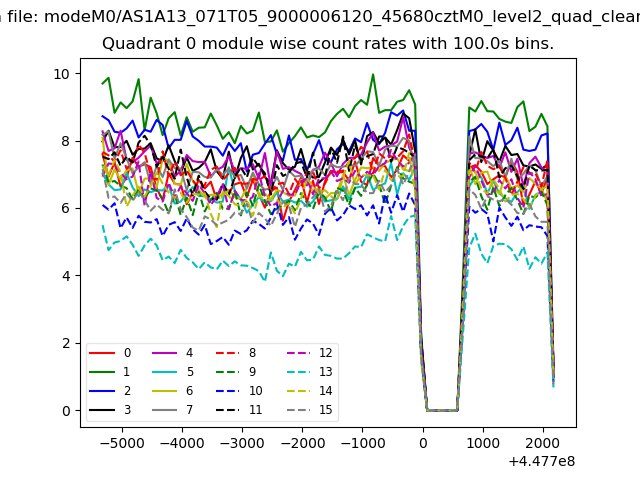
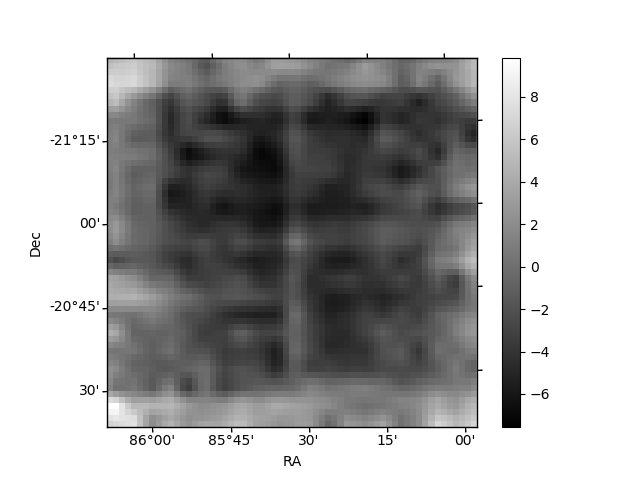
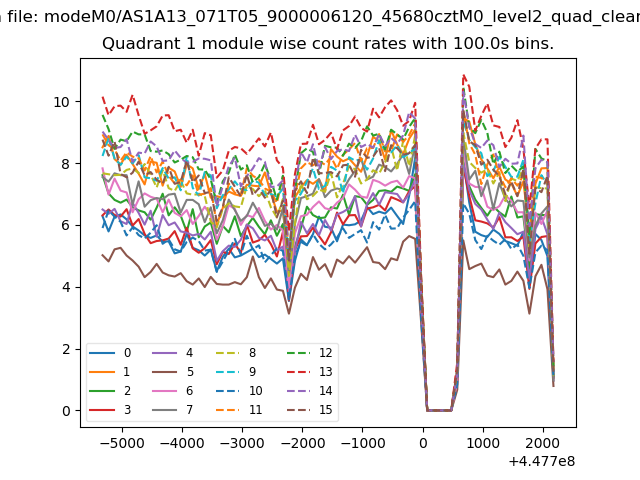
| Module-wise count rates for Quadrant A Data is divided into 100 sec bins |
 |
 |
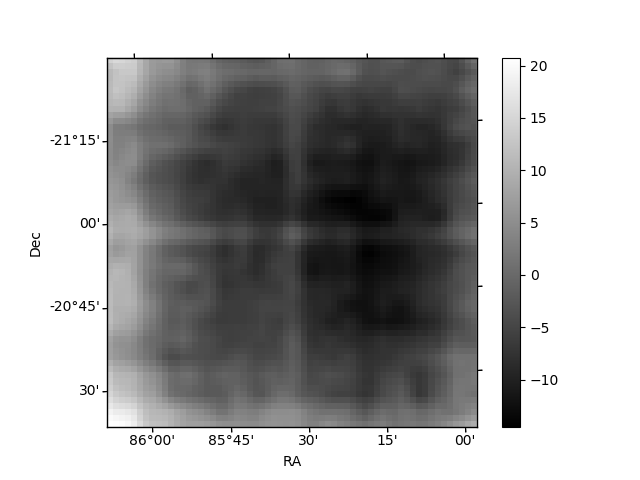
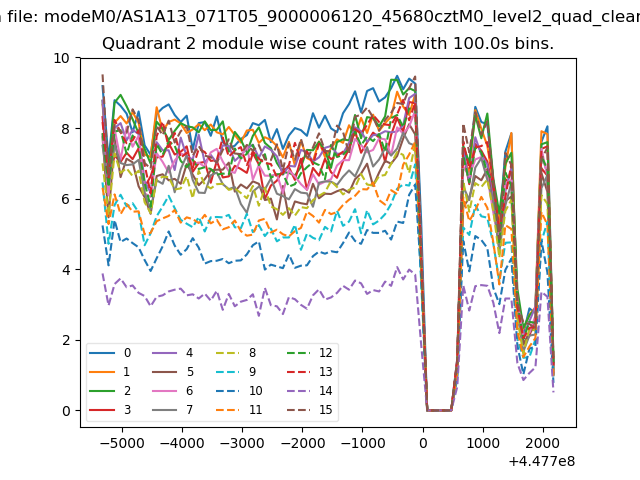
| Module-wise count rates for Quadrant B Data is divided into 100 sec bins |
 |
 |
| Module-wise count rates for Quadrant C Data is divided into 100 sec bins |
 |
 |
| Module-wise count rates for Quadrant D Data is divided into 100 sec bins |
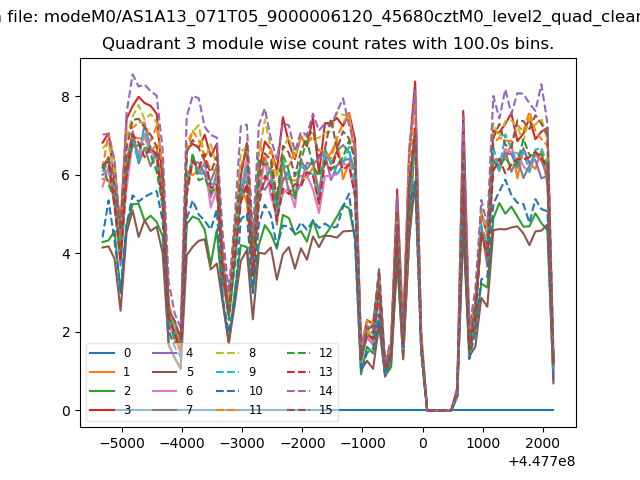 |
 |
| Parameter | Plot |
|---|---|
| CZT HV Monitor | 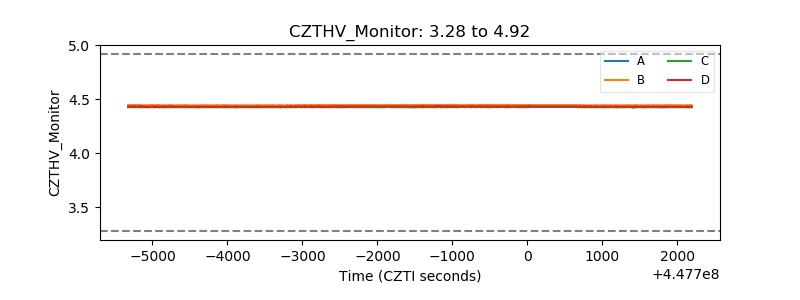 |
| D_VDD | 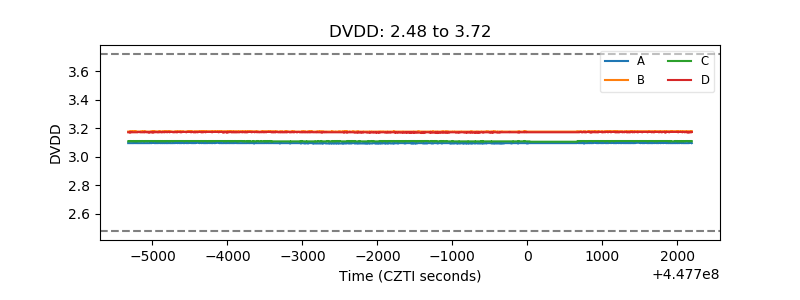 |
| Temperature 1 | 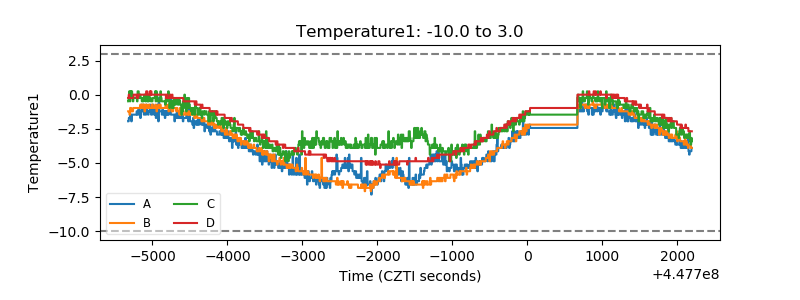 |
| Veto HV Monitor |  |
| Veto LLD | 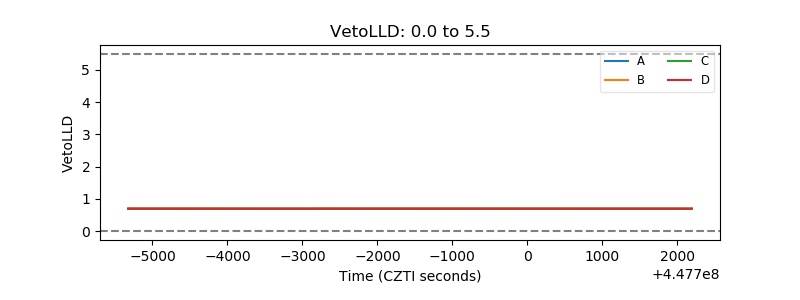 |
| Alpha Counter | 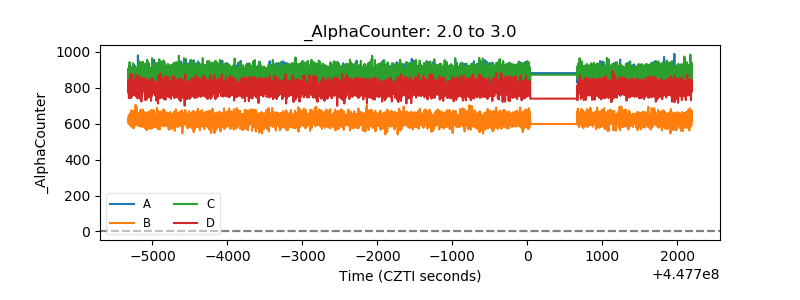 |
| _CPM_Rate | 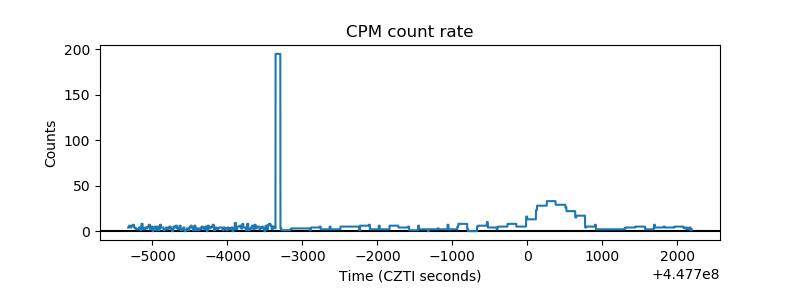 |
| CZT Counter | 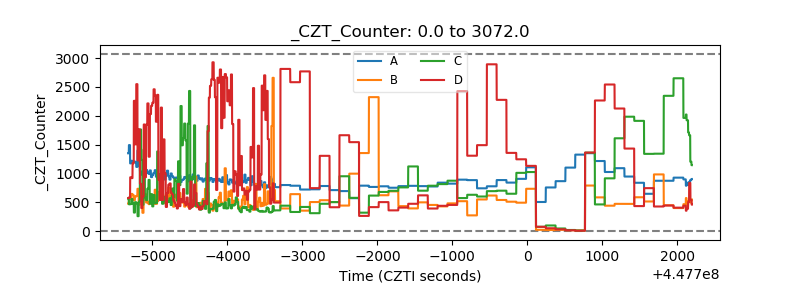 |
| +2.5 Volts monitor | 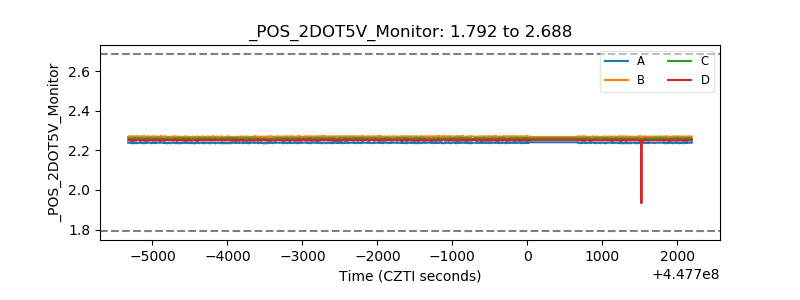 |
| +5 Volts monitor | 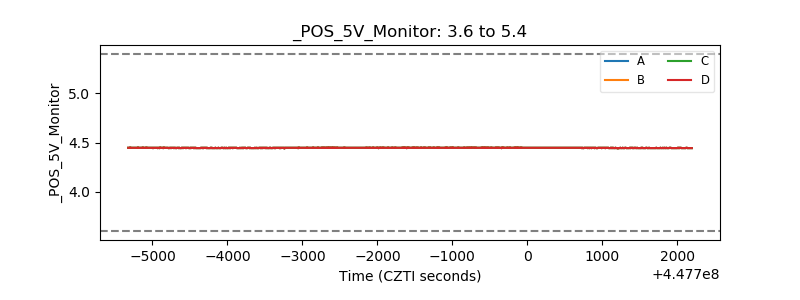 |
| _ROLL_ROT | 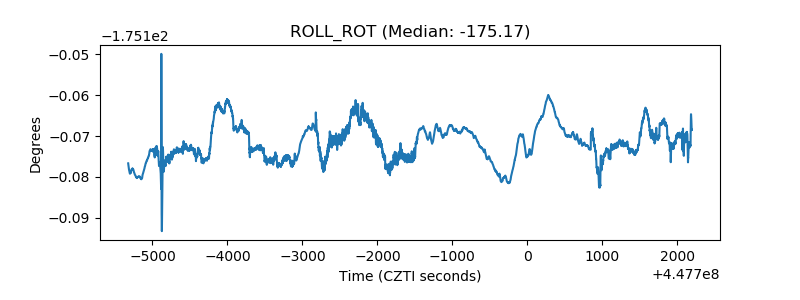 |
| _Roll_DEC | 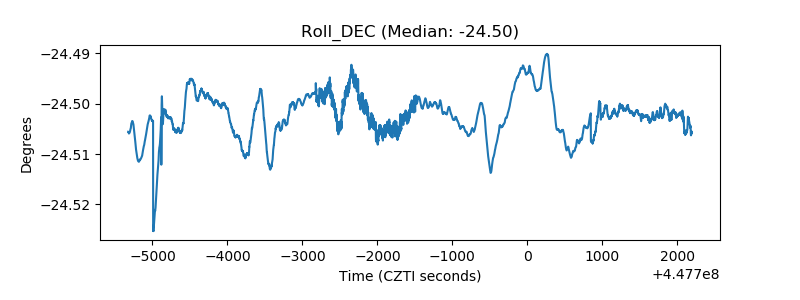 |
| _Roll_RA | 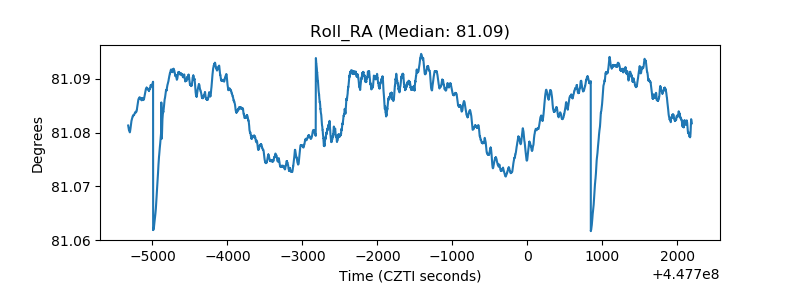 |
| Veto Counter | 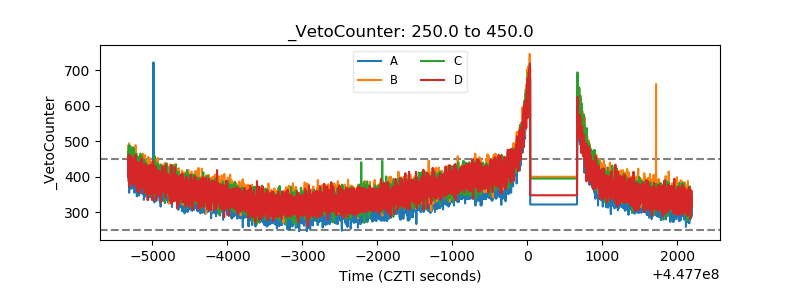 |