| Param | Original file | Final file |
|---|---|---|
| Filename | modeM0/AS1A13_071T05_9000006120_45681cztM0_level2.fits | modeM0/AS1A13_071T05_9000006120_45681cztM0_level2_quad_clean.evt |
| Size (bytes) | 953,210,880 | 111,072,960 |
| Size | 909.1 MB | 105.9 MB |
| Events in quadrant A | 6,779,349 | 832,143 |
| Events in quadrant B | 4,321,238 | 843,937 |
| Events in quadrant C | 14,484,352 | 547,775 |
| Events in quadrant D | 9,109,580 | 605,940 |
| Mode M0 | |||
|---|---|---|---|
| Quadrant | BADHDUFLAG | Total packets | Discarded packets |
| A | 0 | 25302 | 0 |
| B | 0 | 17995 | 1 |
| C | 0 | 48273 | 0 |
| D | 0 | 32452 | 0 |
| Mode SS | |||
|---|---|---|---|
| Quadrant | BADHDUFLAG | Total packets | Discarded packets |
| A | 0 | 154 | 0 |
| B | 0 | 154 | 0 |
| C | 0 | 154 | 0 |
| D | 0 | 154 | 0 |
| Quadrant | Total seconds | Saturated seconds | Saturation percentage |
|---|---|---|---|
| A | 7653 | 115 | 1.502679% |
| B | 7652 | 170 | 2.221641% |
| C | 7653 | 3282 | 42.885143% |
| D | 7653 | 1798 | 23.494055% |
Noise dominated data is calculated using 1-second bins in cleaned event files. If a bin has >2000 counts, and if more than 50% of those come from <1% of pixels, then it is considered to be noise-dominated and hence unusable.
| Quadrant | # 1 sec bins | Bins with >0 counts | Bins with >2000 counts | High rate bins dominated by noise | Noise dominated (total time) | Noise dominated (detector-on time) | Marked lightcurve |
|---|---|---|---|---|---|---|---|
| A | 7653 | 7653 | 5 | 5 | 0.07% | 0.07% |  |
| B | 7652 | 7652 | 104 | 104 | 1.36% | 1.36% |  |
| C | 7653 | 7653 | 3317 | 3317 | 43.34% | 43.34% | 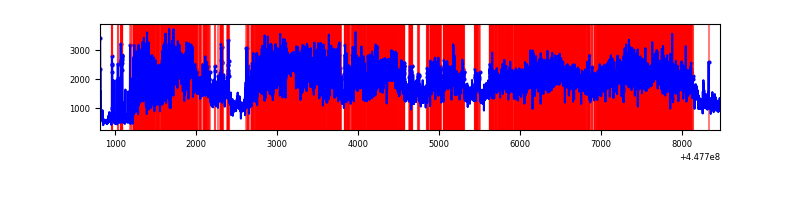 |
| D | 7653 | 7653 | 1645 | 1645 | 21.49% | 21.49% |  |
Top three noisy pixels from each quadrant. If the there are fewer than three noisy pixels in the level2.evt file, extra rows are filled as -1
| Pixel properties | Quadrant properties | ||||||
|---|---|---|---|---|---|---|---|
| Quadrant | DetID | PixID | Counts | Sigma | Mean | Median | Sigma |
| A | 10 | 83 | 3293978 | 18056.44 | 869 | 849 | 182.4 |
| A | 14 | 235 | 53468 | 288.51 | 869 | 849 | 182.4 |
| A | 0 | 243 | 23445 | 123.89 | 869 | 849 | 182.4 |
| B | 5 | 172 | 224349 | 1319.92 | 863 | 836 | 169.3 |
| B | 3 | 112 | 185766 | 1092.08 | 863 | 836 | 169.3 |
| B | 0 | 189 | 129959 | 762.52 | 863 | 836 | 169.3 |
| C | 9 | 54 | 11074326 | 61880.78 | 764 | 768 | 178.9 |
| C | 14 | 254 | 318169 | 1773.69 | 764 | 768 | 178.9 |
| C | 15 | 208 | 47940 | 263.6 | 764 | 768 | 178.9 |
| D | 1 | 52 | 5189843 | 26937.42 | 768 | 744 | 192.6 |
| D | 13 | 249 | 510387 | 2645.64 | 768 | 744 | 192.6 |
| D | 2 | 249 | 128961 | 665.59 | 768 | 744 | 192.6 |
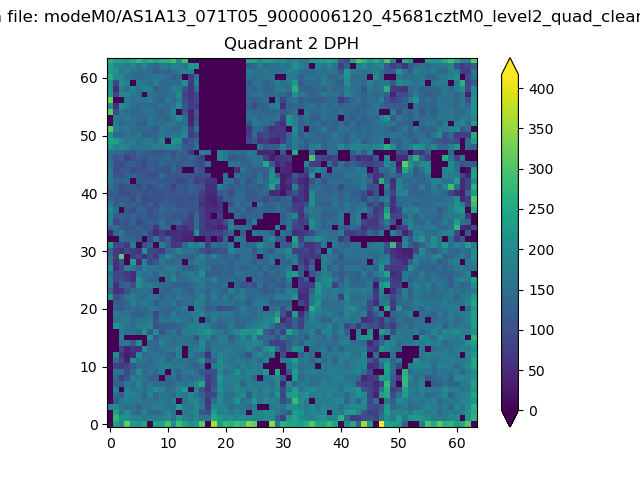
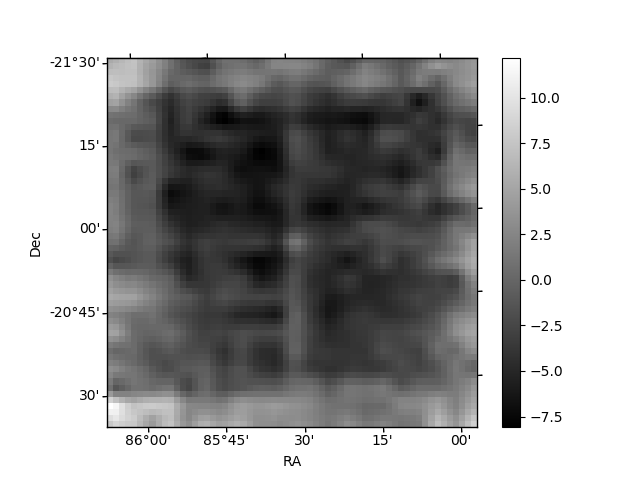
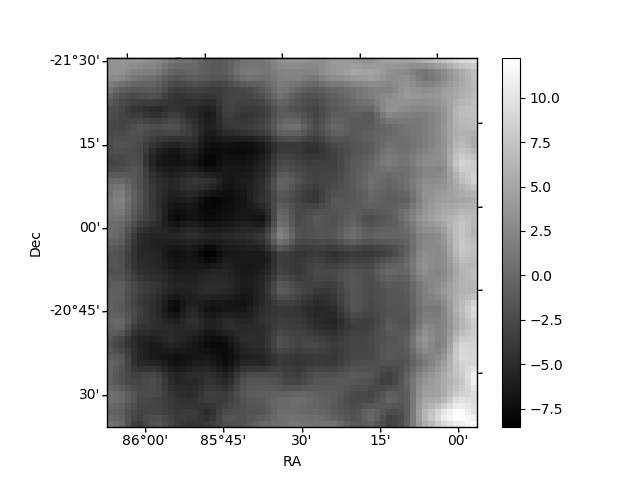
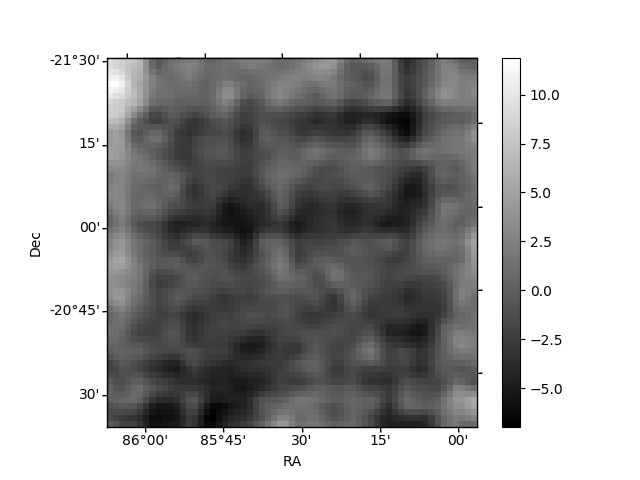
Histogram calculated using DETX and DETY for each event in the final _common_clean file
| Quadrant A | 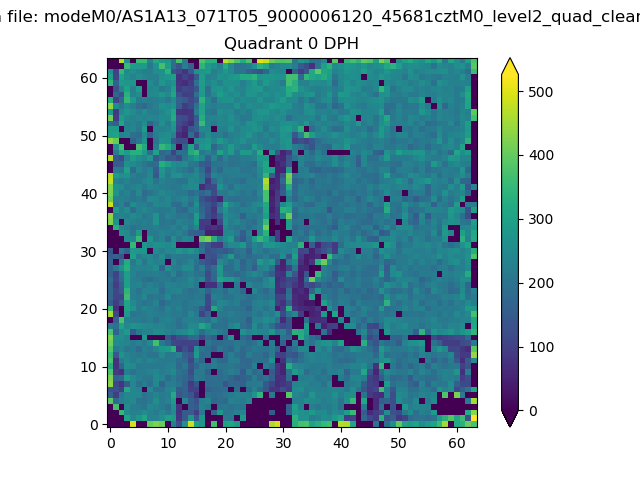 |
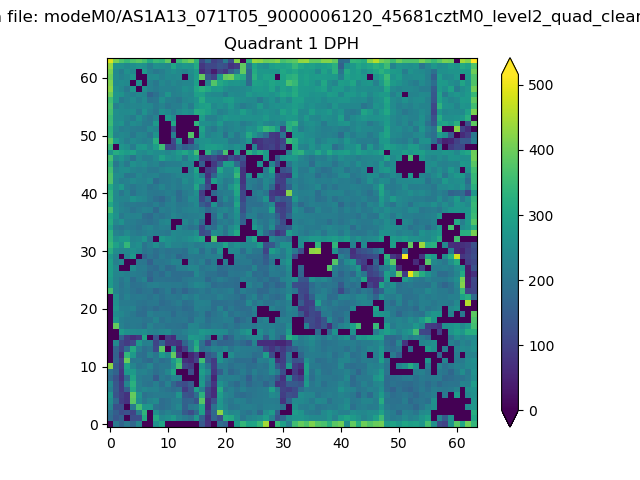 |
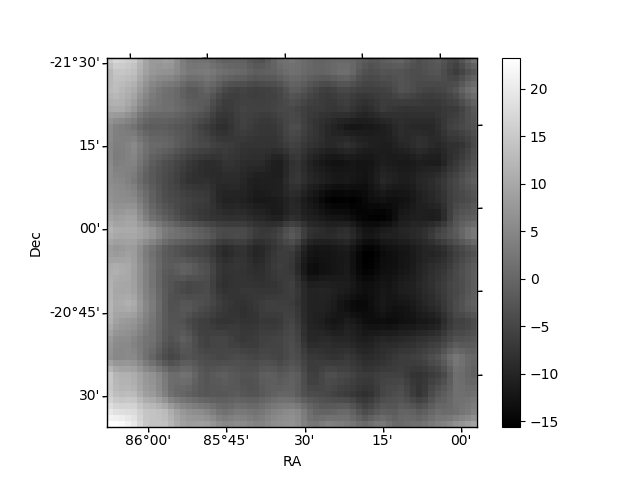
Quadrant B |
|---|---|---|---|
| Quadrant D | 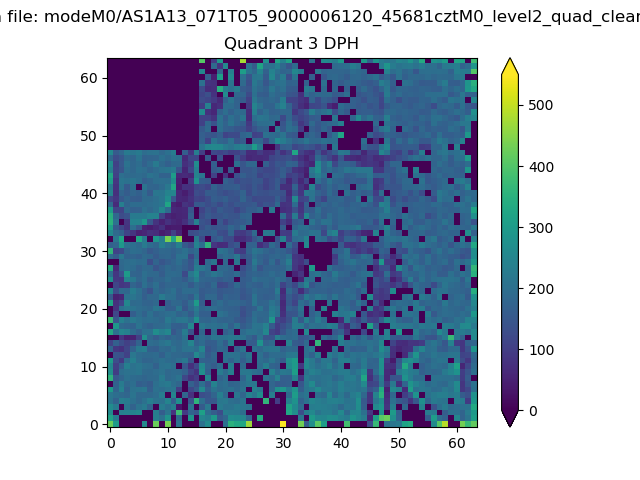 |
 |
Quadrant C |
| Plot type | Count rate plots | Images |
|---|---|---|
| Comparison with Poisson distribution Blue bars denote a histogram of data divided into 1 sec bins. Red curve is a Poisson curve with rate = median count rate of data. |
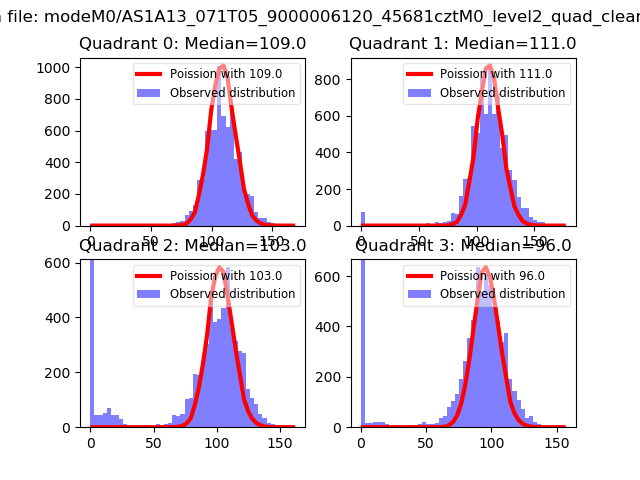 |
 |
| Quadrant-wise count rates Data is divided into 100 sec bins |
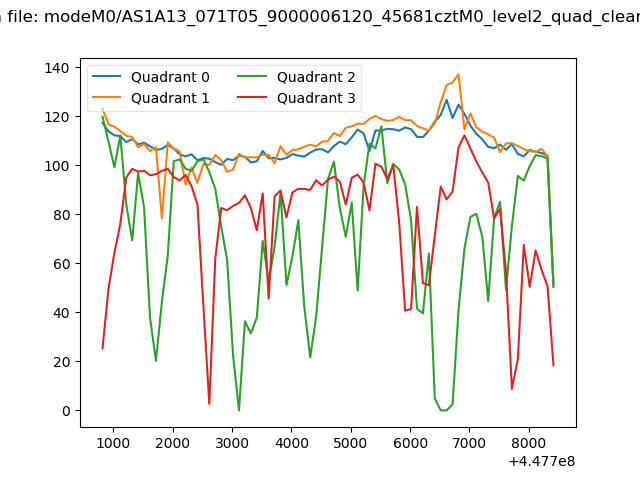 |
|
| Module-wise count rates for Quadrant A Data is divided into 100 sec bins |
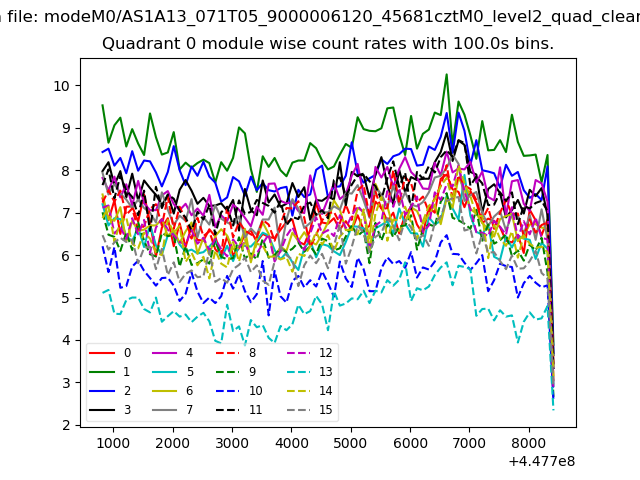 |
 |
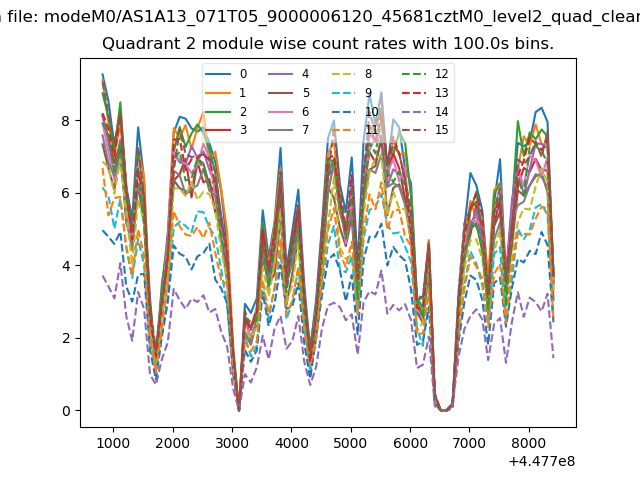
| Module-wise count rates for Quadrant B Data is divided into 100 sec bins |
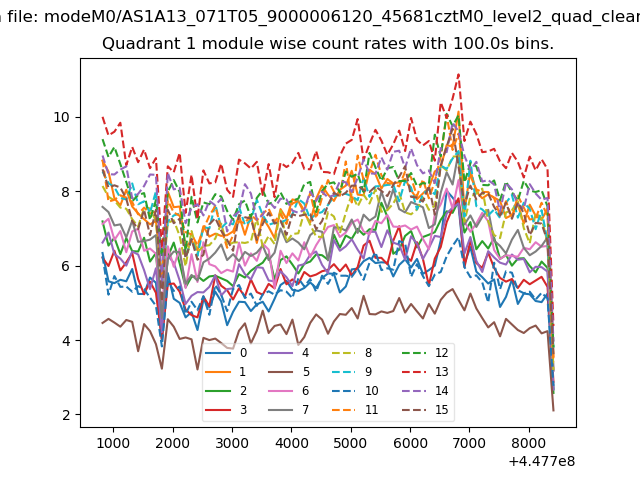 |
 |
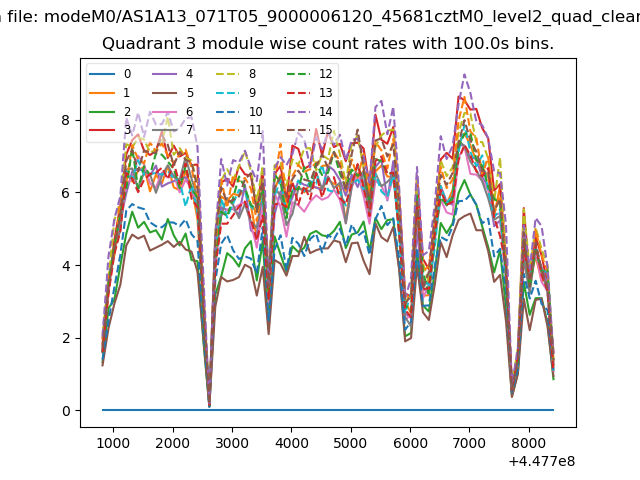
| Module-wise count rates for Quadrant C Data is divided into 100 sec bins |
 |
 |
| Module-wise count rates for Quadrant D Data is divided into 100 sec bins |
 |
 |
| Parameter | Plot |
|---|---|
| CZT HV Monitor |  |
| D_VDD | 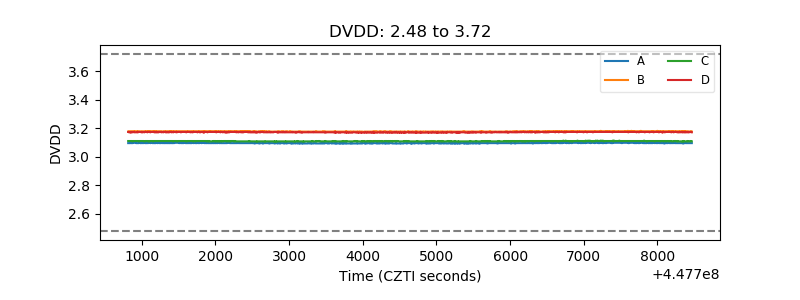 |
| Temperature 1 | 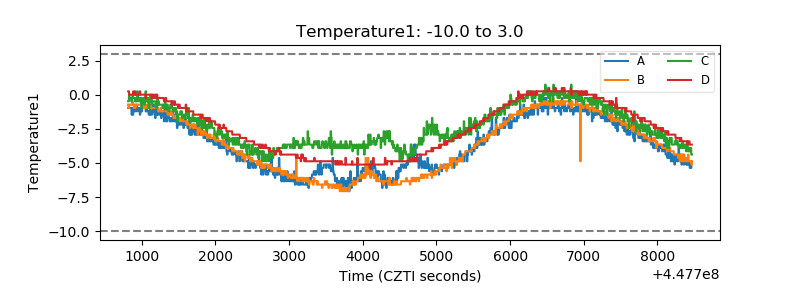 |
| Veto HV Monitor | 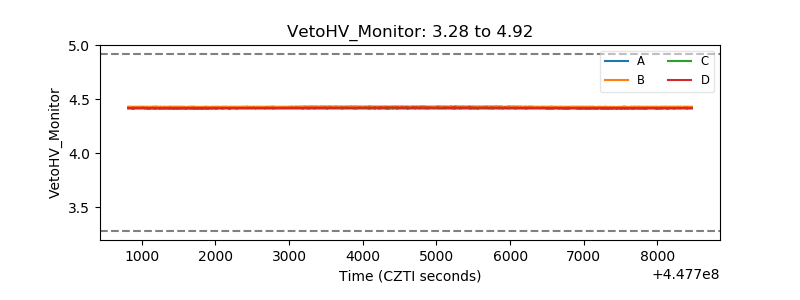 |
| Veto LLD | 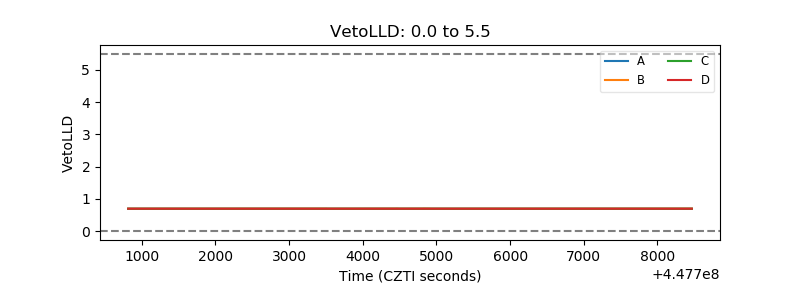 |
| Alpha Counter | 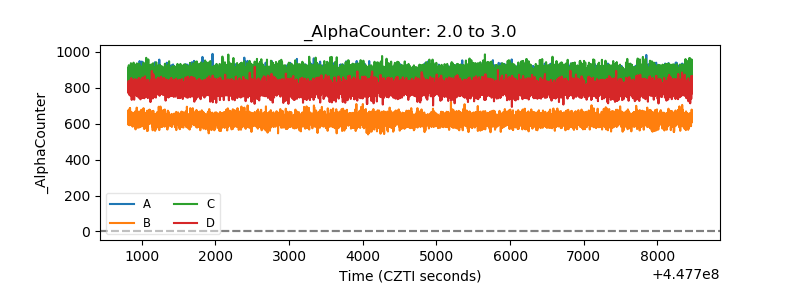 |
| _CPM_Rate | 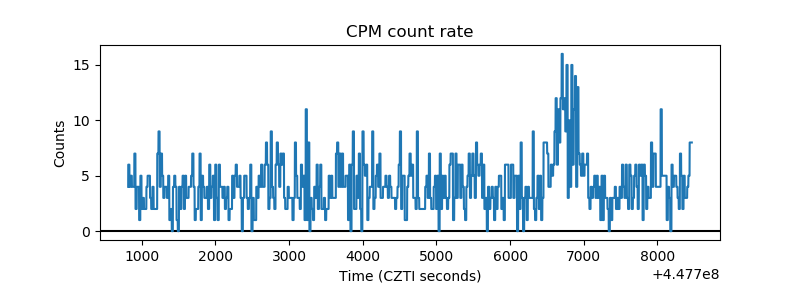 |
| CZT Counter | 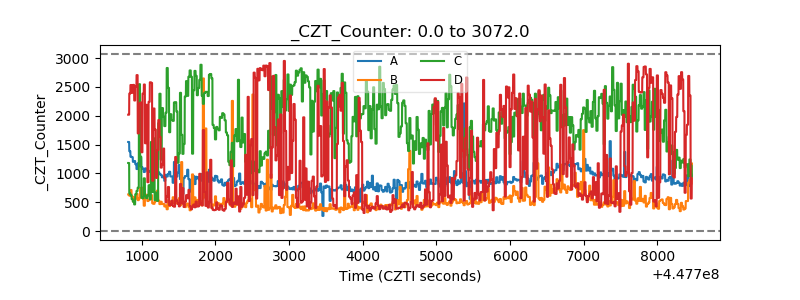 |
| +2.5 Volts monitor | 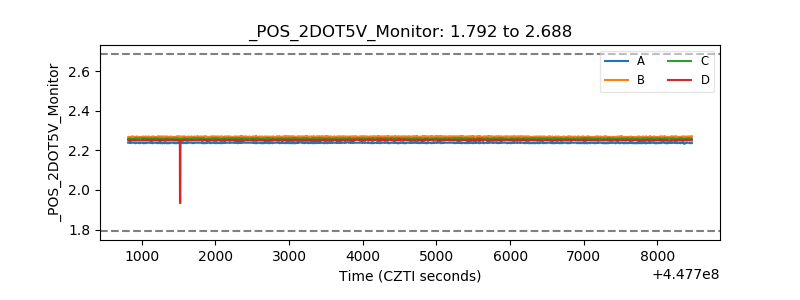 |
| +5 Volts monitor | 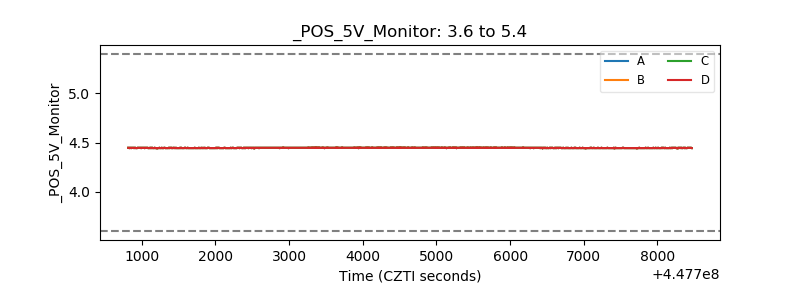 |
| _ROLL_ROT | 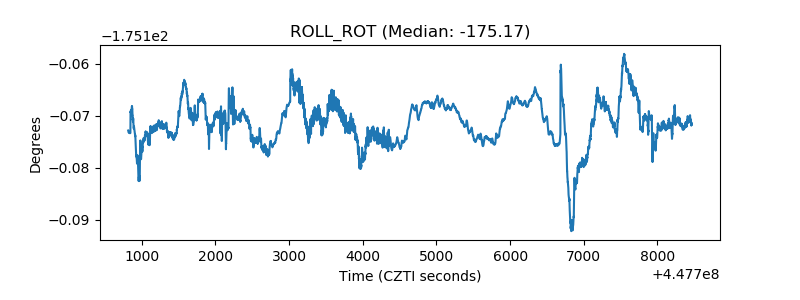 |
| _Roll_DEC | 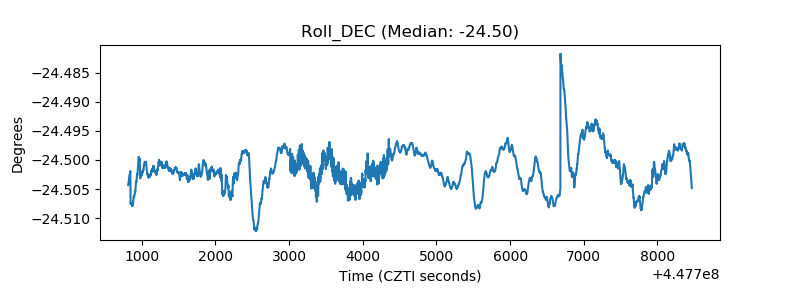 |
| _Roll_RA | 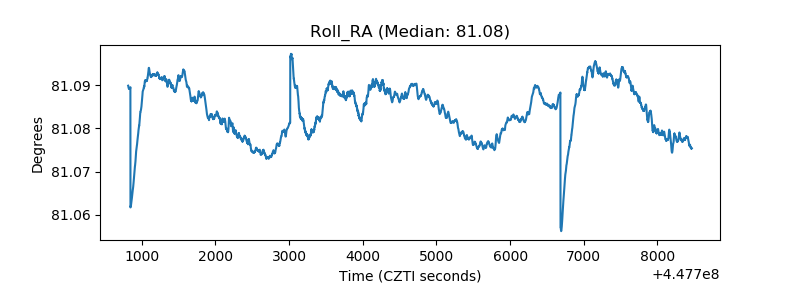 |
| Veto Counter | 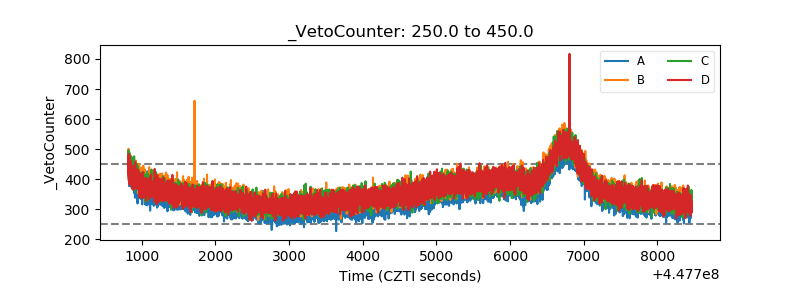 |