| Param | Original file | Final file |
|---|---|---|
| Filename | modeM0/AS1A13_071T05_9000006120_45682cztM0_level2.fits | modeM0/AS1A13_071T05_9000006120_45682cztM0_level2_quad_clean.evt |
| Size (bytes) | 919,733,760 | 111,847,680 |
| Size | 877.1 MB | 106.7 MB |
| Events in quadrant A | 6,905,586 | 833,790 |
| Events in quadrant B | 4,245,406 | 848,138 |
| Events in quadrant C | 14,934,592 | 493,750 |
| Events in quadrant D | 7,359,076 | 668,759 |
| Mode M0 | |||
|---|---|---|---|
| Quadrant | BADHDUFLAG | Total packets | Discarded packets |
| A | 0 | 25827 | 0 |
| B | 0 | 17857 | 0 |
| C | 0 | 49724 | 3 |
| D | 0 | 27233 | 0 |
| Mode SS | |||
|---|---|---|---|
| Quadrant | BADHDUFLAG | Total packets | Discarded packets |
| A | 0 | 156 | 0 |
| B | 0 | 156 | 0 |
| C | 0 | 156 | 0 |
| D | 0 | 156 | 0 |
| Quadrant | Total seconds | Saturated seconds | Saturation percentage |
|---|---|---|---|
| A | 7787 | 62 | 0.796199% |
| B | 7788 | 99 | 1.271186% |
| C | 7787 | 3672 | 47.155516% |
| D | 7787 | 1084 | 13.920637% |
Noise dominated data is calculated using 1-second bins in cleaned event files. If a bin has >2000 counts, and if more than 50% of those come from <1% of pixels, then it is considered to be noise-dominated and hence unusable.
| Quadrant | # 1 sec bins | Bins with >0 counts | Bins with >2000 counts | High rate bins dominated by noise | Noise dominated (total time) | Noise dominated (detector-on time) | Marked lightcurve |
|---|---|---|---|---|---|---|---|
| A | 7787 | 7787 | 3 | 3 | 0.04% | 0.04% | 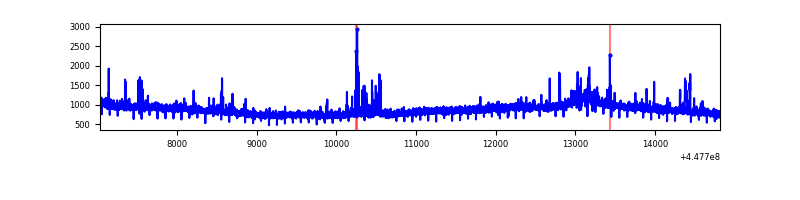 |
| B | 7788 | 7788 | 71 | 71 | 0.91% | 0.91% | 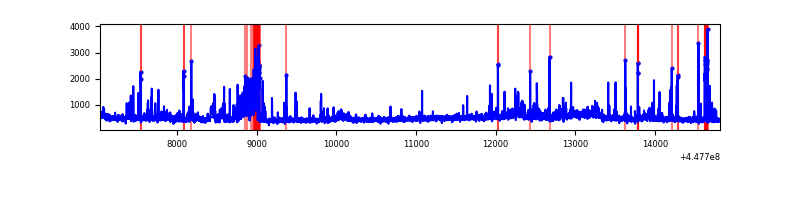 |
| C | 7787 | 7787 | 4114 | 4114 | 52.83% | 52.83% | 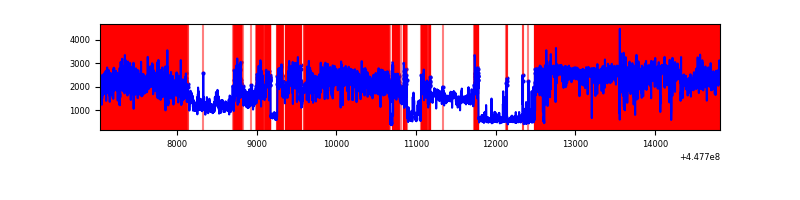 |
| D | 7787 | 7787 | 911 | 911 | 11.70% | 11.70% | 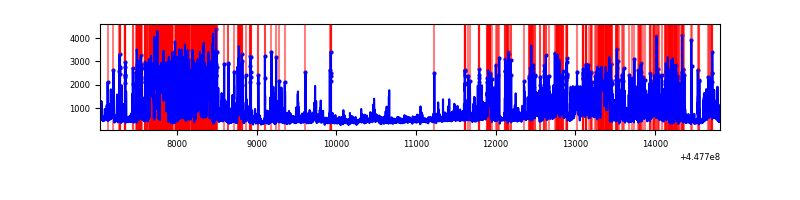 |
Top three noisy pixels from each quadrant. If the there are fewer than three noisy pixels in the level2.evt file, extra rows are filled as -1
| Pixel properties | Quadrant properties | ||||||
|---|---|---|---|---|---|---|---|
| Quadrant | DetID | PixID | Counts | Sigma | Mean | Median | Sigma |
| A | 10 | 83 | 3338254 | 18412.36 | 862 | 843 | 181.3 |
| A | 13 | 248 | 81741 | 446.31 | 862 | 843 | 181.3 |
| A | 10 | 248 | 45621 | 247.04 | 862 | 843 | 181.3 |
| B | 5 | 255 | 290552 | 1718.23 | 862 | 836 | 168.6 |
| B | 3 | 112 | 212088 | 1252.88 | 862 | 836 | 168.6 |
| B | 5 | 172 | 85149 | 500.04 | 862 | 836 | 168.6 |
| C | 9 | 54 | 11762585 | 70517.82 | 706 | 710 | 166.8 |
| C | 14 | 254 | 277369 | 1658.7 | 706 | 710 | 166.8 |
| C | 12 | 2 | 59553 | 352.79 | 706 | 710 | 166.8 |
| D | 1 | 52 | 3310801 | 16352.75 | 790 | 764 | 202.4 |
| D | 2 | 249 | 279164 | 1375.39 | 790 | 764 | 202.4 |
| D | 13 | 249 | 235439 | 1159.38 | 790 | 764 | 202.4 |
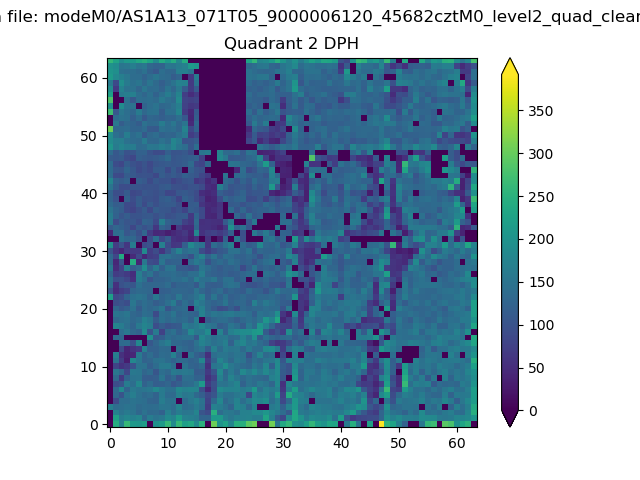
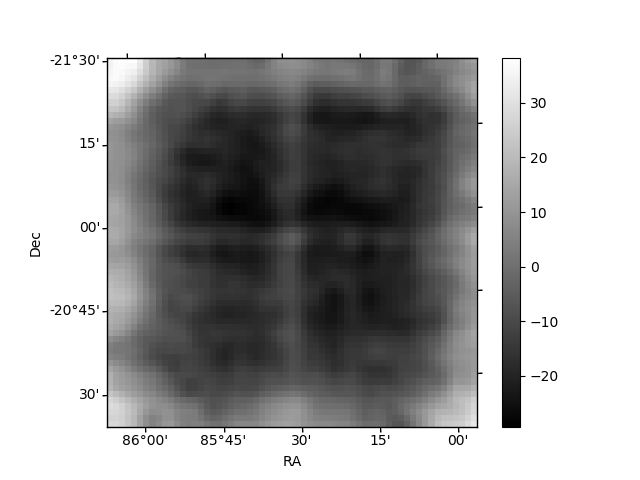
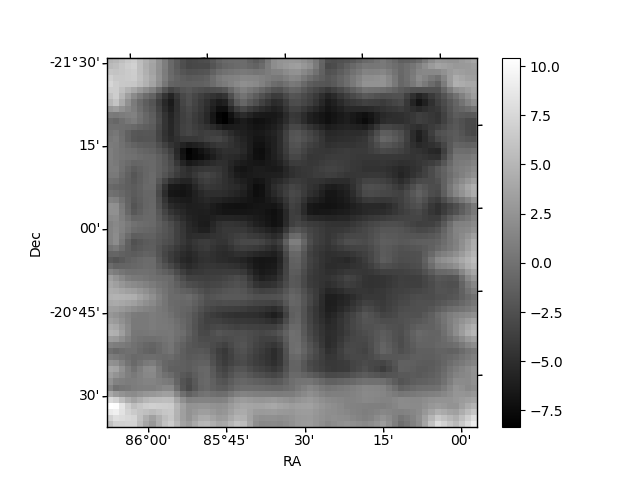
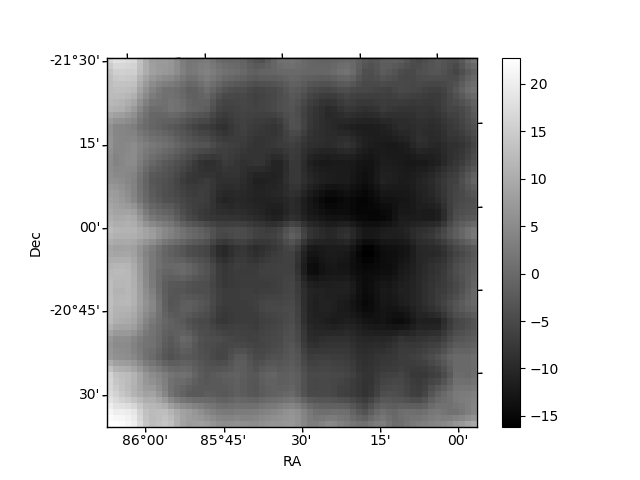
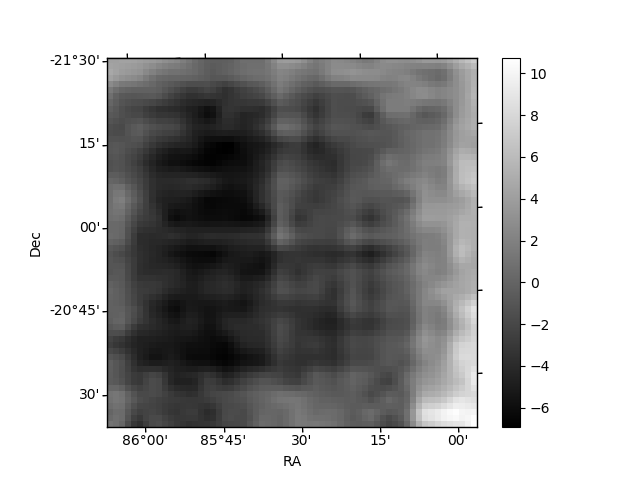
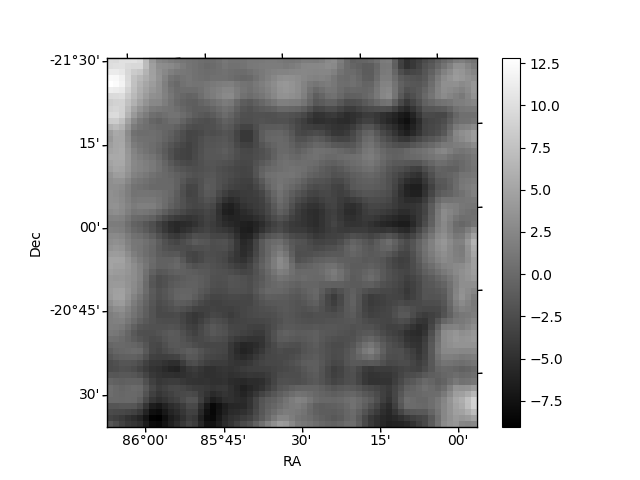
Histogram calculated using DETX and DETY for each event in the final _common_clean file
| Quadrant A | 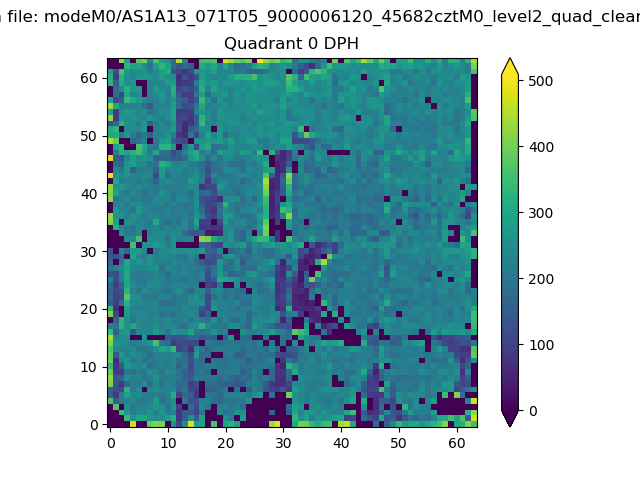 |
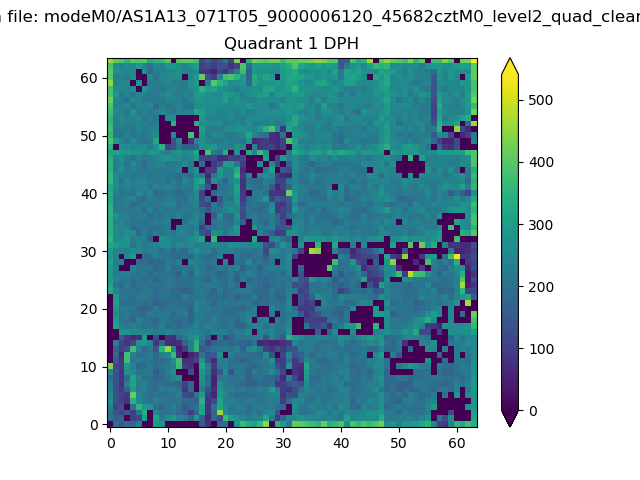 |
Quadrant B |
|---|---|---|---|
| Quadrant D | 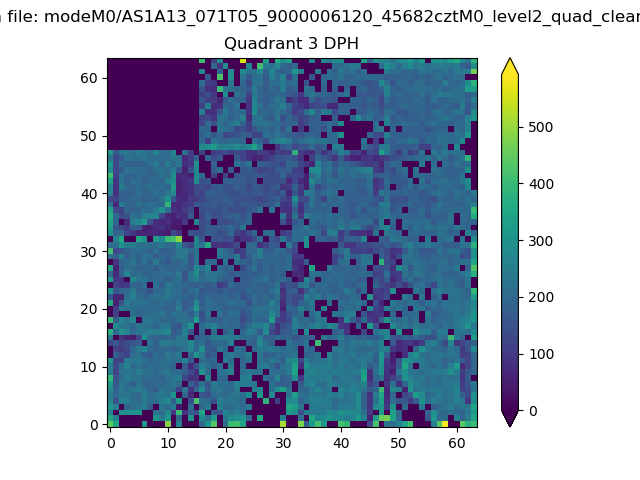 |
 |
Quadrant C |
| Plot type | Count rate plots | Images |
|---|---|---|
| Comparison with Poisson distribution Blue bars denote a histogram of data divided into 1 sec bins. Red curve is a Poisson curve with rate = median count rate of data. |
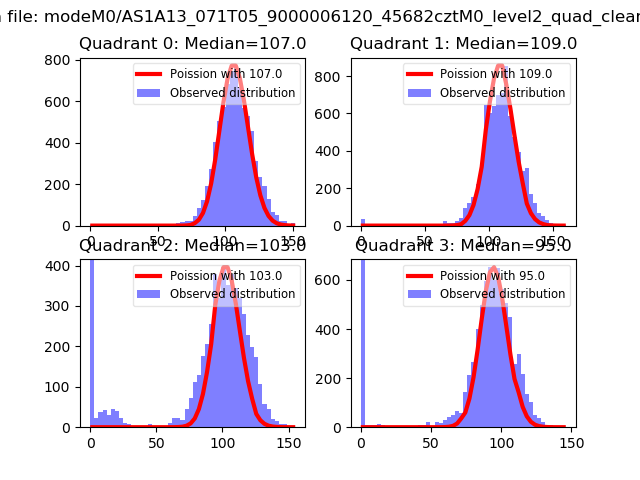 |
 |
| Quadrant-wise count rates Data is divided into 100 sec bins |
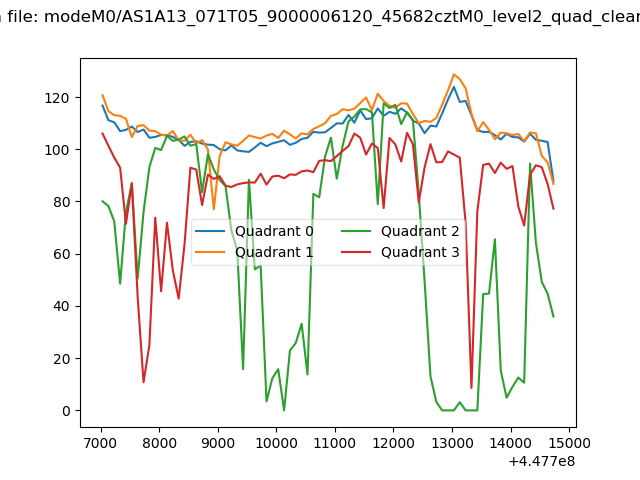 |
|
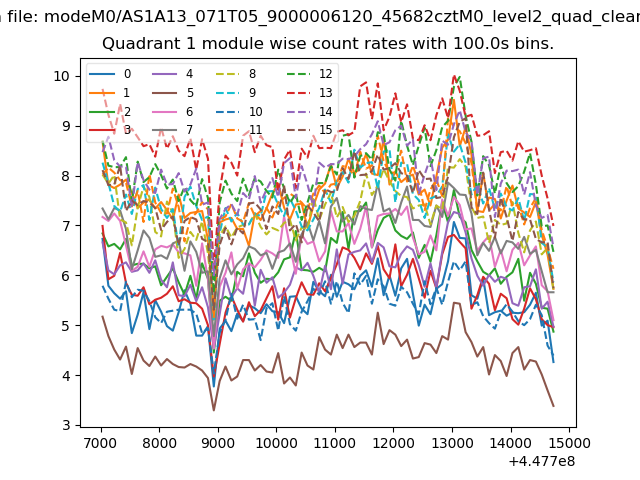
| Module-wise count rates for Quadrant A Data is divided into 100 sec bins |
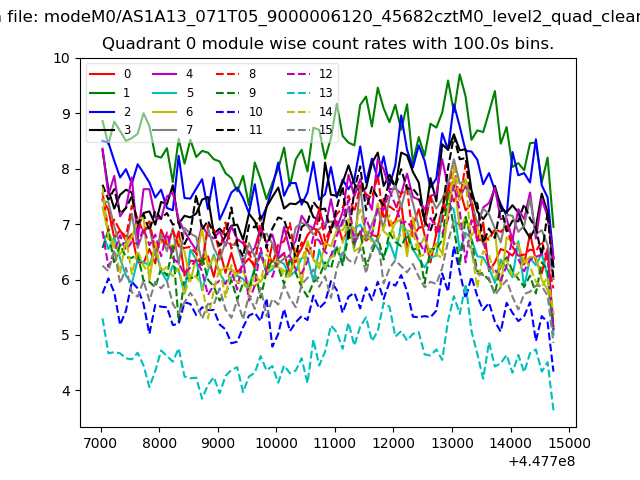 |
 |
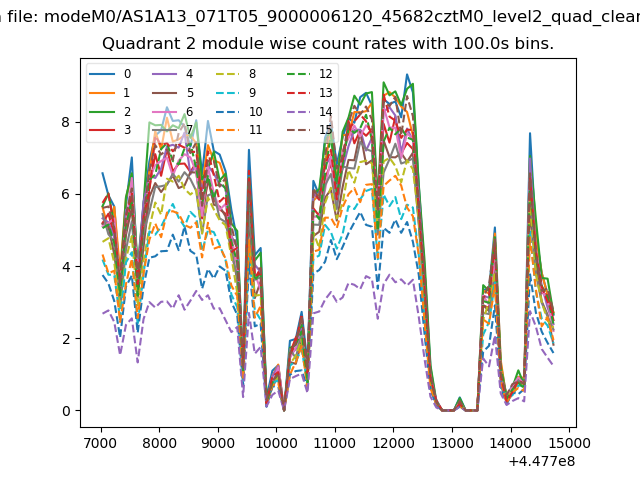
| Module-wise count rates for Quadrant B Data is divided into 100 sec bins |
 |
 |
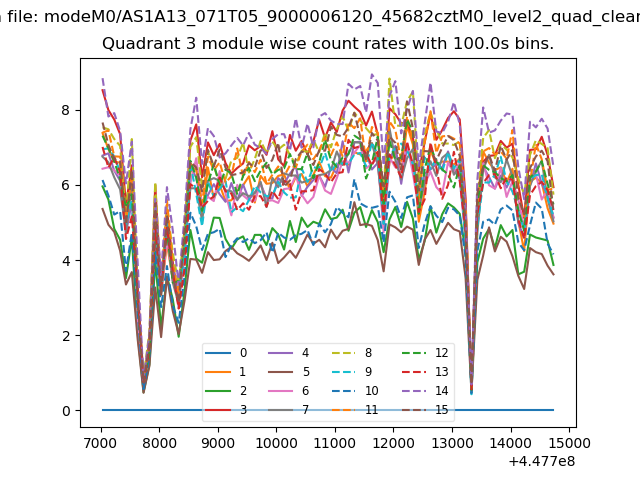
| Module-wise count rates for Quadrant C Data is divided into 100 sec bins |
 |
 |
| Module-wise count rates for Quadrant D Data is divided into 100 sec bins |
 |
 |
| Parameter | Plot |
|---|---|
| CZT HV Monitor |  |
| D_VDD | 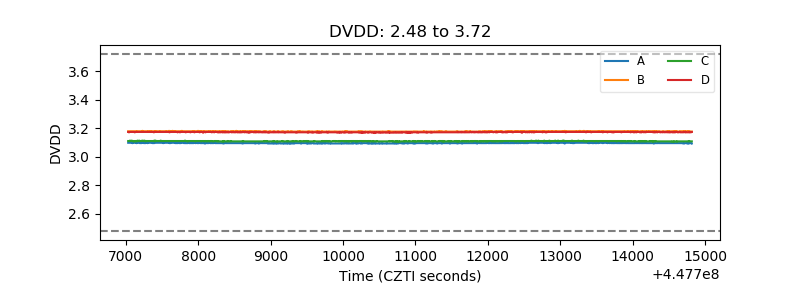 |
| Temperature 1 | 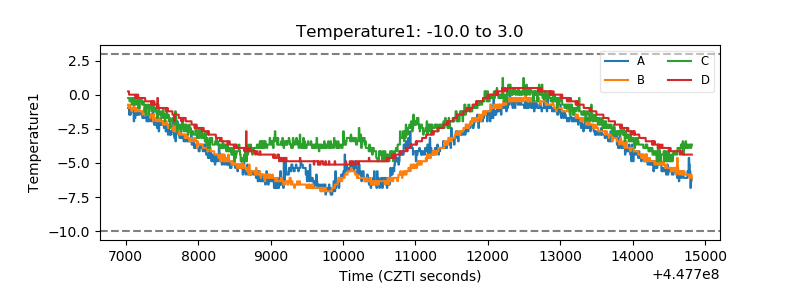 |
| Veto HV Monitor | 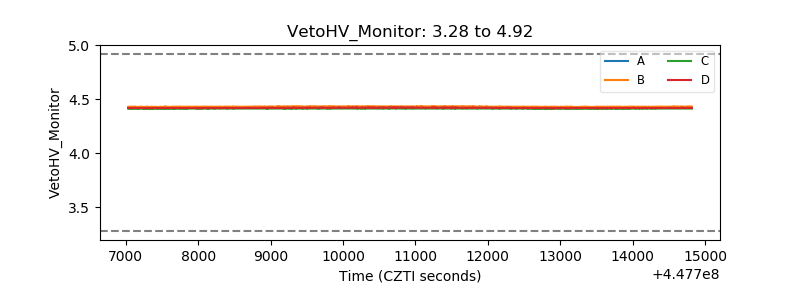 |
| Veto LLD | 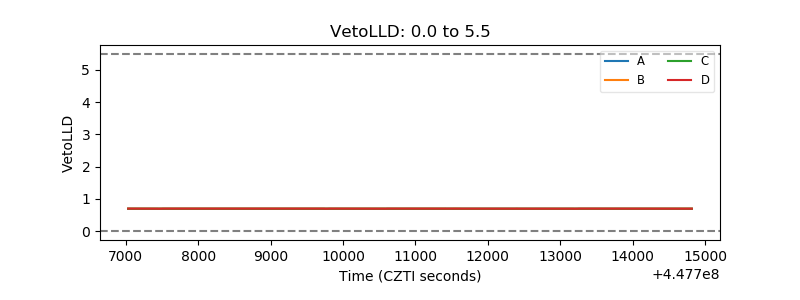 |
| Alpha Counter | 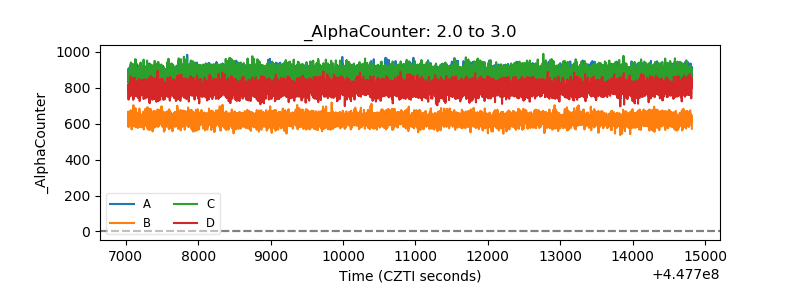 |
| _CPM_Rate | 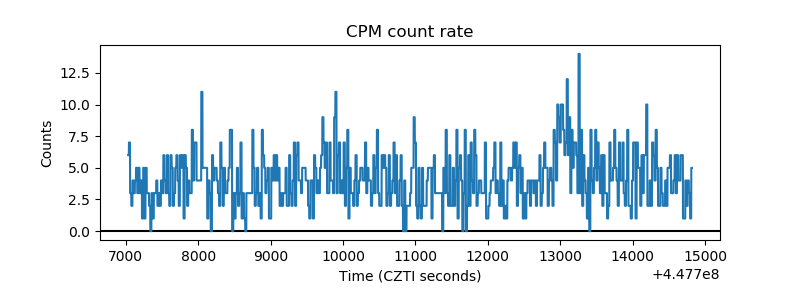 |
| CZT Counter | 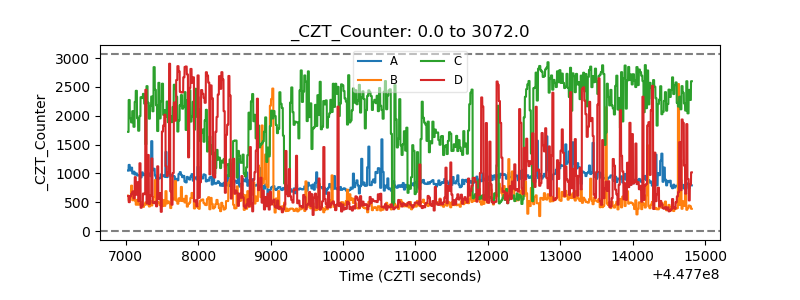 |
| +2.5 Volts monitor | 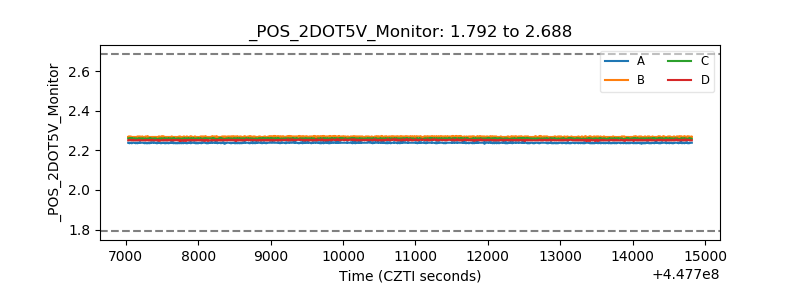 |
| +5 Volts monitor | 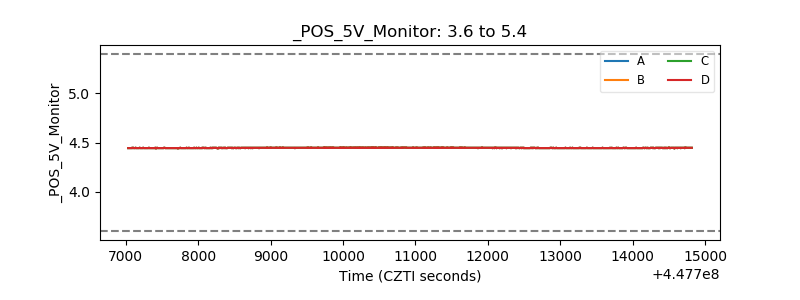 |
| _ROLL_ROT | 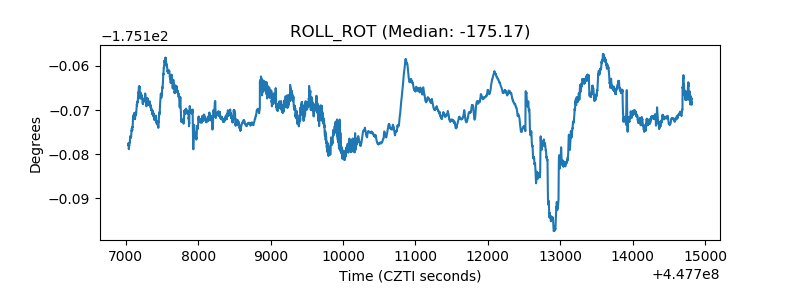 |
| _Roll_DEC | 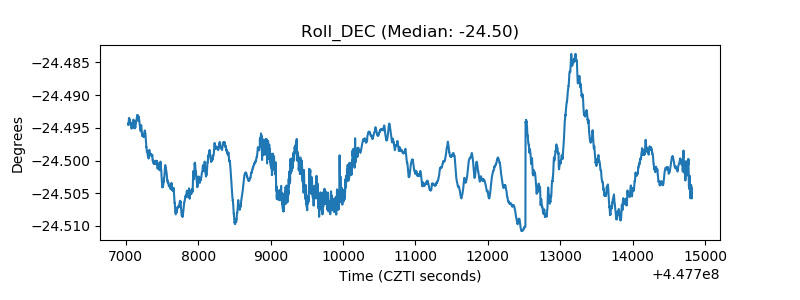 |
| _Roll_RA | 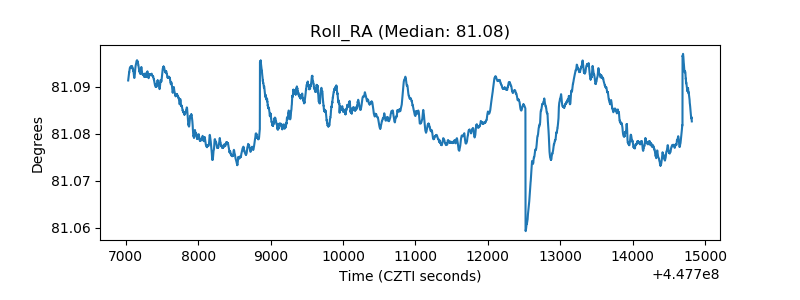 |
| Veto Counter | 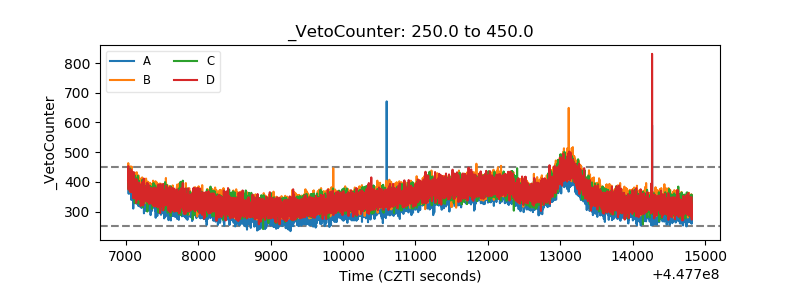 |