| Param | Original file | Final file |
|---|---|---|
| Filename | modeM0/AS1A13_071T05_9000006120_45683cztM0_level2.fits | modeM0/AS1A13_071T05_9000006120_45683cztM0_level2_quad_clean.evt |
| Size (bytes) | 751,919,040 | 112,671,360 |
| Size | 717.1 MB | 107.5 MB |
| Events in quadrant A | 6,525,003 | 793,690 |
| Events in quadrant B | 4,009,246 | 814,729 |
| Events in quadrant C | 9,573,197 | 603,629 |
| Events in quadrant D | 7,146,003 | 676,707 |
| Mode M0 | |||
|---|---|---|---|
| Quadrant | BADHDUFLAG | Total packets | Discarded packets |
| A | 0 | 24424 | 0 |
| B | 0 | 17102 | 0 |
| C | 0 | 33712 | 0 |
| D | 0 | 26542 | 0 |
| Mode SS | |||
|---|---|---|---|
| Quadrant | BADHDUFLAG | Total packets | Discarded packets |
| A | 0 | 150 | 0 |
| B | 0 | 150 | 0 |
| C | 0 | 150 | 0 |
| D | 0 | 150 | 0 |
| Quadrant | Total seconds | Saturated seconds | Saturation percentage |
|---|---|---|---|
| A | 7506 | 124 | 1.652012% |
| B | 7507 | 103 | 1.372053% |
| C | 7506 | 2063 | 27.484679% |
| D | 7506 | 671 | 8.939515% |
Noise dominated data is calculated using 1-second bins in cleaned event files. If a bin has >2000 counts, and if more than 50% of those come from <1% of pixels, then it is considered to be noise-dominated and hence unusable.
| Quadrant | # 1 sec bins | Bins with >0 counts | Bins with >2000 counts | High rate bins dominated by noise | Noise dominated (total time) | Noise dominated (detector-on time) | Marked lightcurve |
|---|---|---|---|---|---|---|---|
| A | 7506 | 7506 | 10 | 10 | 0.13% | 0.13% | 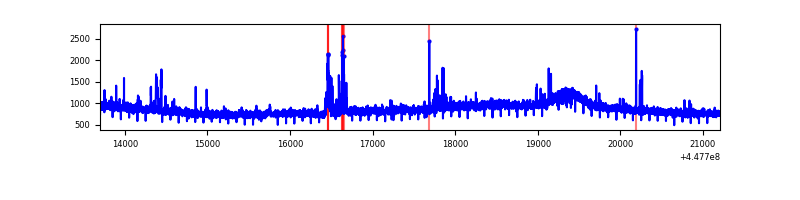 |
| B | 7507 | 7507 | 43 | 43 | 0.57% | 0.57% | 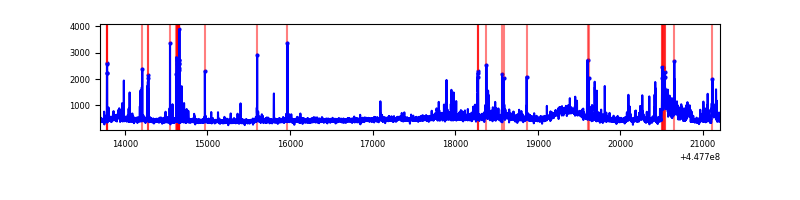 |
| C | 7506 | 7506 | 2260 | 2260 | 30.11% | 30.11% |  |
| D | 7506 | 7506 | 540 | 540 | 7.19% | 7.19% | 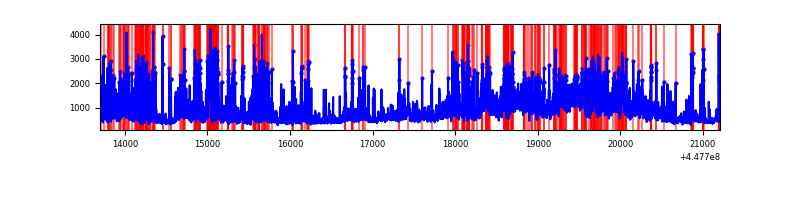 |
Top three noisy pixels from each quadrant. If the there are fewer than three noisy pixels in the level2.evt file, extra rows are filled as -1
| Pixel properties | Quadrant properties | ||||||
|---|---|---|---|---|---|---|---|
| Quadrant | DetID | PixID | Counts | Sigma | Mean | Median | Sigma |
| A | 10 | 83 | 3094650 | 17546.02 | 834 | 813 | 176.3 |
| A | 13 | 248 | 86555 | 486.27 | 834 | 813 | 176.3 |
| A | 14 | 235 | 47594 | 265.31 | 834 | 813 | 176.3 |
| B | 5 | 255 | 262671 | 1577.38 | 838 | 813 | 166.0 |
| B | 3 | 112 | 130223 | 779.54 | 838 | 813 | 166.0 |
| B | 5 | 172 | 77708 | 463.2 | 838 | 813 | 166.0 |
| C | 9 | 54 | 6293971 | 34987.84 | 758 | 761 | 179.9 |
| C | 14 | 254 | 247089 | 1369.49 | 758 | 761 | 179.9 |
| C | 12 | 2 | 56681 | 310.89 | 758 | 761 | 179.9 |
| D | 1 | 52 | 2068451 | 10224.72 | 794 | 770 | 202.2 |
| D | 11 | 241 | 1274599 | 6299.11 | 794 | 770 | 202.2 |
| D | 13 | 249 | 245021 | 1207.83 | 794 | 770 | 202.2 |
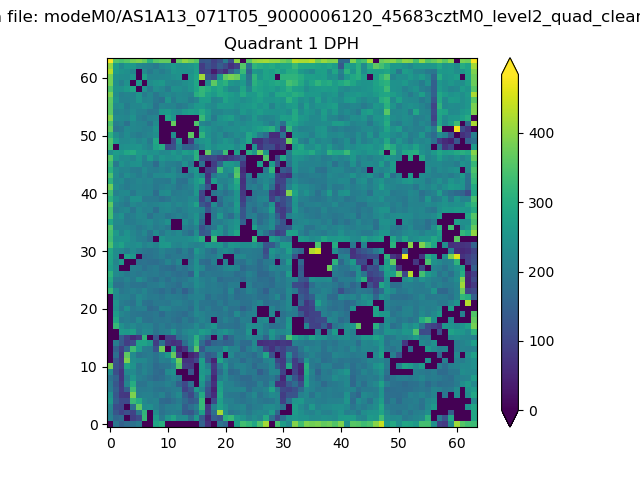
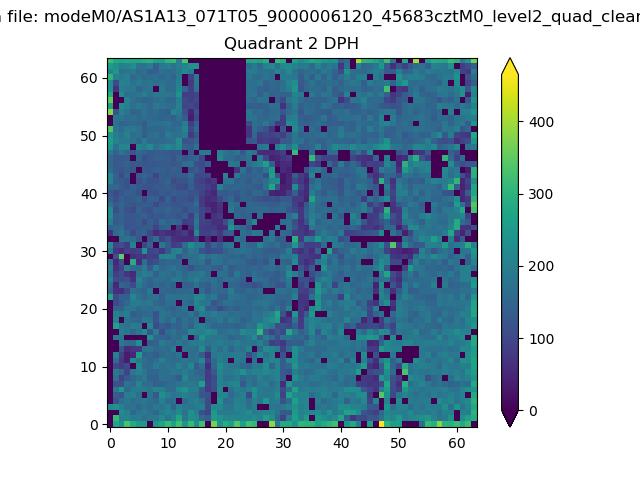
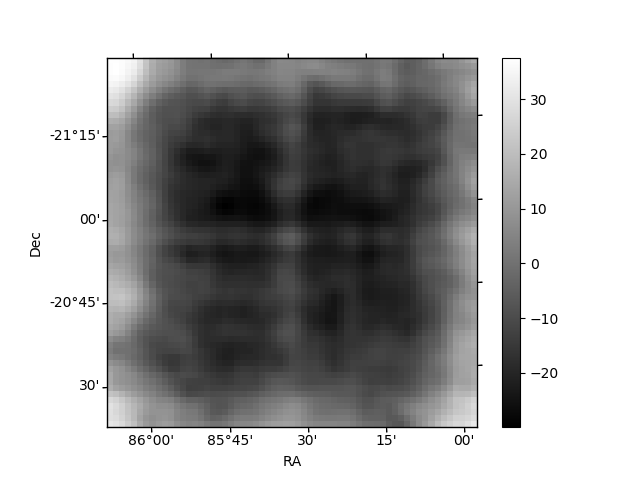
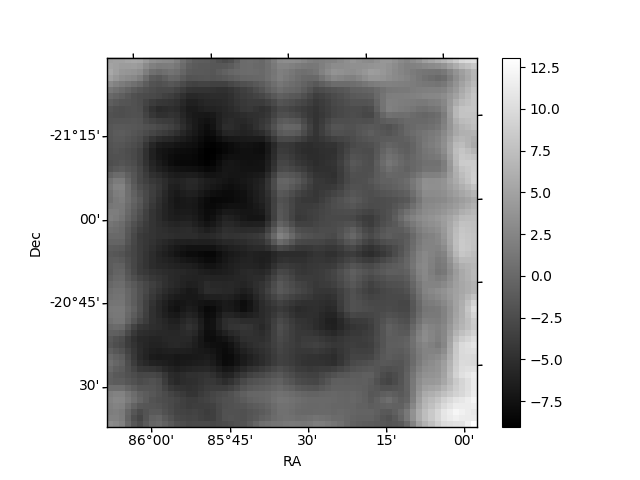
Histogram calculated using DETX and DETY for each event in the final _common_clean file
| Quadrant A | 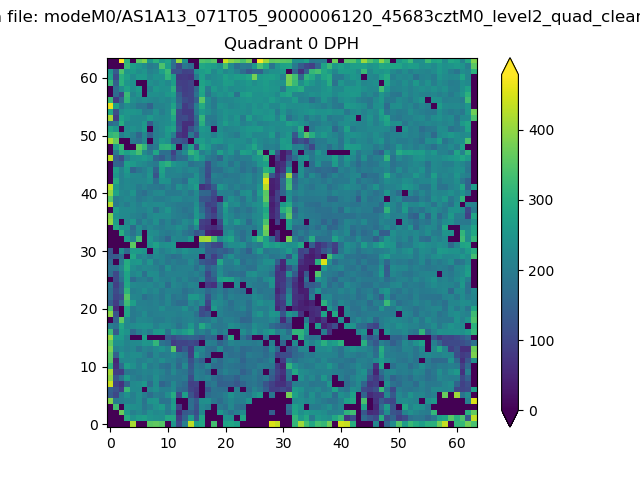 |
 |
Quadrant B |
|---|---|---|---|
| Quadrant D | 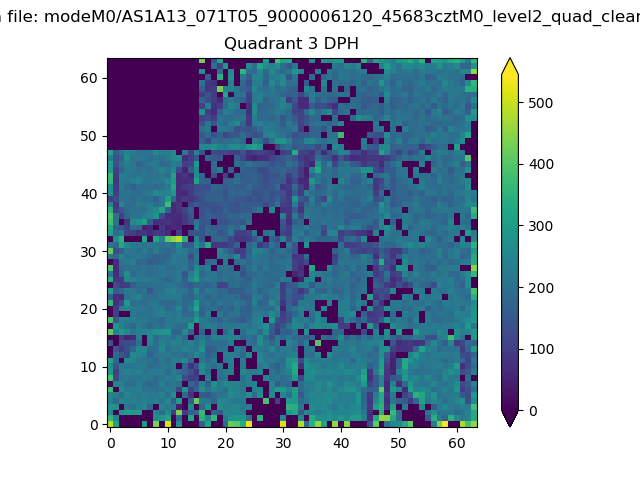 |
 |
Quadrant C |
| Plot type | Count rate plots | Images |
|---|---|---|
| Comparison with Poisson distribution Blue bars denote a histogram of data divided into 1 sec bins. Red curve is a Poisson curve with rate = median count rate of data. |
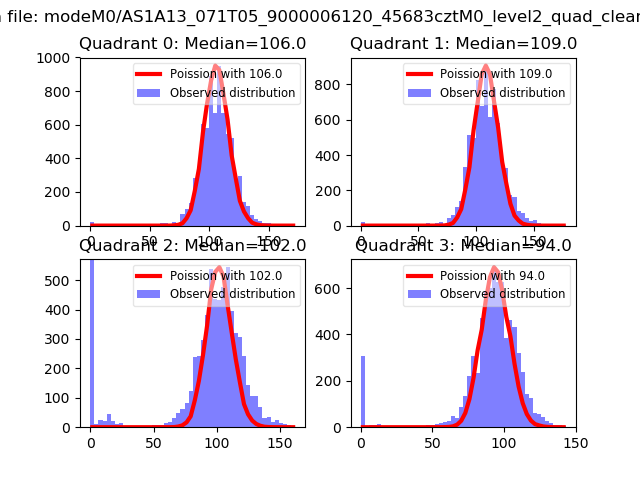 |
 |
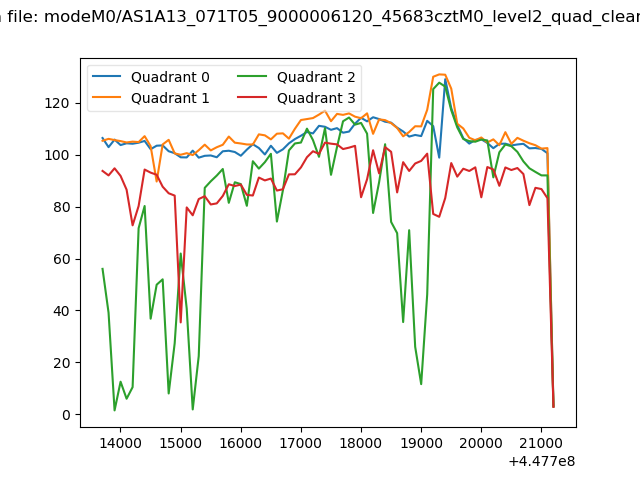
| Quadrant-wise count rates Data is divided into 100 sec bins |
 |
|
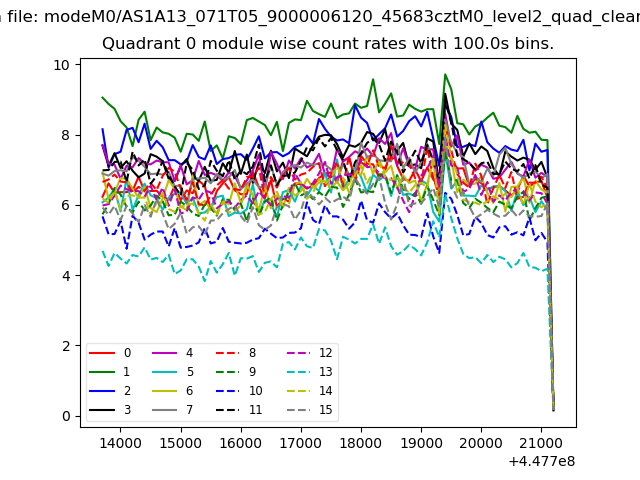
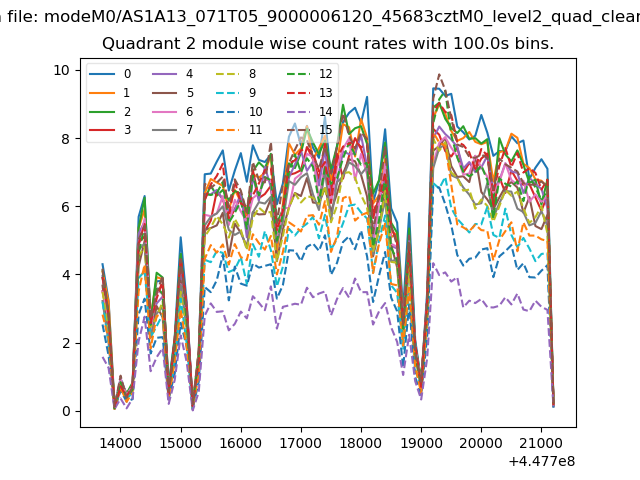
| Module-wise count rates for Quadrant A Data is divided into 100 sec bins |
 |
 |
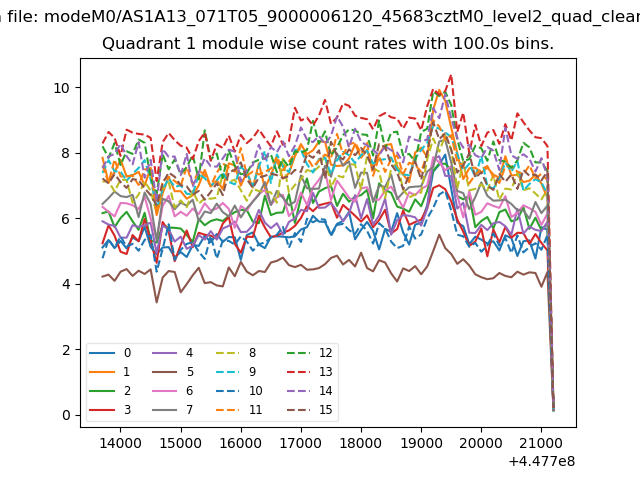
| Module-wise count rates for Quadrant B Data is divided into 100 sec bins |
 |
 |
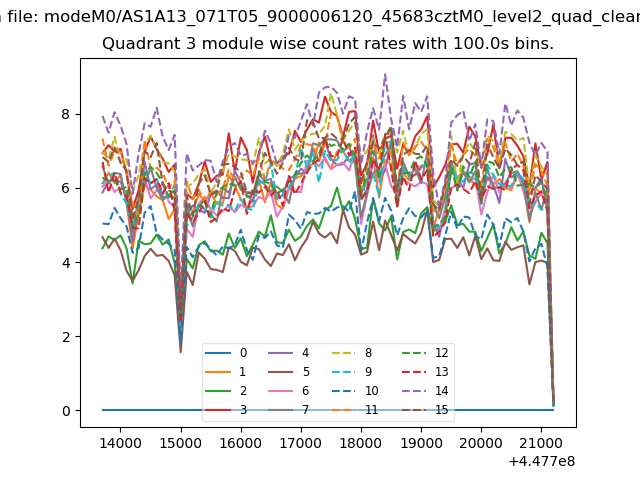
| Module-wise count rates for Quadrant C Data is divided into 100 sec bins |
 |
 |
| Module-wise count rates for Quadrant D Data is divided into 100 sec bins |
 |
 |
| Parameter | Plot |
|---|---|
| CZT HV Monitor | 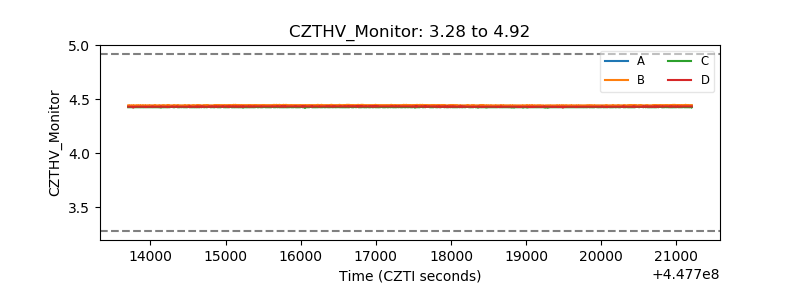 |
| D_VDD | 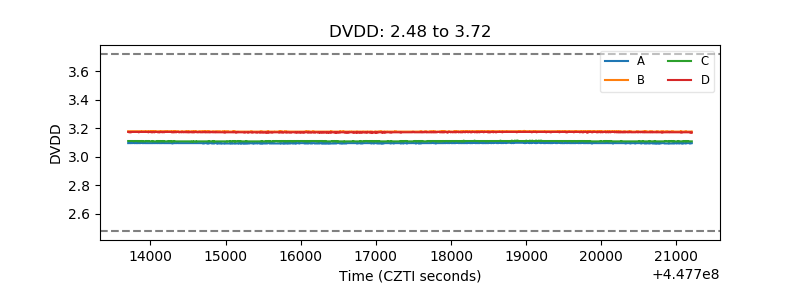 |
| Temperature 1 | 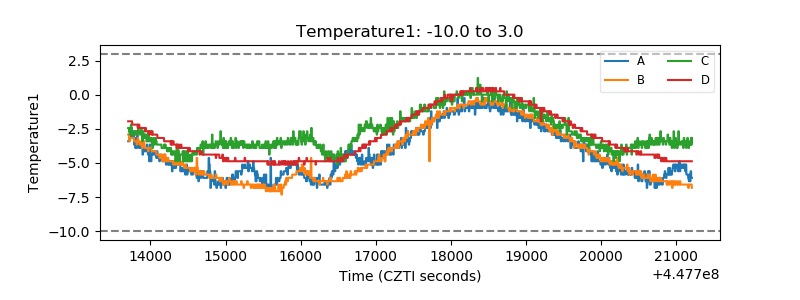 |
| Veto HV Monitor | 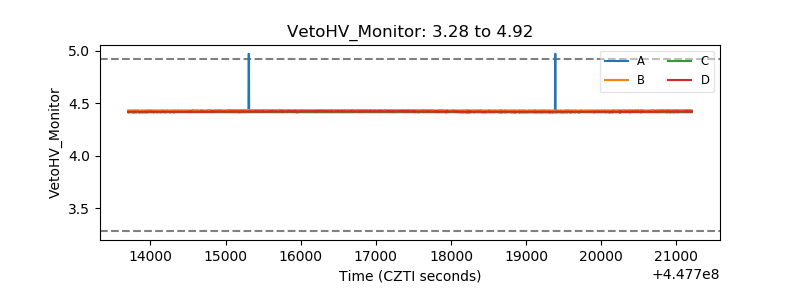 |
| Veto LLD | 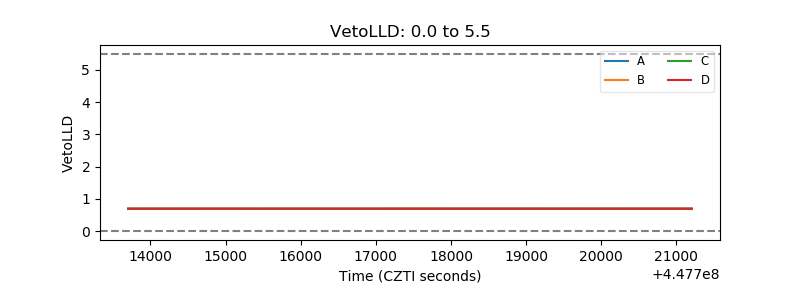 |
| Alpha Counter | 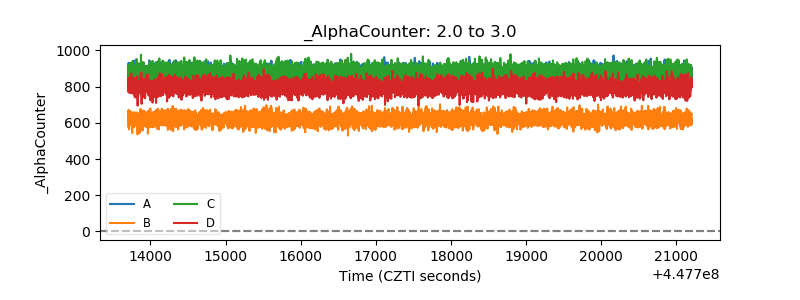 |
| _CPM_Rate | 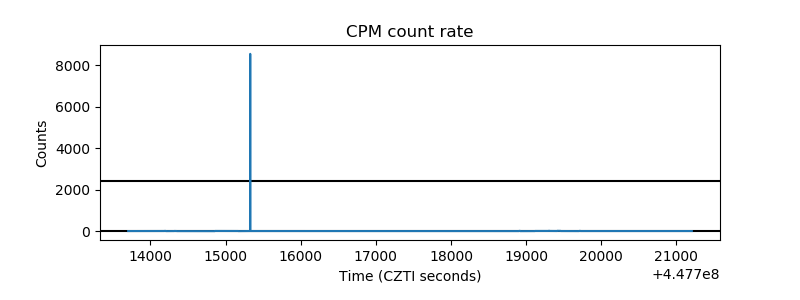 |
| CZT Counter | 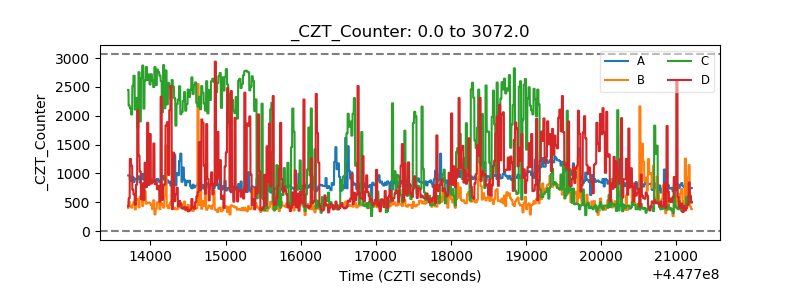 |
| +2.5 Volts monitor | 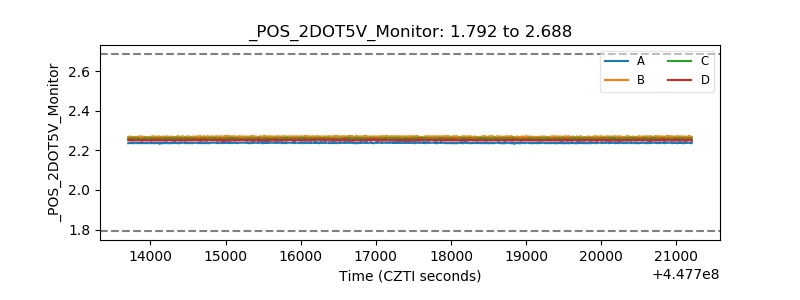 |
| +5 Volts monitor | 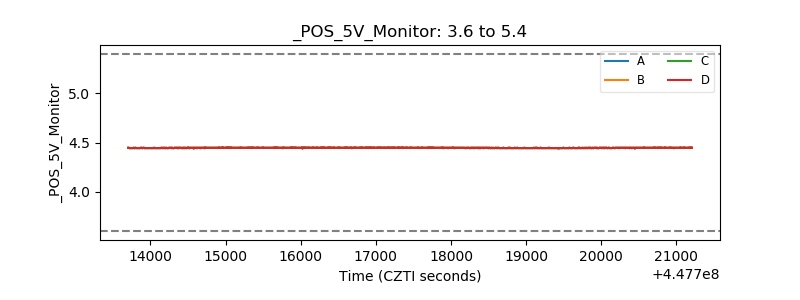 |
| _ROLL_ROT | 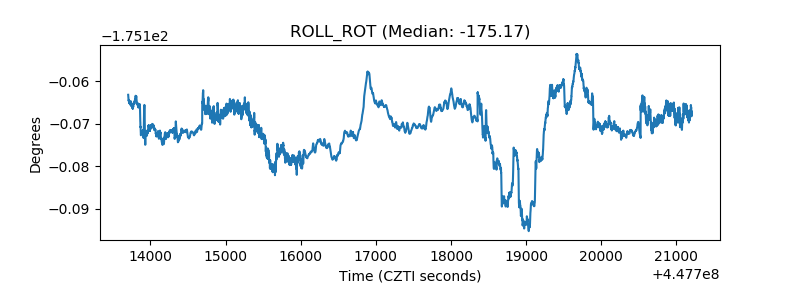 |
| _Roll_DEC | 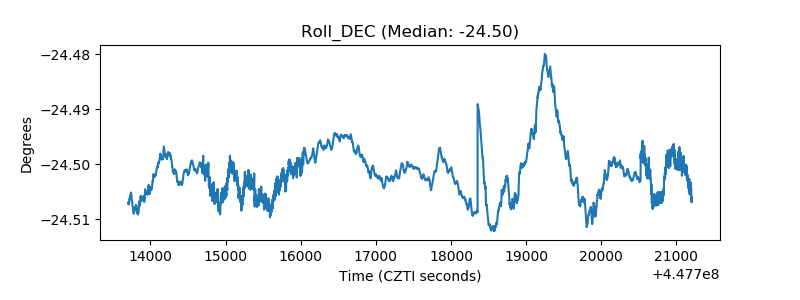 |
| _Roll_RA |  |
| Veto Counter | 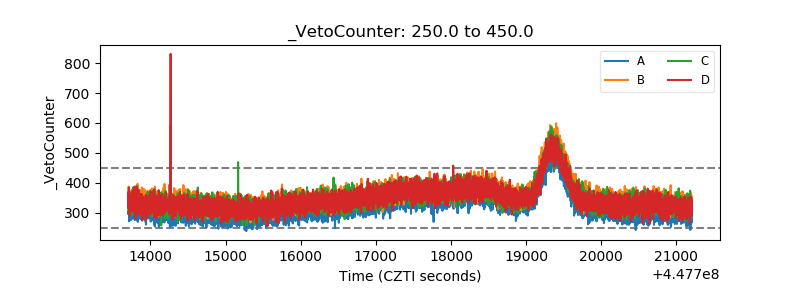 |