| Param | Original file | Final file |
|---|---|---|
| Filename | modeM0/AS1A13_071T05_9000006120_45686cztM0_level2.fits | modeM0/AS1A13_071T05_9000006120_45686cztM0_level2_quad_clean.evt |
| Size (bytes) | 527,616,000 | 112,236,480 |
| Size | 503.2 MB | 107.0 MB |
| Events in quadrant A | 6,091,801 | 737,720 |
| Events in quadrant B | 3,885,946 | 767,690 |
| Events in quadrant C | 4,682,793 | 735,168 |
| Events in quadrant D | 4,320,301 | 663,550 |
| Mode M0 | |||
|---|---|---|---|
| Quadrant | BADHDUFLAG | Total packets | Discarded packets |
| A | 0 | 22707 | 2 |
| B | 0 | 16323 | 2 |
| C | 0 | 18905 | 2 |
| D | 0 | 17677 | 2 |
| Mode M9 | |||
|---|---|---|---|
| Quadrant | BADHDUFLAG | Total packets | Discarded packets |
| A | 0 | 10 | 0 |
| B | 0 | 11 | 0 |
| C | 0 | 11 | 0 |
| D | 0 | 11 | 0 |
| Mode SS | |||
|---|---|---|---|
| Quadrant | BADHDUFLAG | Total packets | Discarded packets |
| A | 0 | 144 | 0 |
| B | 0 | 144 | 0 |
| C | 0 | 144 | 0 |
| D | 0 | 144 | 0 |
| Quadrant | Total seconds | Saturated seconds | Saturation percentage |
|---|---|---|---|
| A | 7093 | 175 | 2.467221% |
| B | 7093 | 155 | 2.185253% |
| C | 7093 | 114 | 1.607218% |
| D | 7092 | 208 | 2.932882% |
Noise dominated data is calculated using 1-second bins in cleaned event files. If a bin has >2000 counts, and if more than 50% of those come from <1% of pixels, then it is considered to be noise-dominated and hence unusable.
| Quadrant | # 1 sec bins | Bins with >0 counts | Bins with >2000 counts | High rate bins dominated by noise | Noise dominated (total time) | Noise dominated (detector-on time) | Marked lightcurve |
|---|---|---|---|---|---|---|---|
| A | 7878 | 7093 | 2 | 2 | 0.03% | 0.03% | 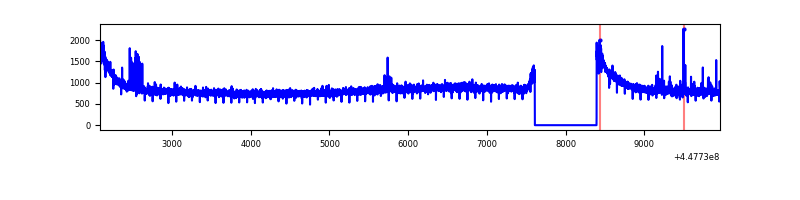 |
| B | 7878 | 7093 | 46 | 46 | 0.58% | 0.65% | 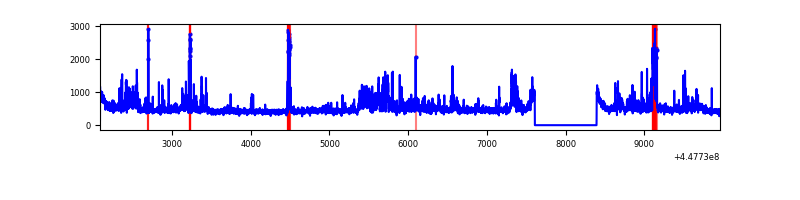 |
| C | 7878 | 7093 | 23 | 23 | 0.29% | 0.32% | 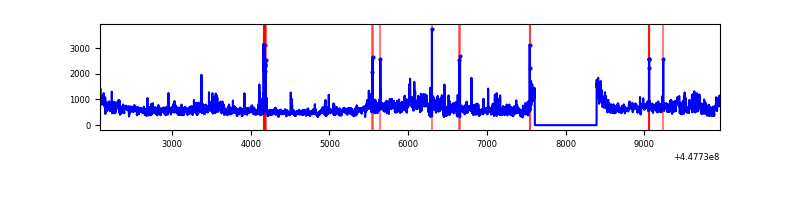 |
| D | 7877 | 7092 | 143 | 143 | 1.82% | 2.02% | 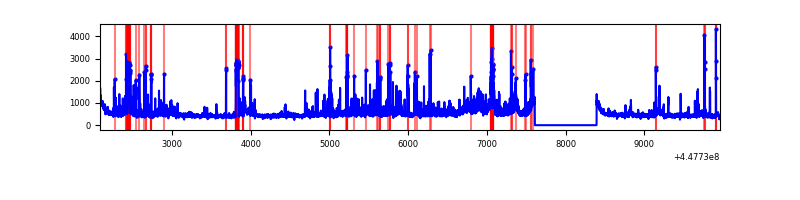 |
Top three noisy pixels from each quadrant. If the there are fewer than three noisy pixels in the level2.evt file, extra rows are filled as -1
| Pixel properties | Quadrant properties | ||||||
|---|---|---|---|---|---|---|---|
| Quadrant | DetID | PixID | Counts | Sigma | Mean | Median | Sigma |
| A | 10 | 83 | 2950749 | 17832.25 | 791 | 775 | 165.4 |
| A | 2 | 79 | 40750 | 241.64 | 791 | 775 | 165.4 |
| A | 13 | 248 | 24571 | 143.84 | 791 | 775 | 165.4 |
| B | 5 | 255 | 502685 | 3155.63 | 795 | 767 | 159.1 |
| B | 5 | 172 | 89842 | 560.03 | 795 | 767 | 159.1 |
| B | 3 | 112 | 58740 | 364.48 | 795 | 767 | 159.1 |
| C | 9 | 54 | 1424159 | 7678.16 | 782 | 785 | 185.4 |
| C | 14 | 254 | 119595 | 640.9 | 782 | 785 | 185.4 |
| C | 8 | 111 | 41891 | 221.74 | 782 | 785 | 185.4 |
| D | 1 | 52 | 475937 | 2399.5 | 775 | 749 | 198.0 |
| D | 11 | 241 | 407970 | 2056.29 | 775 | 749 | 198.0 |
| D | 13 | 249 | 167221 | 840.61 | 775 | 749 | 198.0 |
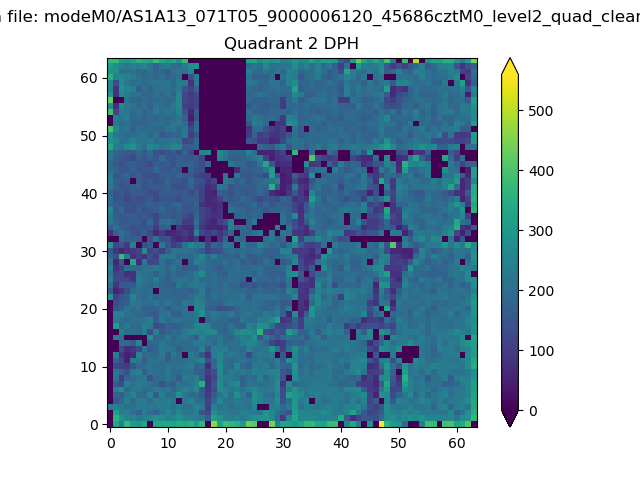
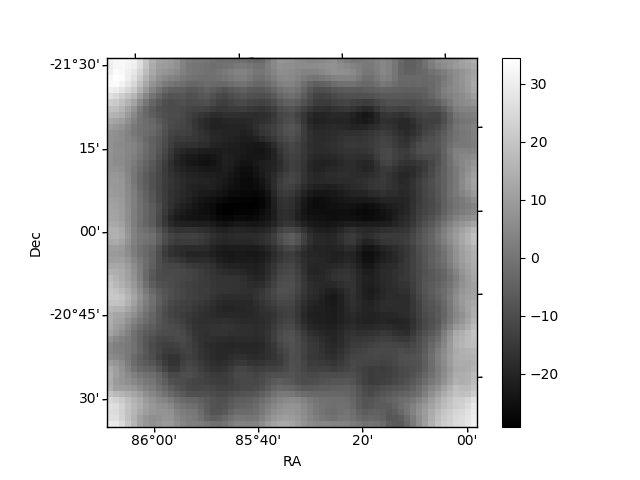
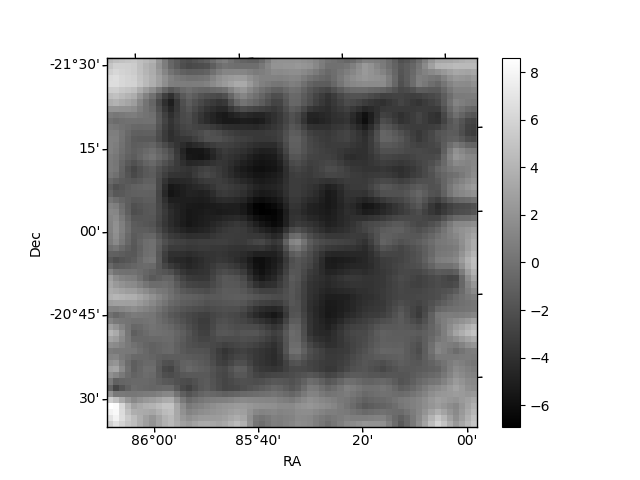
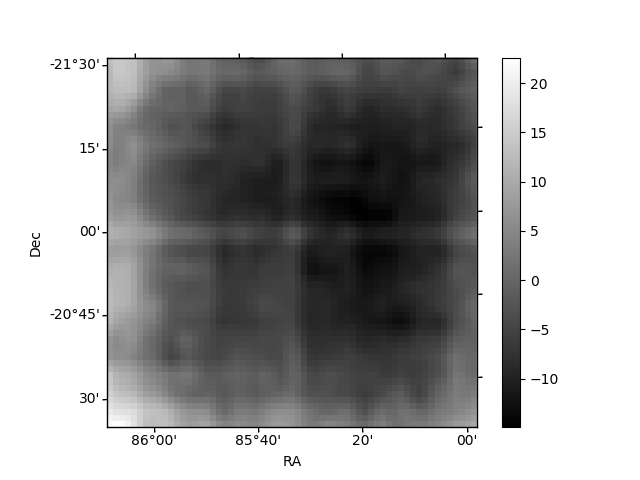
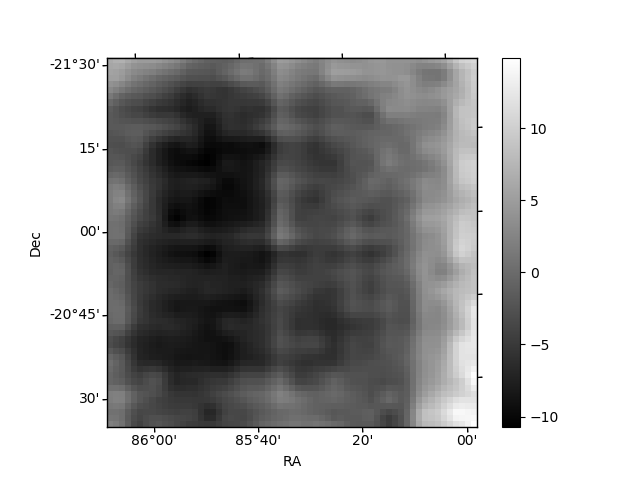
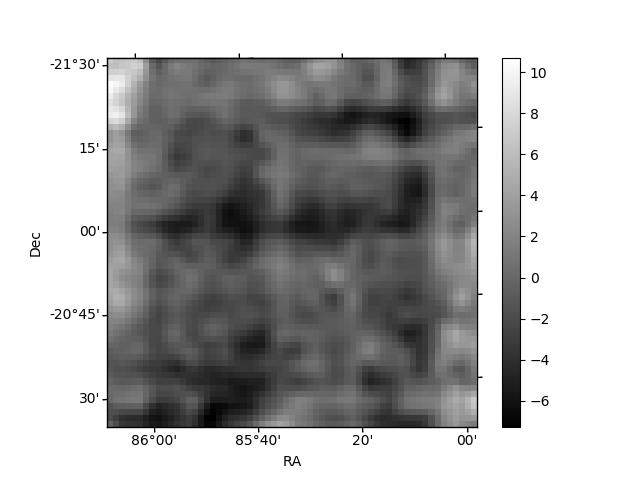
Histogram calculated using DETX and DETY for each event in the final _common_clean file
| Quadrant A | 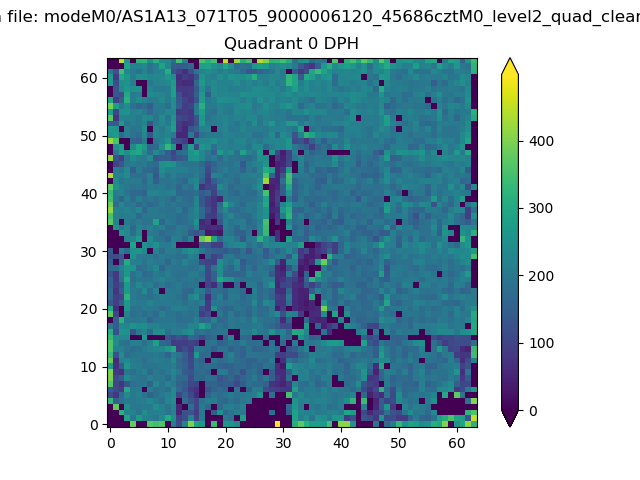 |
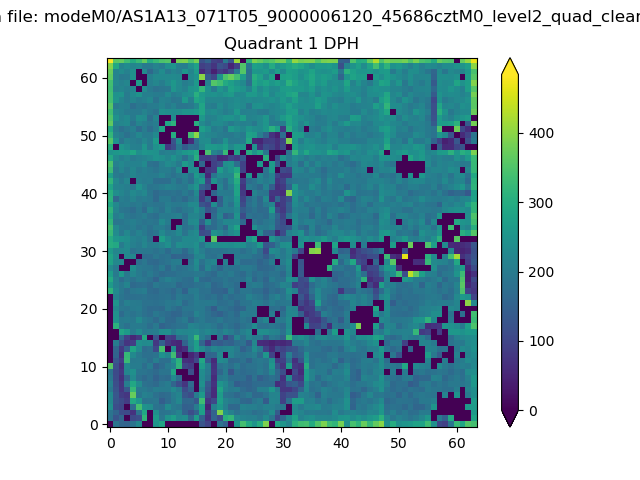 |
Quadrant B |
|---|---|---|---|
| Quadrant D | 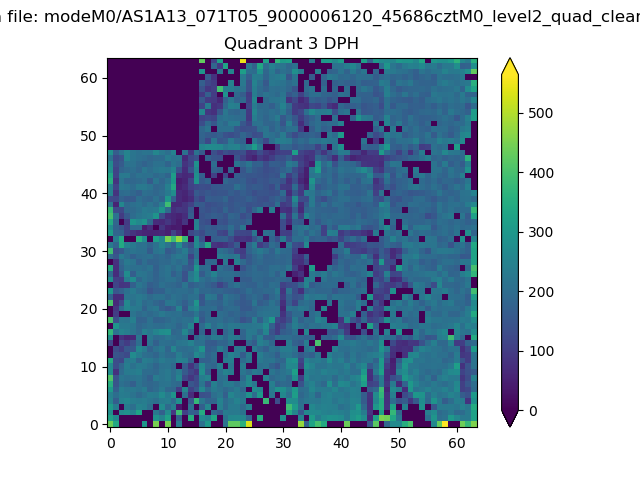 |
 |
Quadrant C |
| Plot type | Count rate plots | Images |
|---|---|---|
| Comparison with Poisson distribution Blue bars denote a histogram of data divided into 1 sec bins. Red curve is a Poisson curve with rate = median count rate of data. |
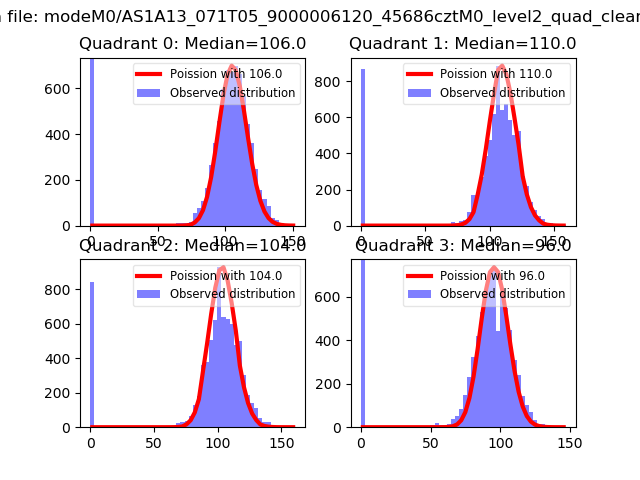 |
 |
| Quadrant-wise count rates Data is divided into 100 sec bins |
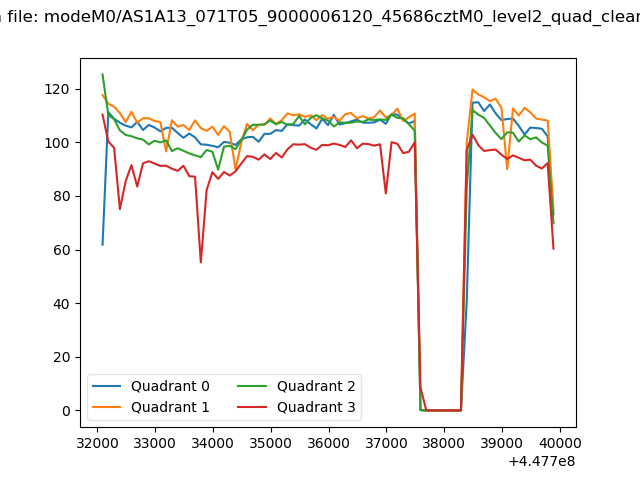 |
|
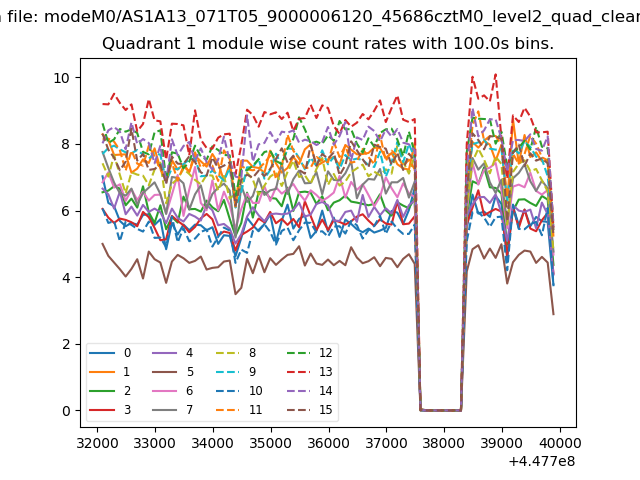
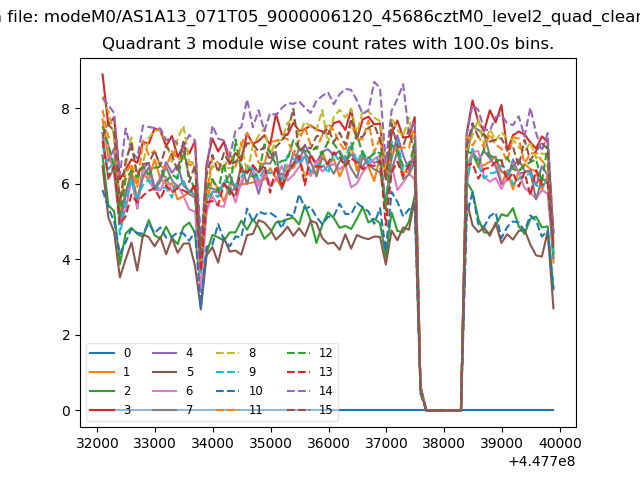
| Module-wise count rates for Quadrant A Data is divided into 100 sec bins |
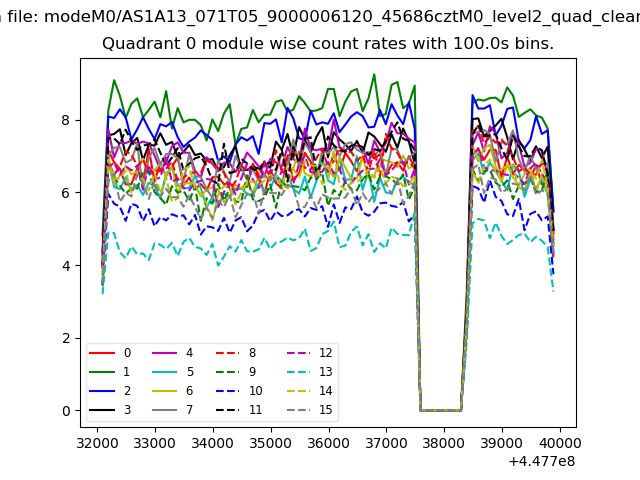 |
 |
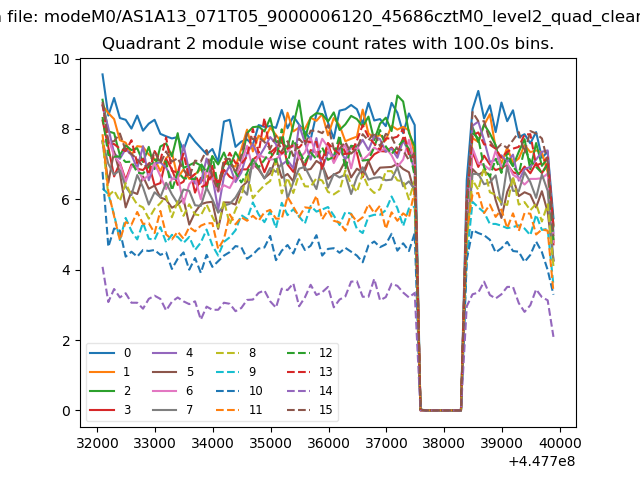
| Module-wise count rates for Quadrant B Data is divided into 100 sec bins |
 |
 |
| Module-wise count rates for Quadrant C Data is divided into 100 sec bins |
 |
 |
| Module-wise count rates for Quadrant D Data is divided into 100 sec bins |
 |
 |
| Parameter | Plot |
|---|---|
| CZT HV Monitor | 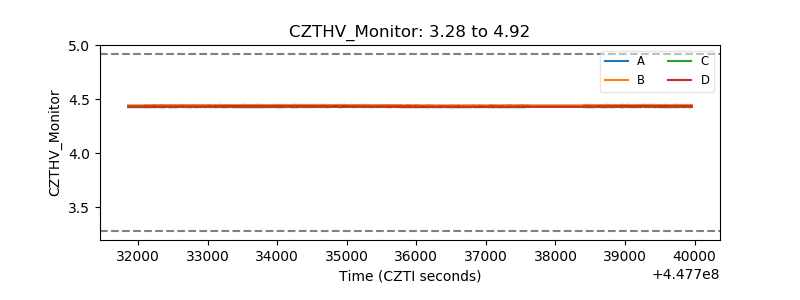 |
| D_VDD | 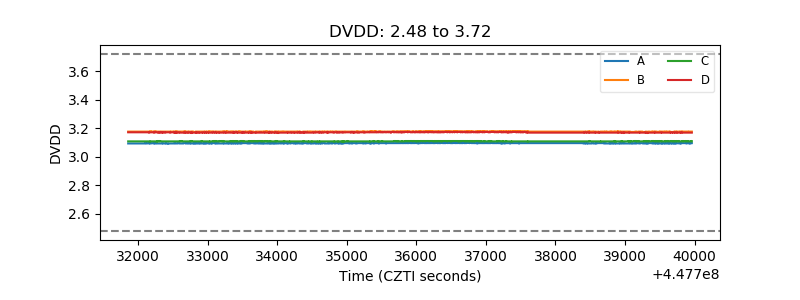 |
| Temperature 1 | 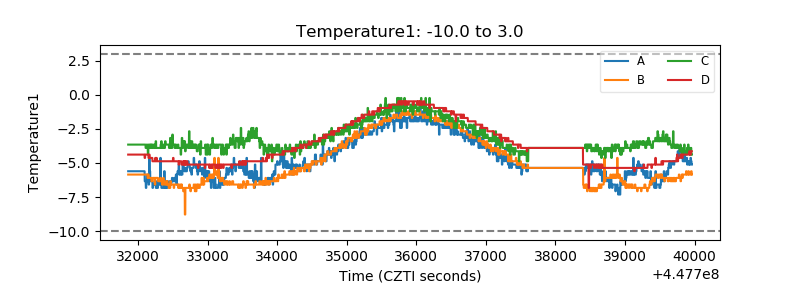 |
| Veto HV Monitor | 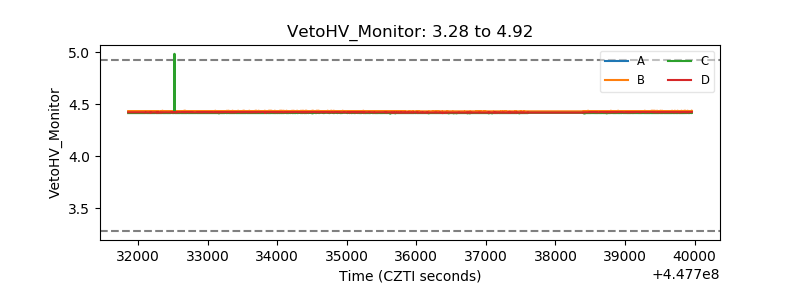 |
| Veto LLD | 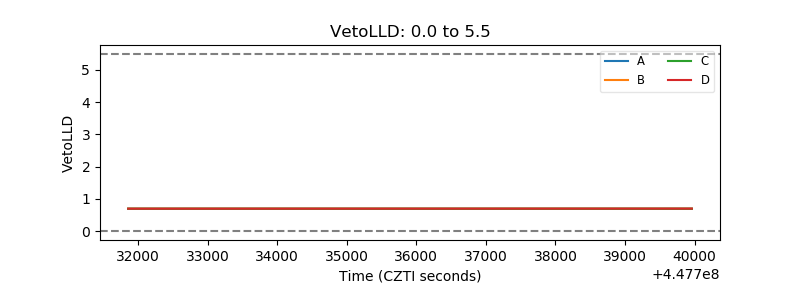 |
| Alpha Counter | 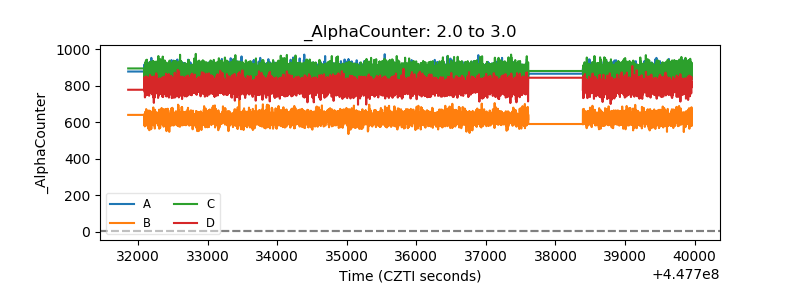 |
| _CPM_Rate | 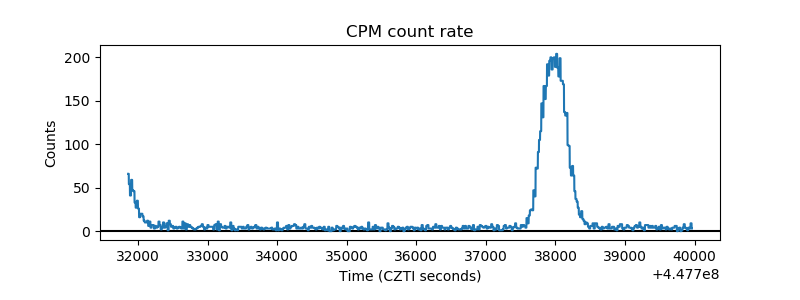 |
| CZT Counter | 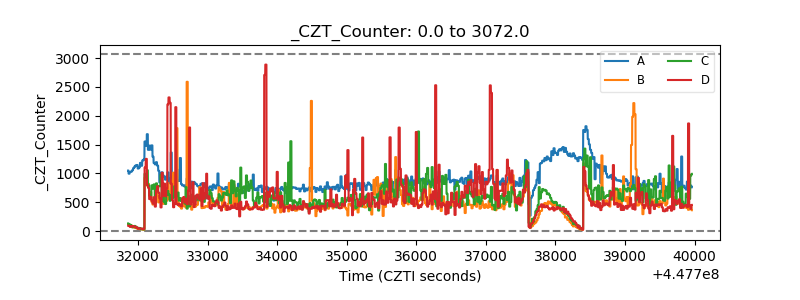 |
| +2.5 Volts monitor | 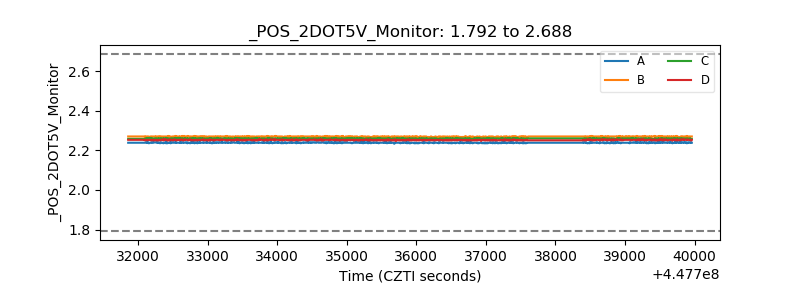 |
| +5 Volts monitor | 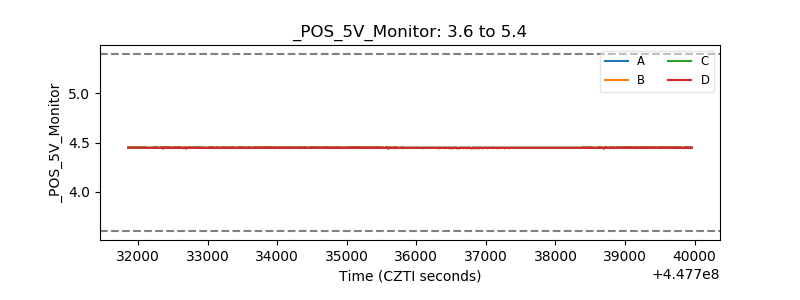 |
| _ROLL_ROT | 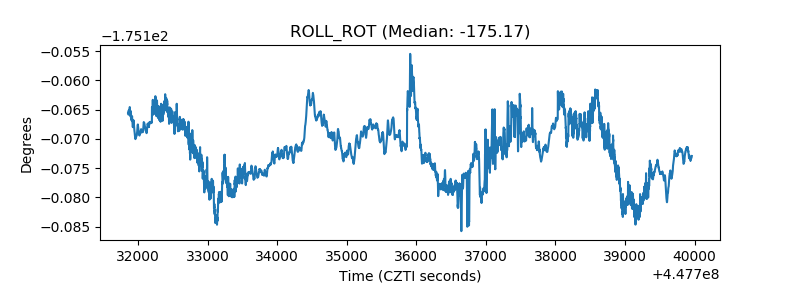 |
| _Roll_DEC | 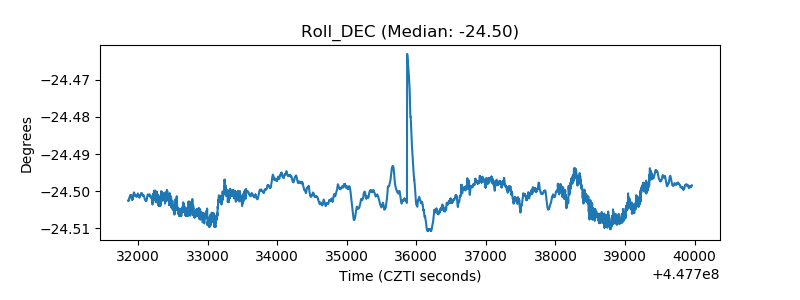 |
| _Roll_RA | 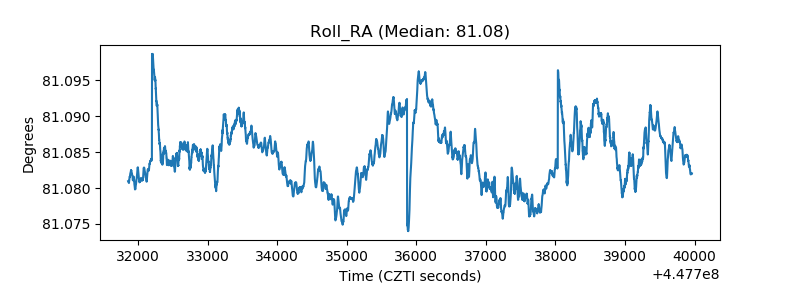 |
| Veto Counter | 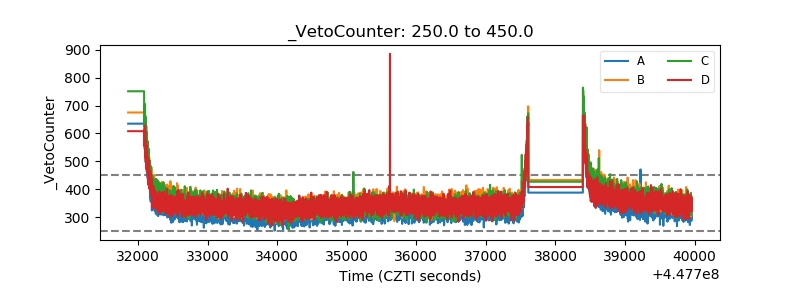 |