| Param | Original file | Final file |
|---|---|---|
| Filename | modeM0/AS1A13_071T05_9000006120_45687cztM0_level2.fits | modeM0/AS1A13_071T05_9000006120_45687cztM0_level2_quad_clean.evt |
| Size (bytes) | 564,704,640 | 97,295,040 |
| Size | 538.5 MB | 92.8 MB |
| Events in quadrant A | 5,442,639 | 672,499 |
| Events in quadrant B | 3,294,740 | 701,553 |
| Events in quadrant C | 6,296,497 | 564,364 |
| Events in quadrant D | 5,377,849 | 565,588 |
| Mode M0 | |||
|---|---|---|---|
| Quadrant | BADHDUFLAG | Total packets | Discarded packets |
| A | 0 | 20009 | 1 |
| B | 0 | 14017 | 1 |
| C | 0 | 23236 | 5 |
| D | 0 | 20344 | 1 |
| Mode M9 | |||
|---|---|---|---|
| Quadrant | BADHDUFLAG | Total packets | Discarded packets |
| A | 0 | 10 | 0 |
| B | 0 | 10 | 0 |
| C | 0 | 10 | 0 |
| D | 0 | 10 | 0 |
| Mode SS | |||
|---|---|---|---|
| Quadrant | BADHDUFLAG | Total packets | Discarded packets |
| A | 0 | 126 | 0 |
| B | 0 | 126 | 0 |
| C | 0 | 126 | 0 |
| D | 0 | 126 | 0 |
| Quadrant | Total seconds | Saturated seconds | Saturation percentage |
|---|---|---|---|
| A | 6340 | 149 | 2.350158% |
| B | 6341 | 138 | 2.176313% |
| C | 6340 | 1163 | 18.343849% |
| D | 6340 | 711 | 11.214511% |
Noise dominated data is calculated using 1-second bins in cleaned event files. If a bin has >2000 counts, and if more than 50% of those come from <1% of pixels, then it is considered to be noise-dominated and hence unusable.
| Quadrant | # 1 sec bins | Bins with >0 counts | Bins with >2000 counts | High rate bins dominated by noise | Noise dominated (total time) | Noise dominated (detector-on time) | Marked lightcurve |
|---|---|---|---|---|---|---|---|
| A | 7270 | 6340 | 2 | 2 | 0.03% | 0.03% | 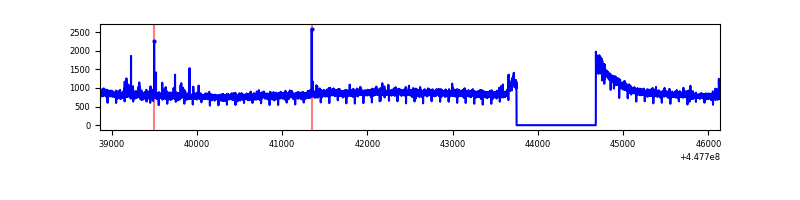 |
| B | 7271 | 6341 | 25 | 25 | 0.34% | 0.39% | 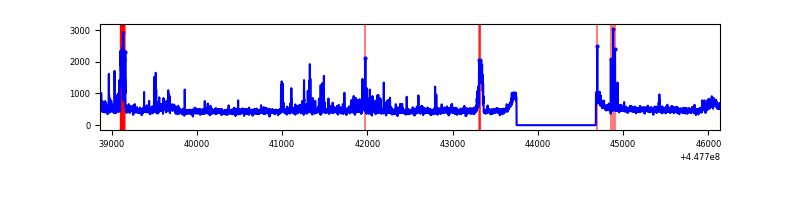 |
| C | 7270 | 6340 | 937 | 937 | 12.89% | 14.78% | 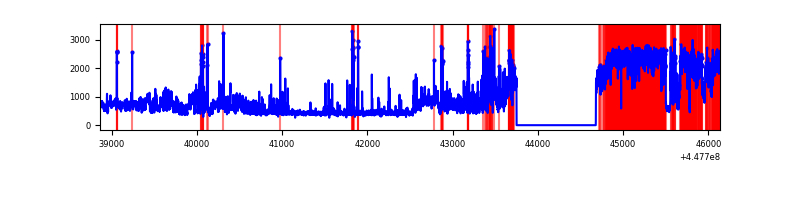 |
| D | 7270 | 6340 | 578 | 578 | 7.95% | 9.12% | 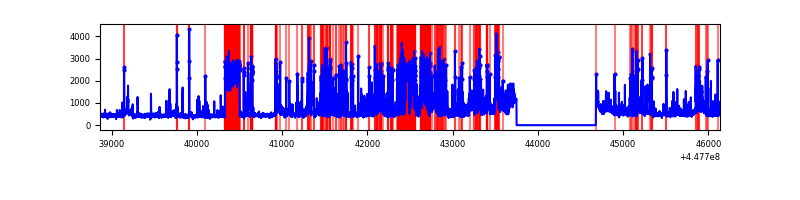 |
Top three noisy pixels from each quadrant. If the there are fewer than three noisy pixels in the level2.evt file, extra rows are filled as -1
| Pixel properties | Quadrant properties | ||||||
|---|---|---|---|---|---|---|---|
| Quadrant | DetID | PixID | Counts | Sigma | Mean | Median | Sigma |
| A | 10 | 83 | 2613649 | 17508.14 | 715 | 699 | 149.2 |
| A | 13 | 248 | 29633 | 193.87 | 715 | 699 | 149.2 |
| A | 14 | 235 | 14918 | 95.27 | 715 | 699 | 149.2 |
| B | 5 | 255 | 178816 | 1258.83 | 716 | 694 | 141.5 |
| B | 5 | 172 | 78625 | 550.76 | 716 | 694 | 141.5 |
| B | 12 | 18 | 68208 | 477.14 | 716 | 694 | 141.5 |
| C | 9 | 54 | 3412378 | 21846.68 | 662 | 665 | 156.2 |
| C | 14 | 254 | 241564 | 1542.58 | 662 | 665 | 156.2 |
| C | 3 | 233 | 29466 | 184.43 | 662 | 665 | 156.2 |
| D | 1 | 52 | 1603562 | 9219.03 | 680 | 657 | 173.9 |
| D | 2 | 249 | 792377 | 4553.54 | 680 | 657 | 173.9 |
| D | 11 | 241 | 120292 | 688.08 | 680 | 657 | 173.9 |
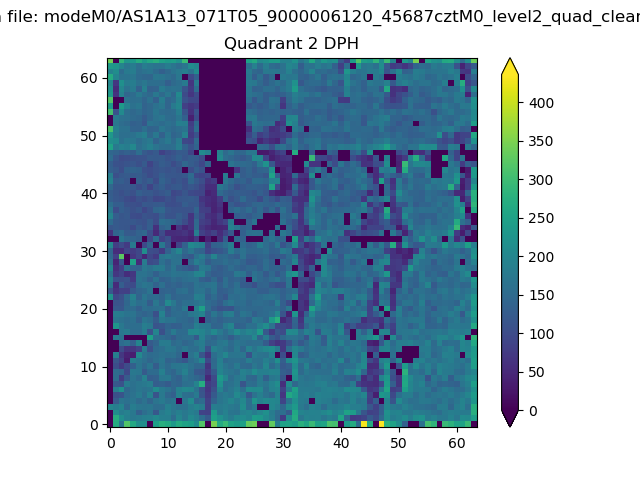
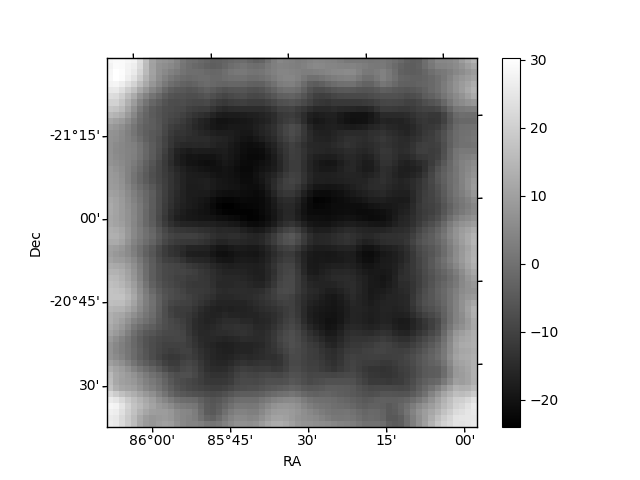
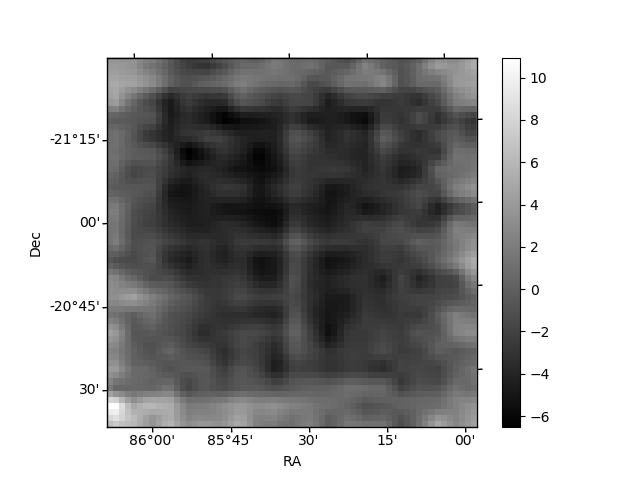
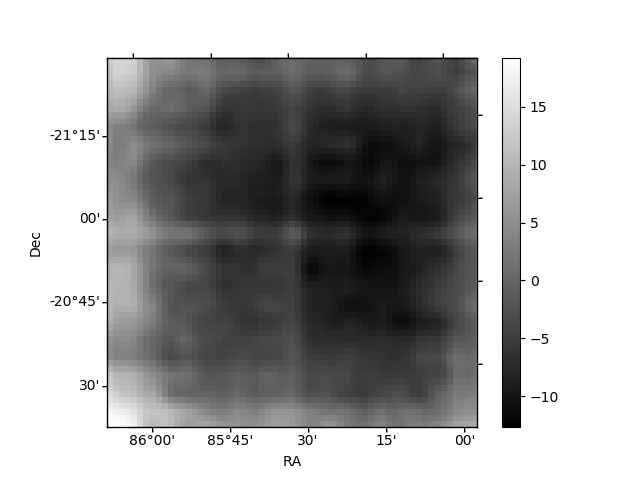
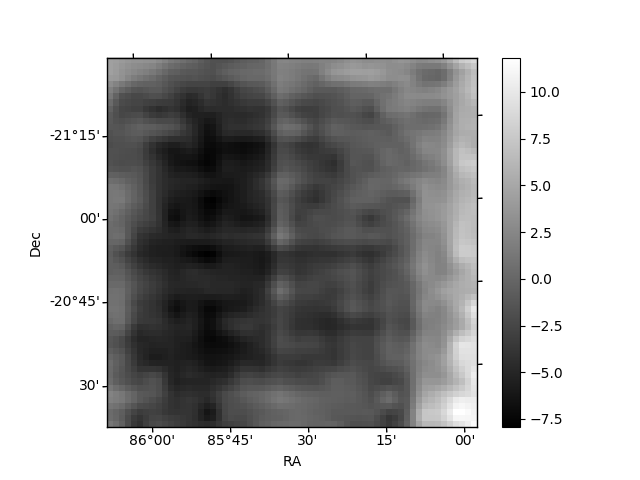
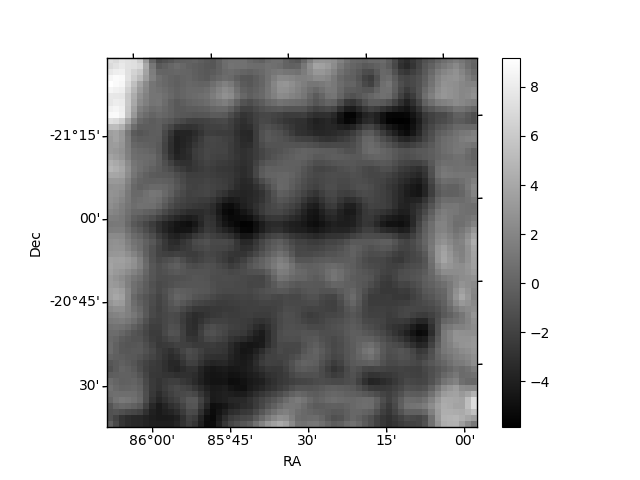
Histogram calculated using DETX and DETY for each event in the final _common_clean file
| Quadrant A | 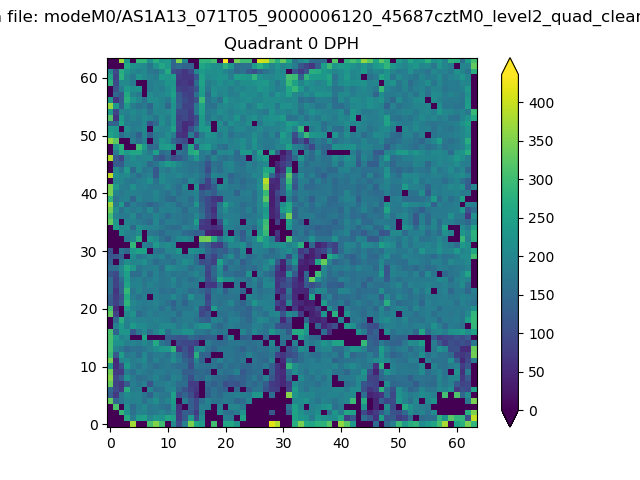 |
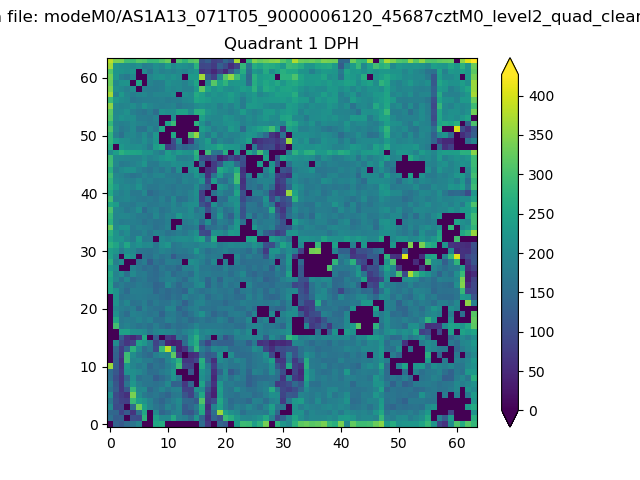 |
Quadrant B |
|---|---|---|---|
| Quadrant D | 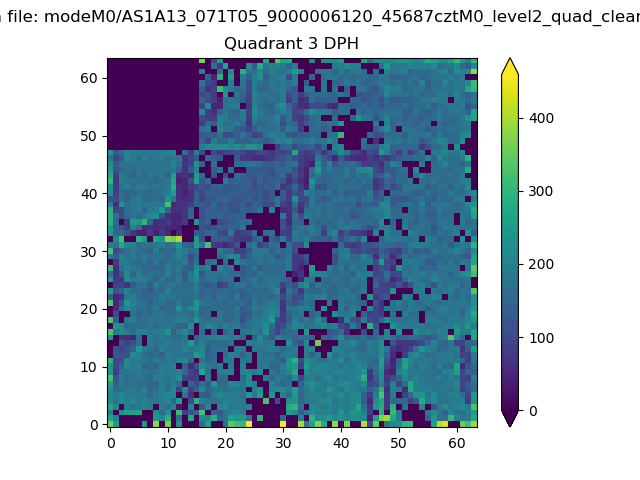 |
 |
Quadrant C |
| Plot type | Count rate plots | Images |
|---|---|---|
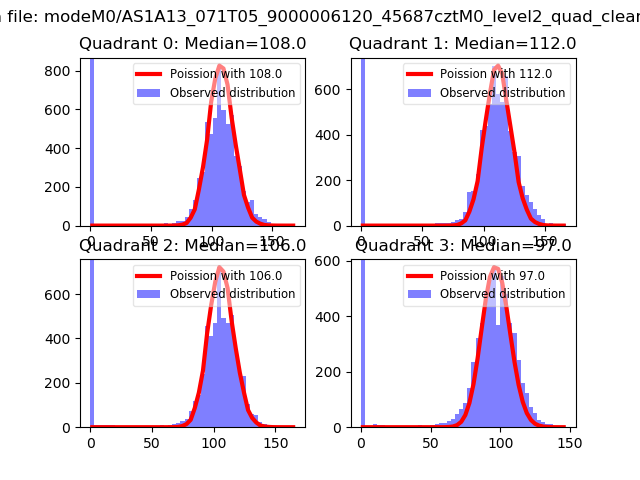
| Comparison with Poisson distribution Blue bars denote a histogram of data divided into 1 sec bins. Red curve is a Poisson curve with rate = median count rate of data. |
 |
 |
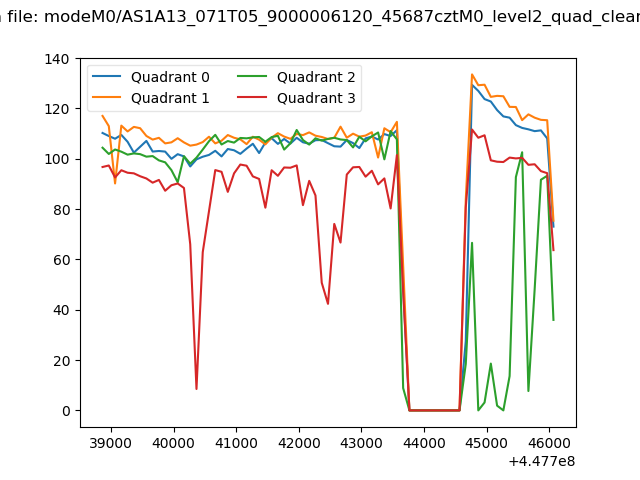
| Quadrant-wise count rates Data is divided into 100 sec bins |
 |
|
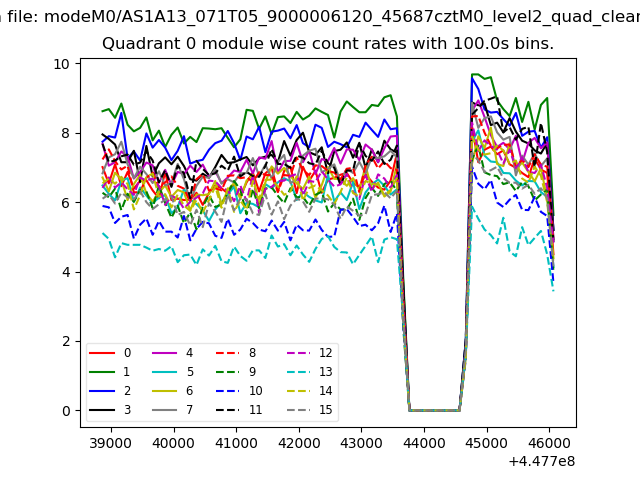
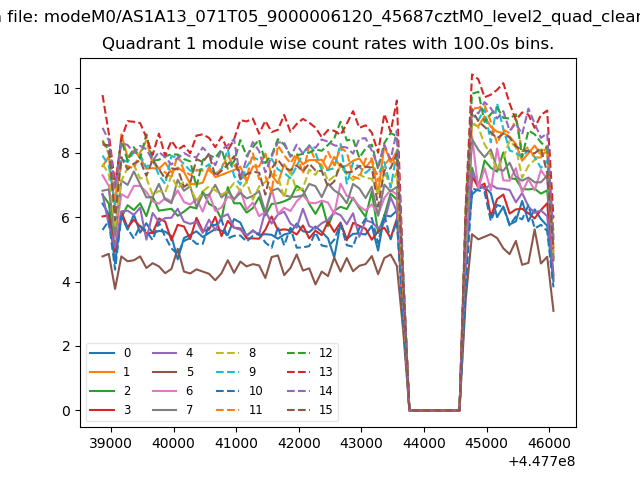
| Module-wise count rates for Quadrant A Data is divided into 100 sec bins |
 |
 |
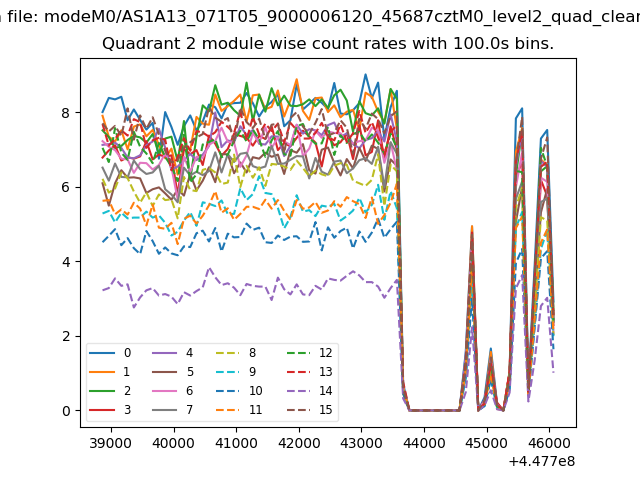
| Module-wise count rates for Quadrant B Data is divided into 100 sec bins |
 |
 |
| Module-wise count rates for Quadrant C Data is divided into 100 sec bins |
 |
 |
| Module-wise count rates for Quadrant D Data is divided into 100 sec bins |
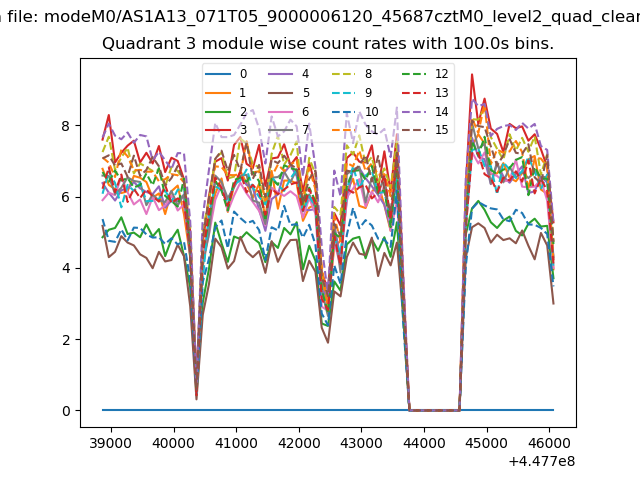 |
 |
| Parameter | Plot |
|---|---|
| CZT HV Monitor | 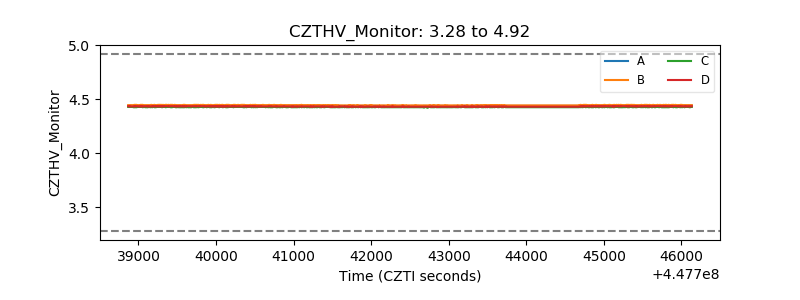 |
| D_VDD | 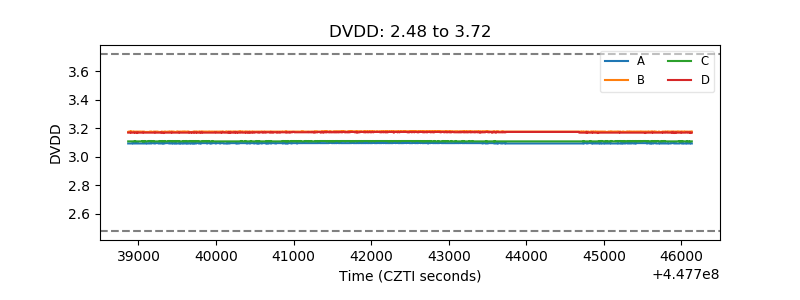 |
| Temperature 1 | 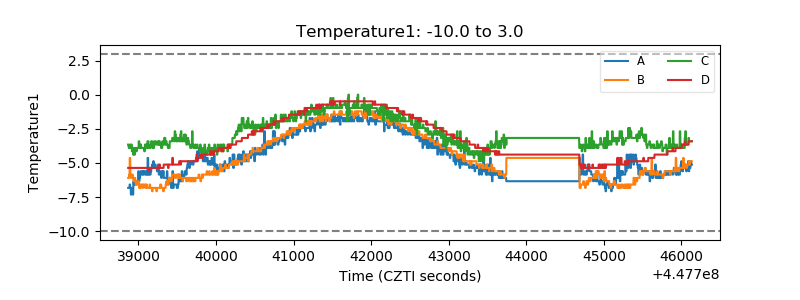 |
| Veto HV Monitor | 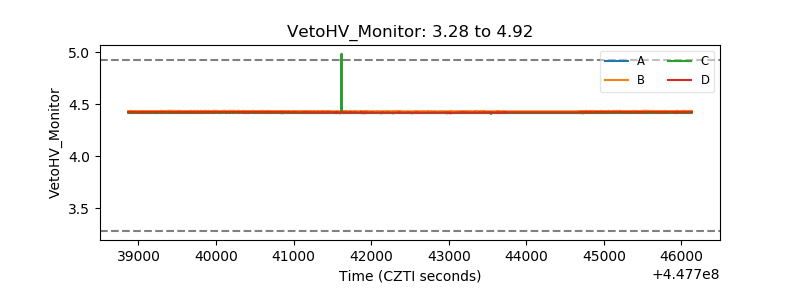 |
| Veto LLD | 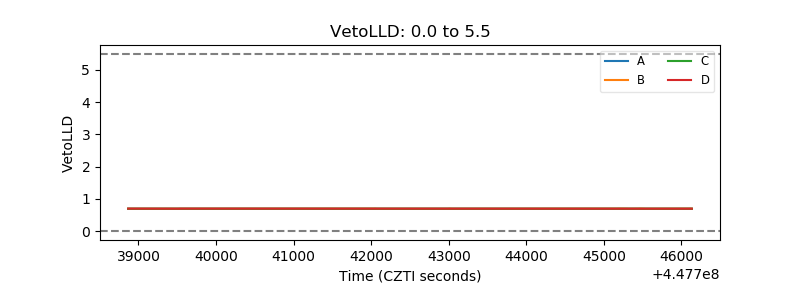 |
| Alpha Counter | 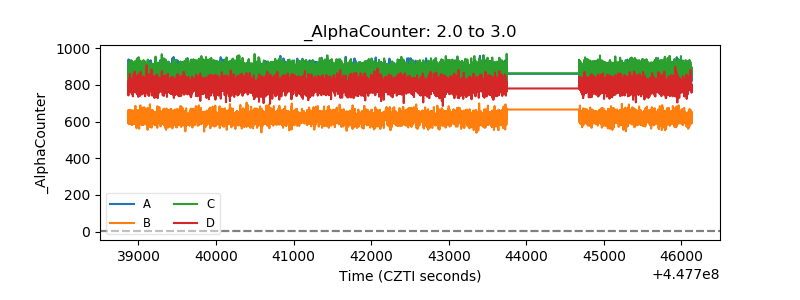 |
| _CPM_Rate | 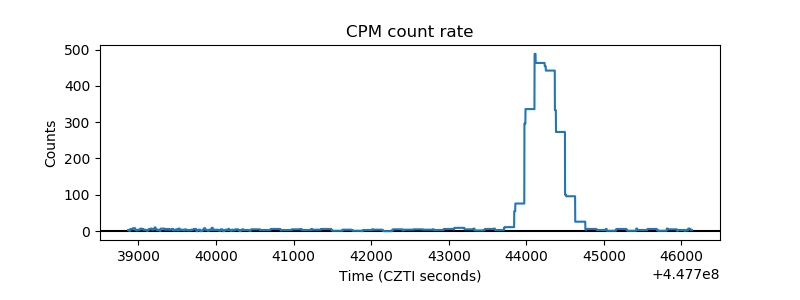 |
| CZT Counter | 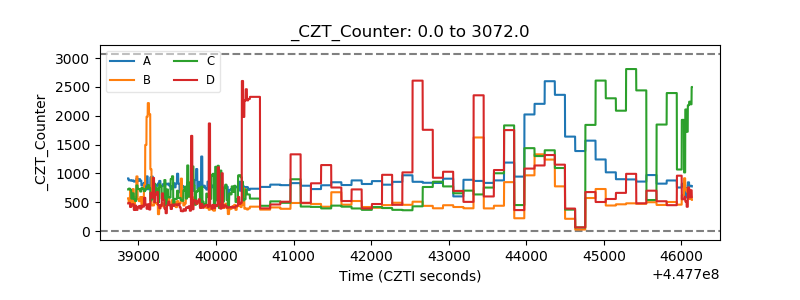 |
| +2.5 Volts monitor |  |
| +5 Volts monitor | 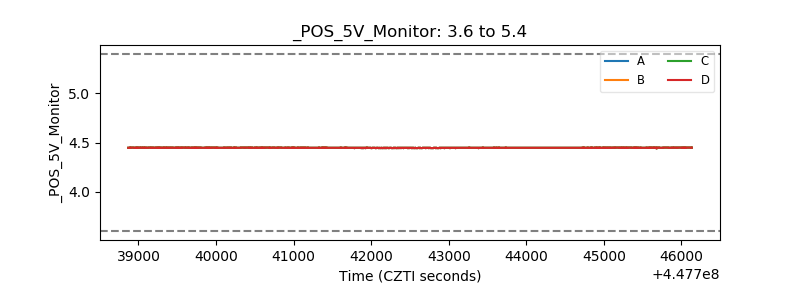 |
| _ROLL_ROT | 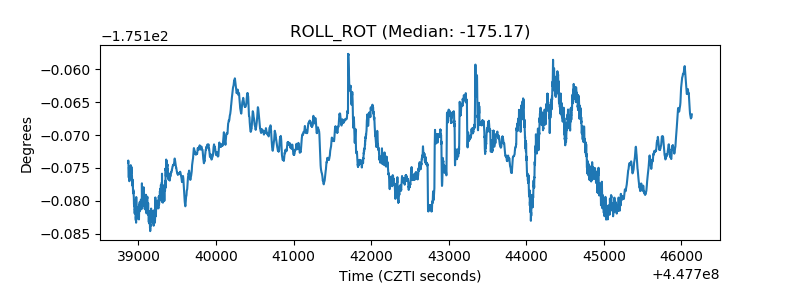 |
| _Roll_DEC | 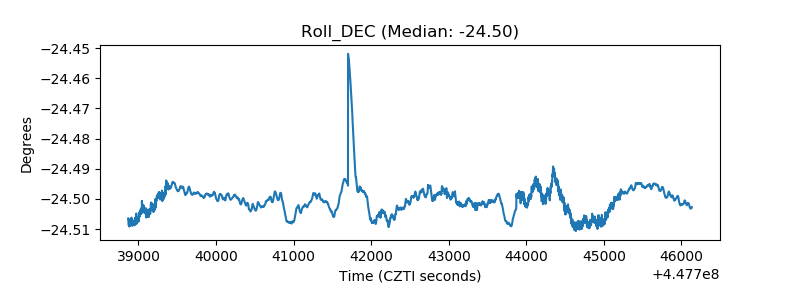 |
| _Roll_RA | 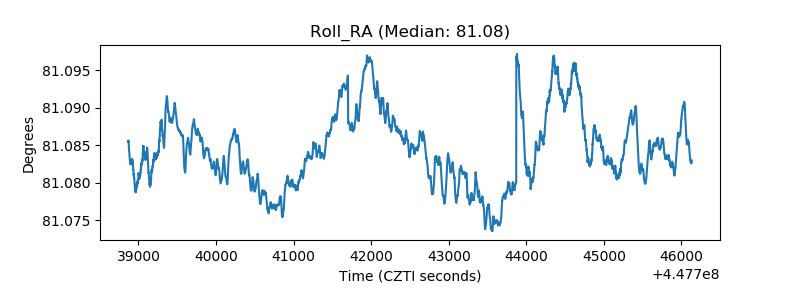 |
| Veto Counter | 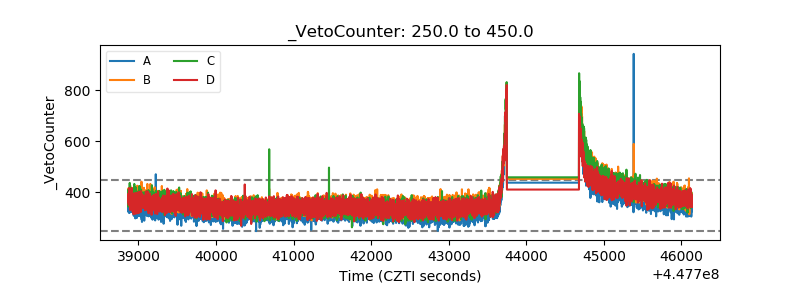 |