| Param | Original file | Final file |
|---|---|---|
| Filename | modeM0/AS1A13_071T05_9000006120_45689cztM0_level2.fits | modeM0/AS1A13_071T05_9000006120_45689cztM0_level2_quad_clean.evt |
| Size (bytes) | 752,489,280 | 95,172,480 |
| Size | 717.6 MB | 90.8 MB |
| Events in quadrant A | 5,883,765 | 735,644 |
| Events in quadrant B | 3,260,590 | 770,823 |
| Events in quadrant C | 13,820,178 | 250,156 |
| Events in quadrant D | 4,378,578 | 665,012 |
| Mode M0 | |||
|---|---|---|---|
| Quadrant | BADHDUFLAG | Total packets | Discarded packets |
| A | 0 | 21523 | 2 |
| B | 0 | 13961 | 2 |
| C | 0 | 45584 | 2 |
| D | 0 | 17332 | 2 |
| Mode M9 | |||
|---|---|---|---|
| Quadrant | BADHDUFLAG | Total packets | Discarded packets |
| A | 0 | 17 | 0 |
| B | 0 | 18 | 0 |
| C | 0 | 18 | 0 |
| D | 0 | 18 | 0 |
| Mode SS | |||
|---|---|---|---|
| Quadrant | BADHDUFLAG | Total packets | Discarded packets |
| A | 0 | 134 | 0 |
| B | 0 | 134 | 0 |
| C | 0 | 134 | 0 |
| D | 0 | 134 | 0 |
| Quadrant | Total seconds | Saturated seconds | Saturation percentage |
|---|---|---|---|
| A | 6596 | 237 | 3.593087% |
| B | 6596 | 115 | 1.743481% |
| C | 6596 | 4642 | 70.375985% |
| D | 6596 | 256 | 3.881140% |
Noise dominated data is calculated using 1-second bins in cleaned event files. If a bin has >2000 counts, and if more than 50% of those come from <1% of pixels, then it is considered to be noise-dominated and hence unusable.
| Quadrant | # 1 sec bins | Bins with >0 counts | Bins with >2000 counts | High rate bins dominated by noise | Noise dominated (total time) | Noise dominated (detector-on time) | Marked lightcurve |
|---|---|---|---|---|---|---|---|
| A | 7676 | 6596 | 2 | 2 | 0.03% | 0.03% |  |
| B | 7676 | 6596 | 12 | 12 | 0.16% | 0.18% | 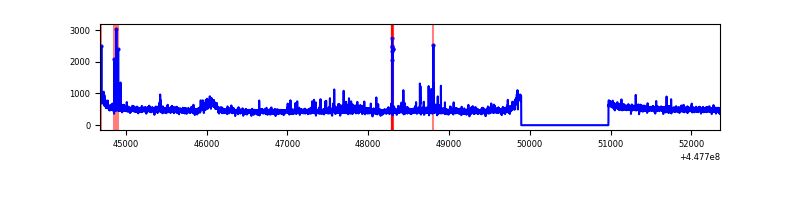 |
| C | 7676 | 6596 | 4407 | 4407 | 57.41% | 66.81% | 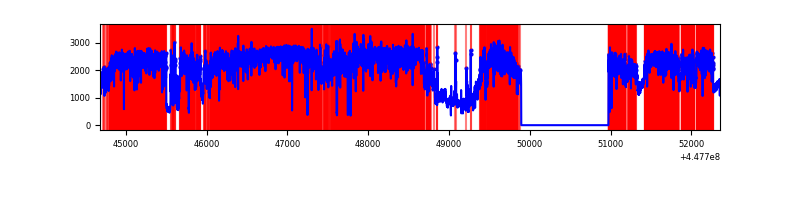 |
| D | 7676 | 6596 | 124 | 124 | 1.62% | 1.88% | 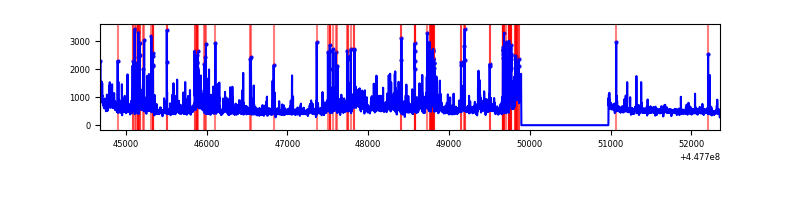 |
Top three noisy pixels from each quadrant. If the there are fewer than three noisy pixels in the level2.evt file, extra rows are filled as -1
| Pixel properties | Quadrant properties | ||||||
|---|---|---|---|---|---|---|---|
| Quadrant | DetID | PixID | Counts | Sigma | Mean | Median | Sigma |
| A | 10 | 83 | 2879735 | 17917.87 | 771 | 757 | 160.7 |
| A | 9 | 191 | 9793 | 56.24 | 771 | 757 | 160.7 |
| A | 13 | 254 | 9385 | 53.7 | 771 | 757 | 160.7 |
| B | 5 | 172 | 75908 | 499.0 | 774 | 751 | 150.6 |
| B | 3 | 112 | 40478 | 263.76 | 774 | 751 | 150.6 |
| B | 15 | 35 | 24833 | 159.89 | 774 | 751 | 150.6 |
| C | 9 | 54 | 11387170 | 81701.83 | 594 | 596 | 139.4 |
| C | 14 | 254 | 70754 | 503.4 | 594 | 596 | 139.4 |
| C | 3 | 233 | 34121 | 240.55 | 594 | 596 | 139.4 |
| D | 1 | 52 | 670954 | 3553.55 | 753 | 731 | 188.6 |
| D | 13 | 249 | 369501 | 1955.23 | 753 | 731 | 188.6 |
| D | 11 | 241 | 236968 | 1252.54 | 753 | 731 | 188.6 |
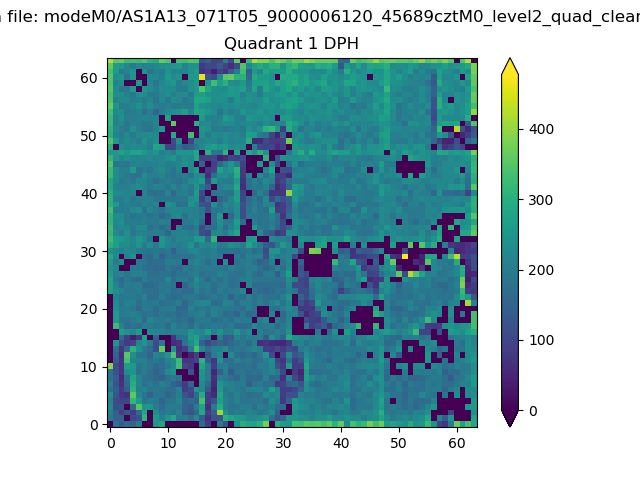
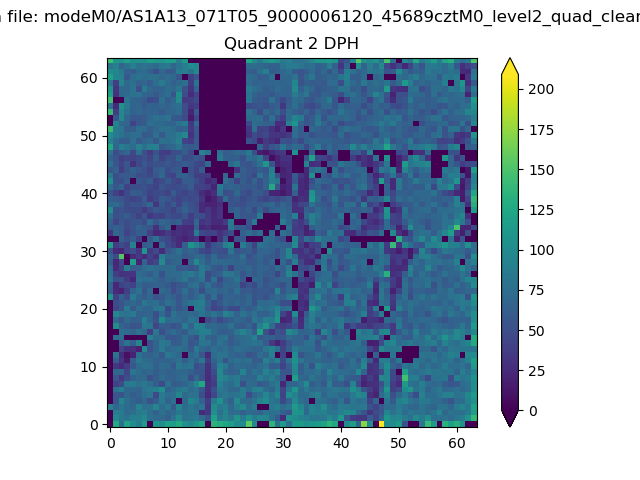
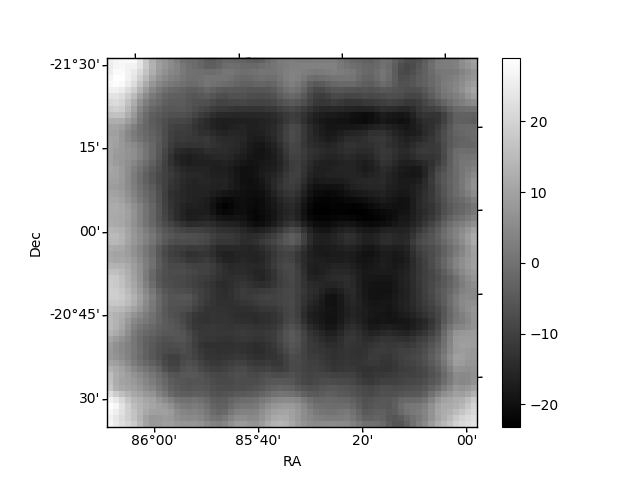
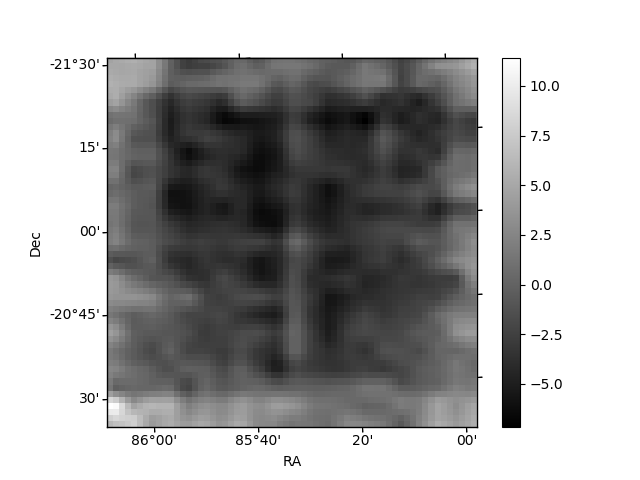
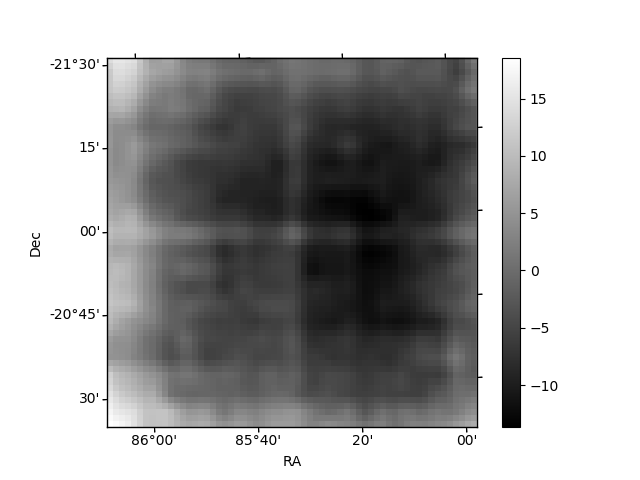
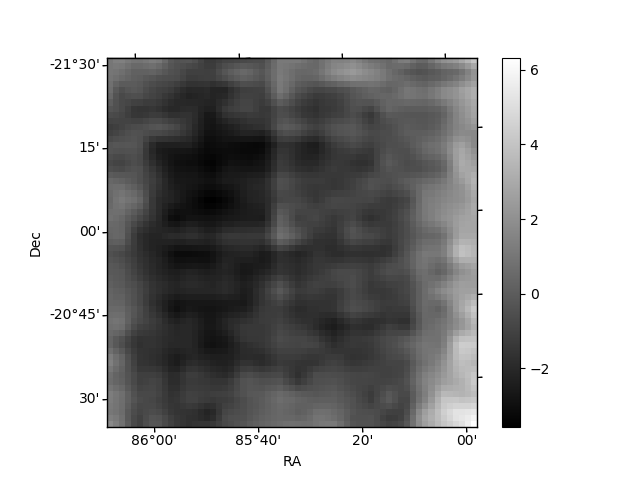
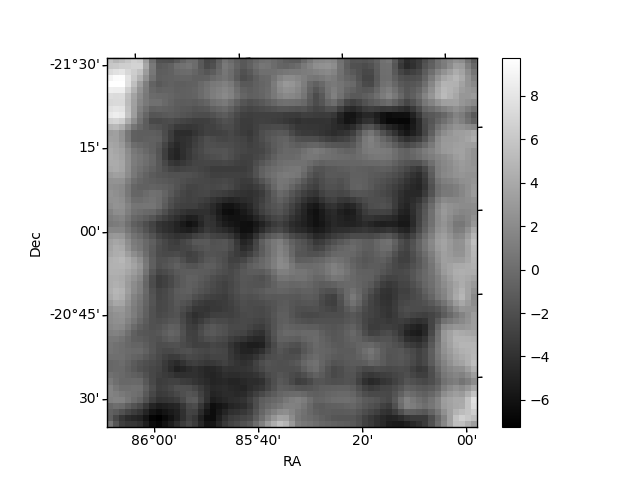
Histogram calculated using DETX and DETY for each event in the final _common_clean file
| Quadrant A | 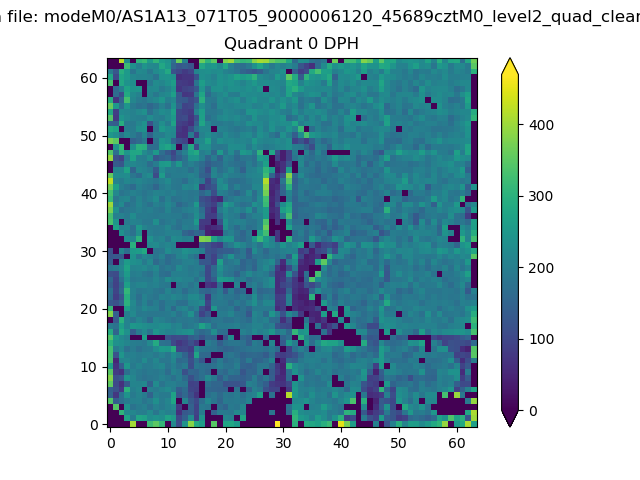 |
 |
Quadrant B |
|---|---|---|---|
| Quadrant D | 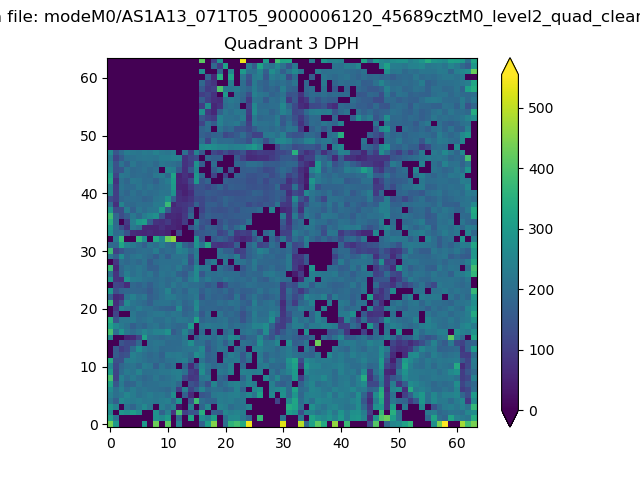 |
 |
Quadrant C |
| Plot type | Count rate plots | Images |
|---|---|---|
| Comparison with Poisson distribution Blue bars denote a histogram of data divided into 1 sec bins. Red curve is a Poisson curve with rate = median count rate of data. |
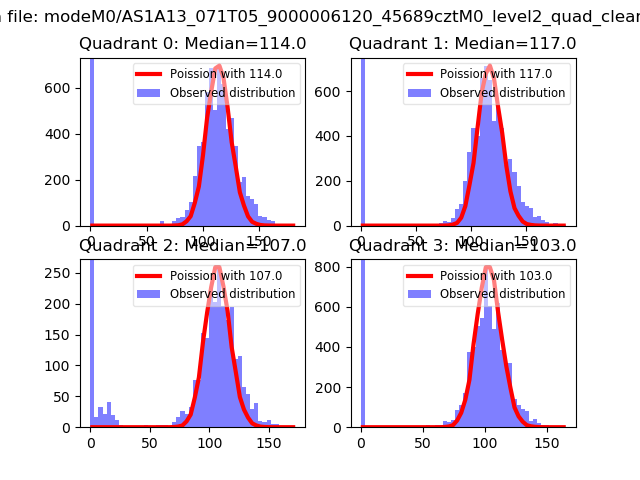 |
 |
| Quadrant-wise count rates Data is divided into 100 sec bins |
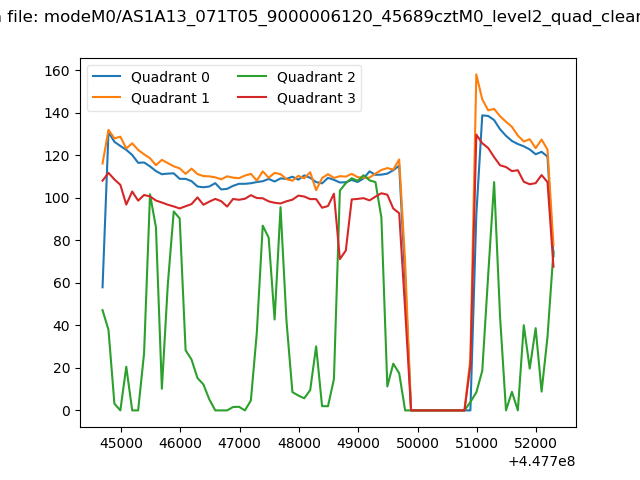 |
|
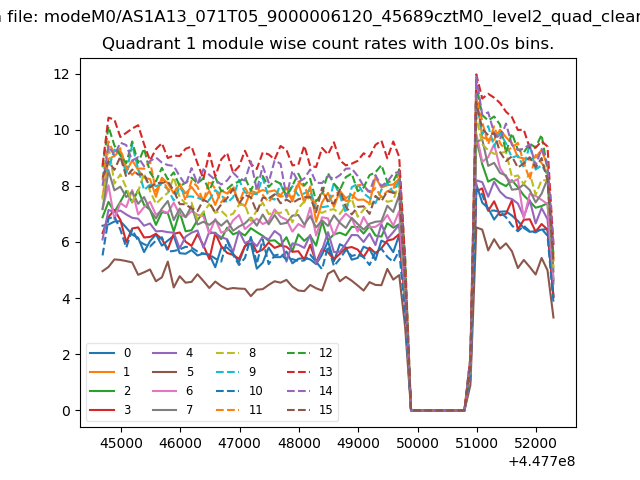
| Module-wise count rates for Quadrant A Data is divided into 100 sec bins |
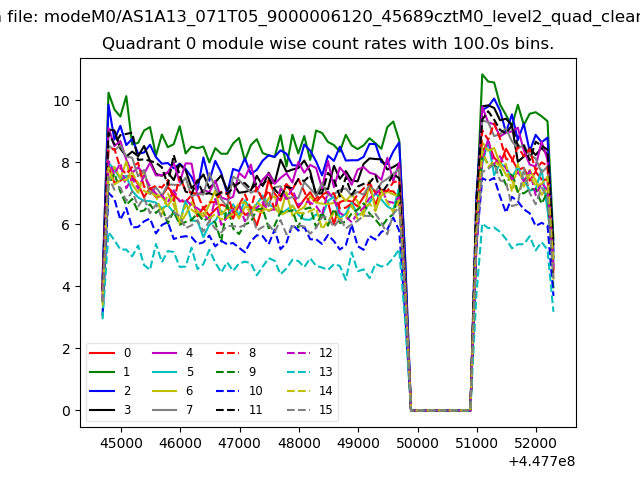 |
 |
| Module-wise count rates for Quadrant B Data is divided into 100 sec bins |
 |
 |
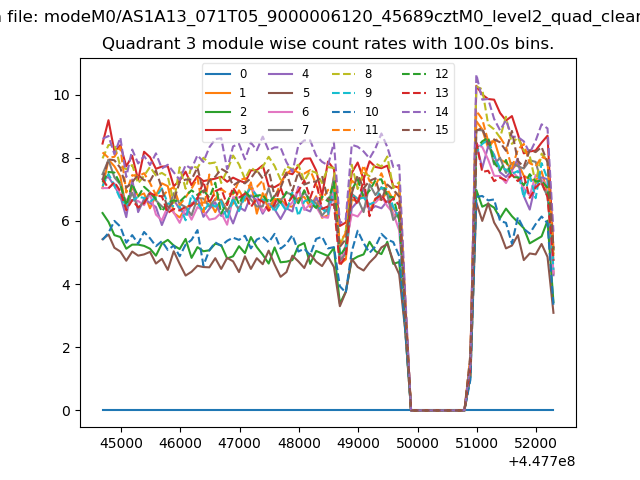
| Module-wise count rates for Quadrant C Data is divided into 100 sec bins |
 |
 |
| Module-wise count rates for Quadrant D Data is divided into 100 sec bins |
 |
 |
| Parameter | Plot |
|---|---|
| CZT HV Monitor |  |
| D_VDD | 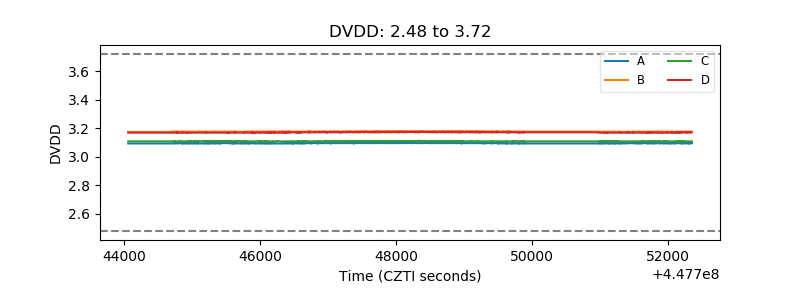 |
| Temperature 1 | 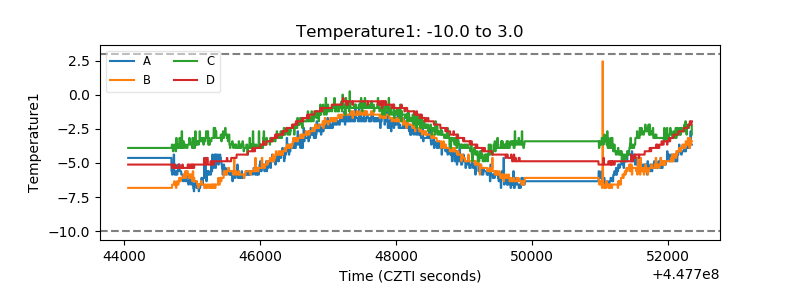 |
| Veto HV Monitor | 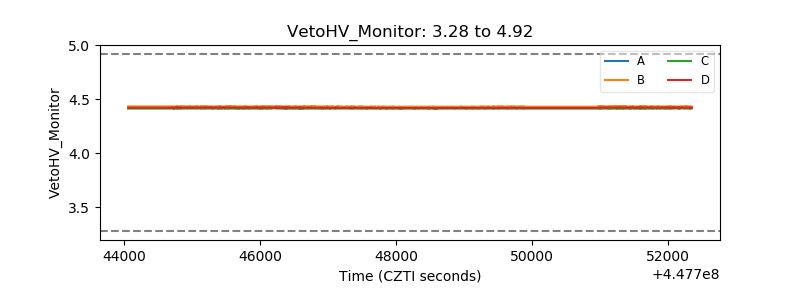 |
| Veto LLD | 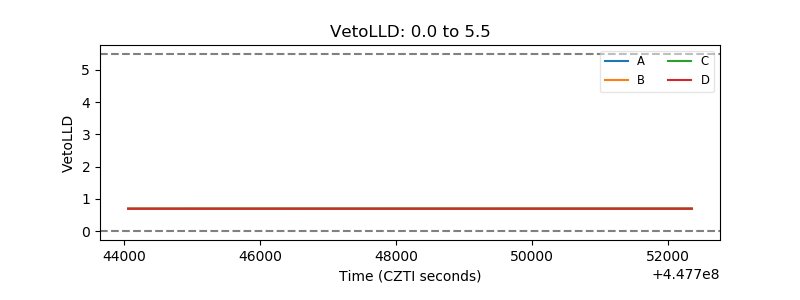 |
| Alpha Counter | 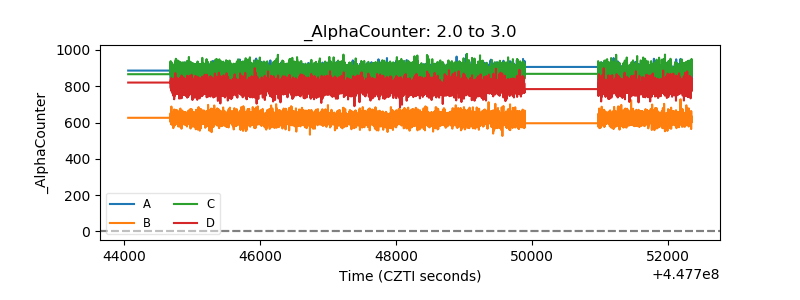 |
| _CPM_Rate | 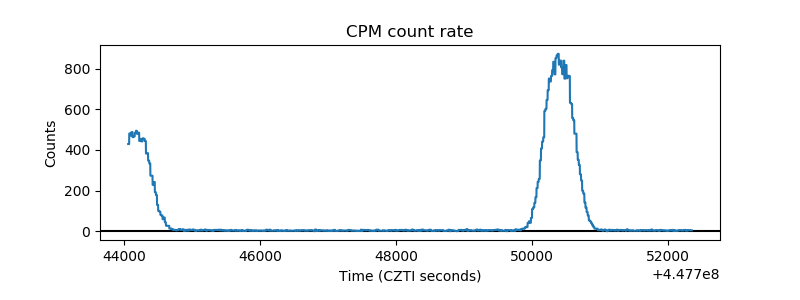 |
| CZT Counter | 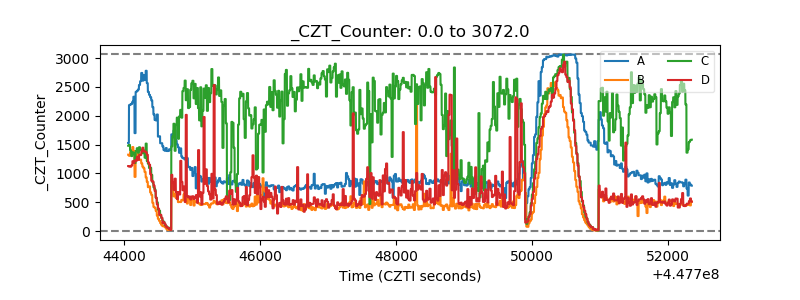 |
| +2.5 Volts monitor | 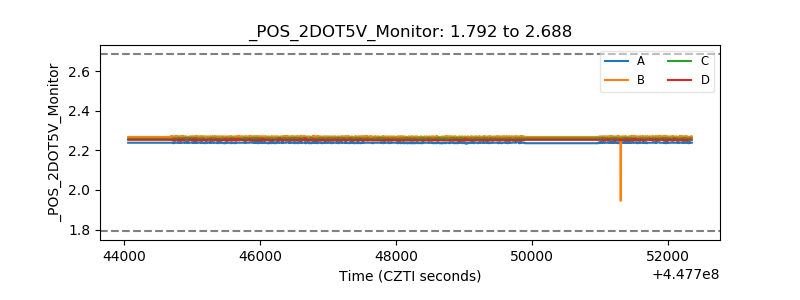 |
| +5 Volts monitor | 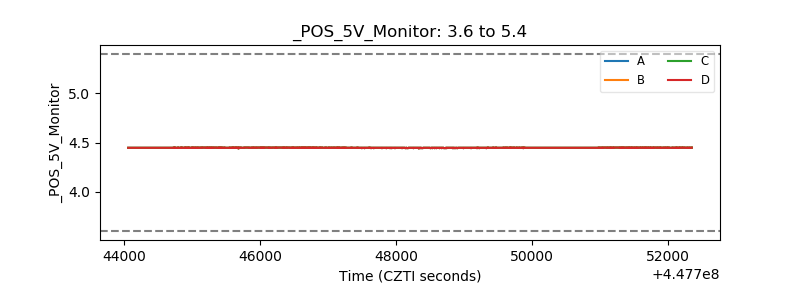 |
| _ROLL_ROT | 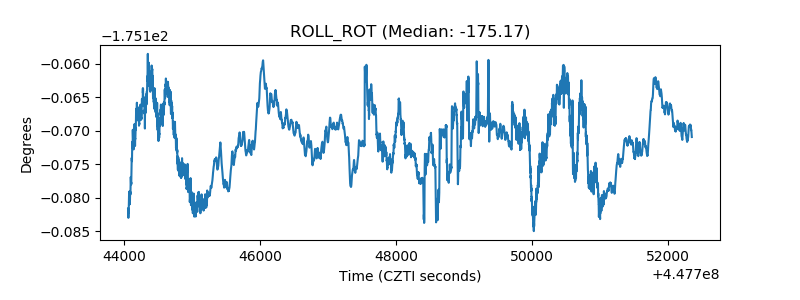 |
| _Roll_DEC | 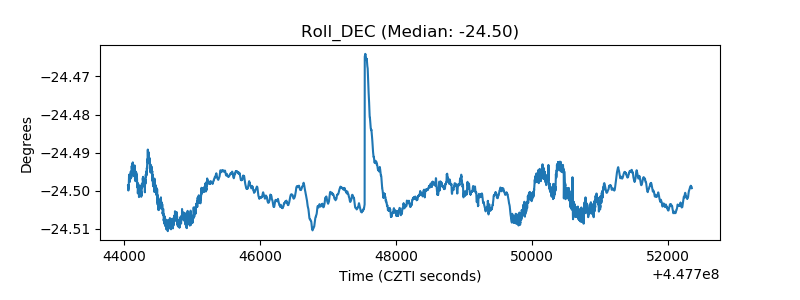 |
| _Roll_RA | 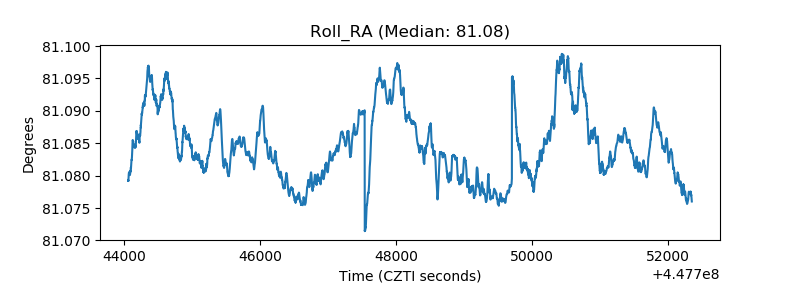 |
| Veto Counter | 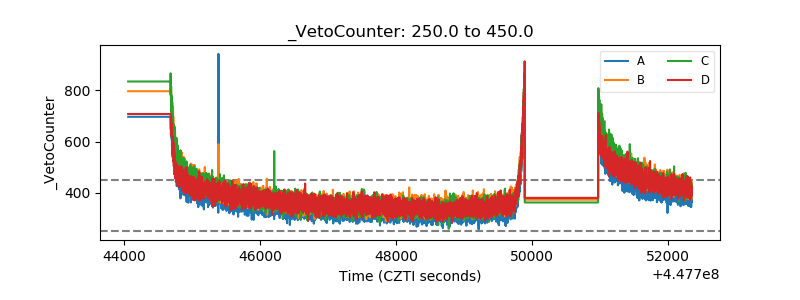 |