| Param | Original file | Final file |
|---|---|---|
| Filename | modeM0/AS1A13_071T05_9000006120_45690cztM0_level2.fits | modeM0/AS1A13_071T05_9000006120_45690cztM0_level2_quad_clean.evt |
| Size (bytes) | 751,737,600 | 99,869,760 |
| Size | 716.9 MB | 95.2 MB |
| Events in quadrant A | 6,130,583 | 755,016 |
| Events in quadrant B | 3,289,840 | 801,151 |
| Events in quadrant C | 12,985,330 | 329,211 |
| Events in quadrant D | 4,922,467 | 689,488 |
| Mode M0 | |||
|---|---|---|---|
| Quadrant | BADHDUFLAG | Total packets | Discarded packets |
| A | 0 | 22038 | 2 |
| B | 0 | 13808 | 2 |
| C | 0 | 42997 | 2 |
| D | 0 | 18784 | 2 |
| Mode M9 | |||
|---|---|---|---|
| Quadrant | BADHDUFLAG | Total packets | Discarded packets |
| A | 0 | 12 | 0 |
| B | 0 | 13 | 0 |
| C | 0 | 13 | 0 |
| D | 0 | 13 | 0 |
| Mode SS | |||
|---|---|---|---|
| Quadrant | BADHDUFLAG | Total packets | Discarded packets |
| A | 0 | 130 | 0 |
| B | 0 | 130 | 0 |
| C | 0 | 130 | 0 |
| D | 0 | 130 | 0 |
| Quadrant | Total seconds | Saturated seconds | Saturation percentage |
|---|---|---|---|
| A | 6440 | 309 | 4.798137% |
| B | 6440 | 106 | 1.645963% |
| C | 6440 | 4016 | 62.360248% |
| D | 6440 | 273 | 4.239130% |
Noise dominated data is calculated using 1-second bins in cleaned event files. If a bin has >2000 counts, and if more than 50% of those come from <1% of pixels, then it is considered to be noise-dominated and hence unusable.
| Quadrant | # 1 sec bins | Bins with >0 counts | Bins with >2000 counts | High rate bins dominated by noise | Noise dominated (total time) | Noise dominated (detector-on time) | Marked lightcurve |
|---|---|---|---|---|---|---|---|
| A | 7615 | 6440 | 32 | 32 | 0.42% | 0.50% | 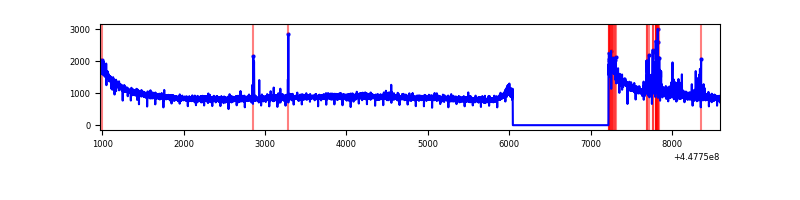 |
| B | 7615 | 6440 | 13 | 13 | 0.17% | 0.20% | 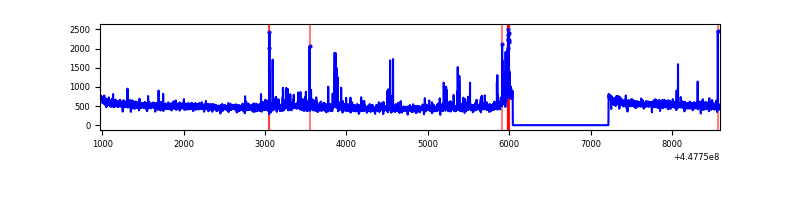 |
| C | 7615 | 6440 | 3860 | 3860 | 50.69% | 59.94% | 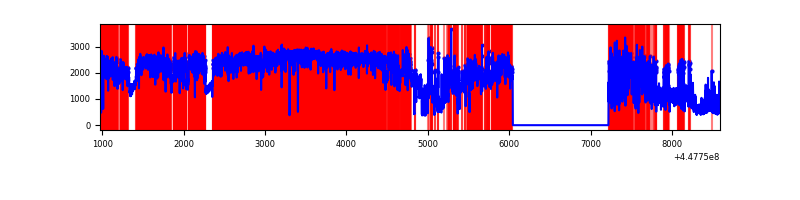 |
| D | 7615 | 6440 | 195 | 195 | 2.56% | 3.03% | 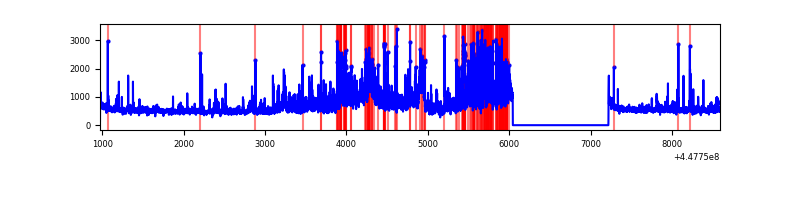 |
Top three noisy pixels from each quadrant. If the there are fewer than three noisy pixels in the level2.evt file, extra rows are filled as -1
| Pixel properties | Quadrant properties | ||||||
|---|---|---|---|---|---|---|---|
| Quadrant | DetID | PixID | Counts | Sigma | Mean | Median | Sigma |
| A | 10 | 83 | 2923712 | 18105.49 | 781 | 765 | 161.4 |
| A | 13 | 248 | 165779 | 1022.14 | 781 | 765 | 161.4 |
| A | 15 | 174 | 12676 | 73.78 | 781 | 765 | 161.4 |
| B | 3 | 112 | 76078 | 493.46 | 780 | 758 | 152.6 |
| B | 5 | 171 | 42554 | 273.83 | 780 | 758 | 152.6 |
| B | 15 | 35 | 27302 | 173.9 | 780 | 758 | 152.6 |
| C | 9 | 54 | 10155623 | 71808.91 | 607 | 611 | 141.4 |
| C | 14 | 254 | 377051 | 2661.91 | 607 | 611 | 141.4 |
| C | 3 | 233 | 63394 | 443.96 | 607 | 611 | 141.4 |
| D | 11 | 241 | 733879 | 3815.01 | 765 | 745 | 192.2 |
| D | 1 | 52 | 453082 | 2353.83 | 765 | 745 | 192.2 |
| D | 2 | 120 | 392807 | 2040.17 | 765 | 745 | 192.2 |
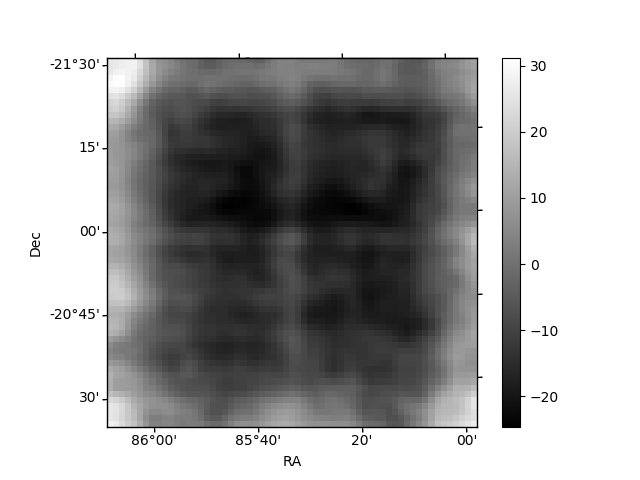
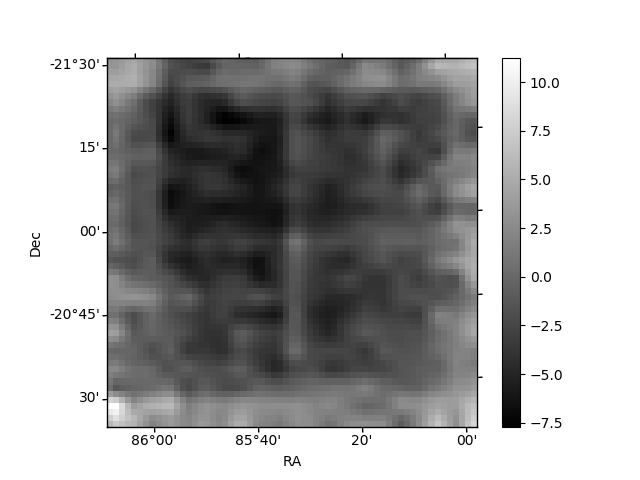
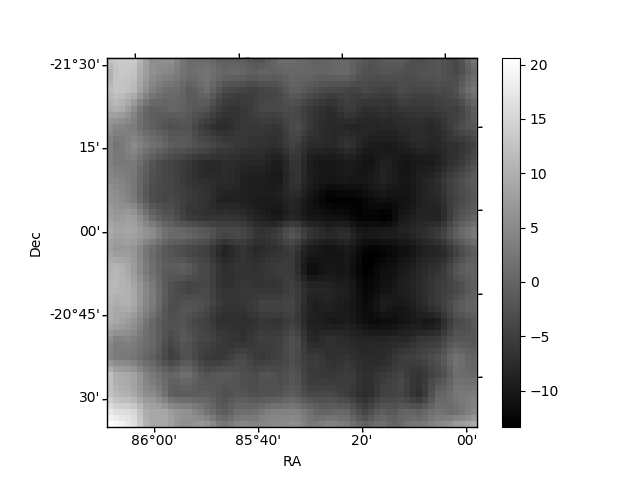
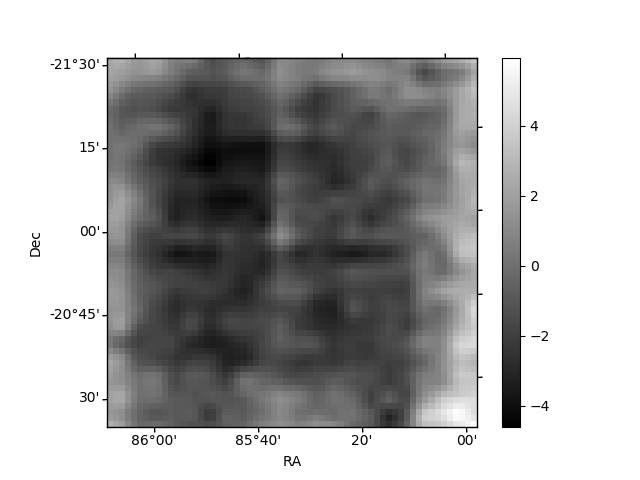
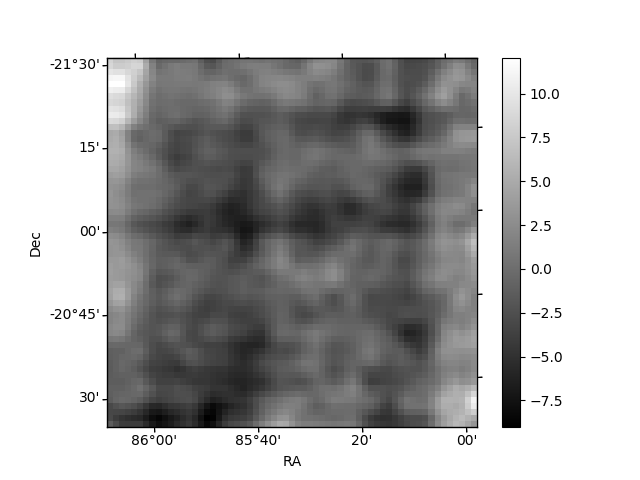
Histogram calculated using DETX and DETY for each event in the final _common_clean file
| Quadrant A | 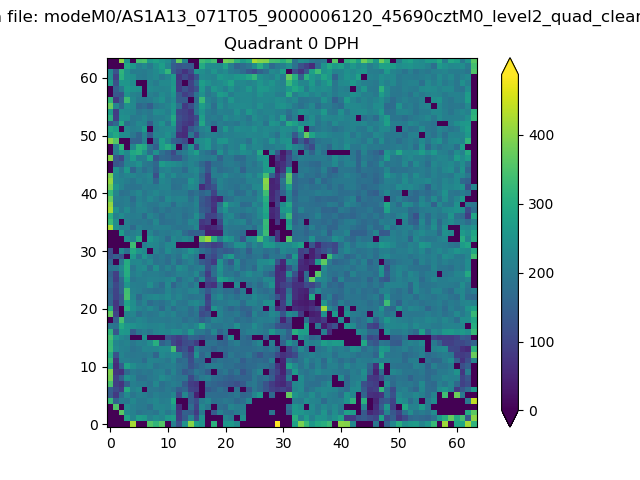 |
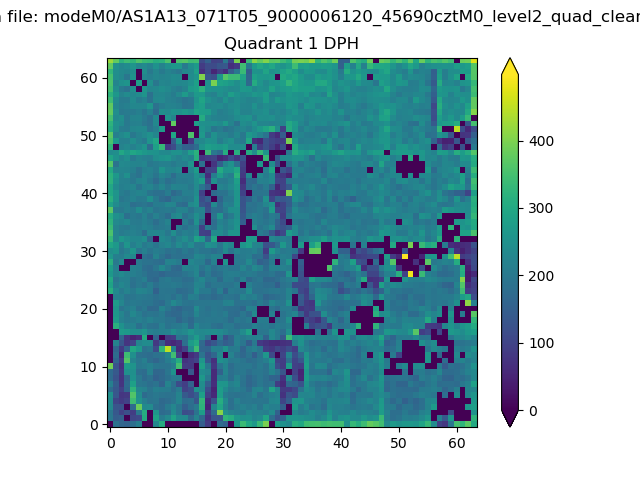 |
Quadrant B |
|---|---|---|---|
| Quadrant D | 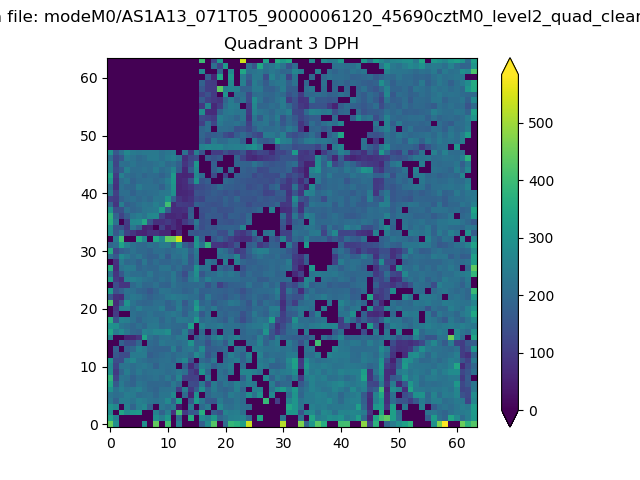 |
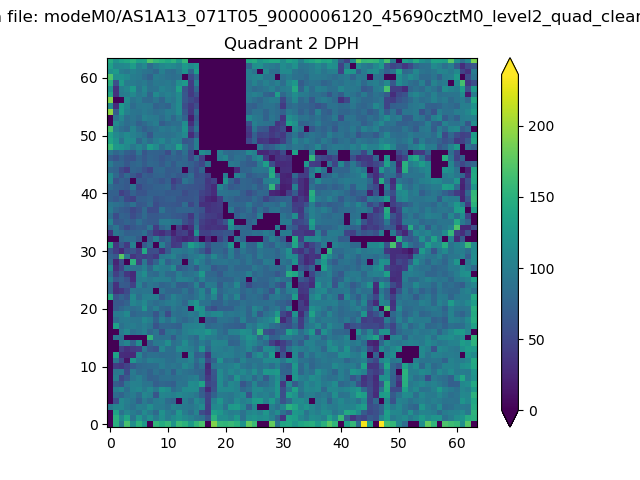 |
Quadrant C |
| Plot type | Count rate plots | Images |
|---|---|---|
| Comparison with Poisson distribution Blue bars denote a histogram of data divided into 1 sec bins. Red curve is a Poisson curve with rate = median count rate of data. |
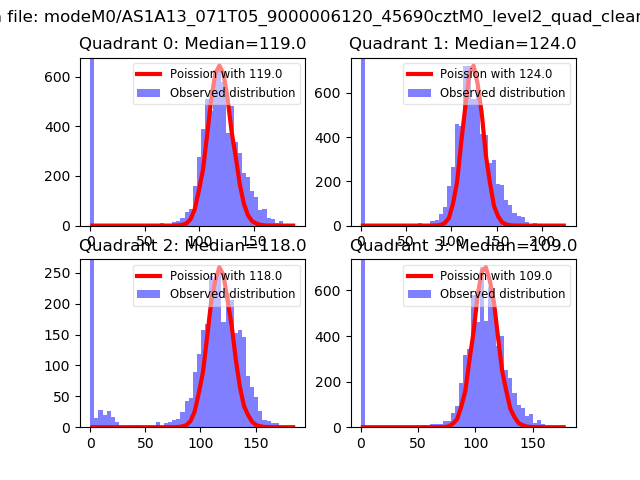 |
 |
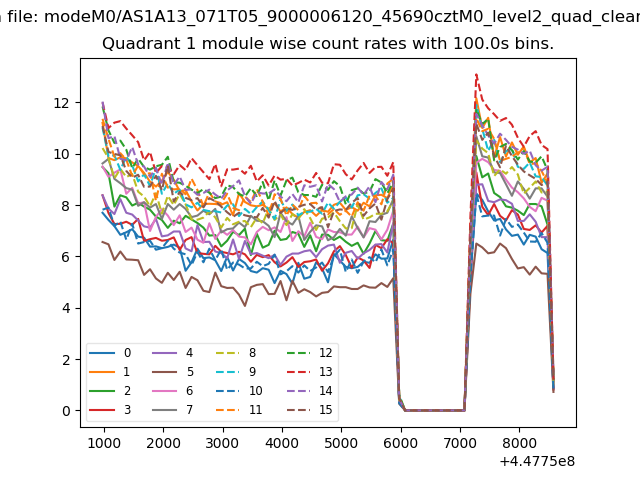
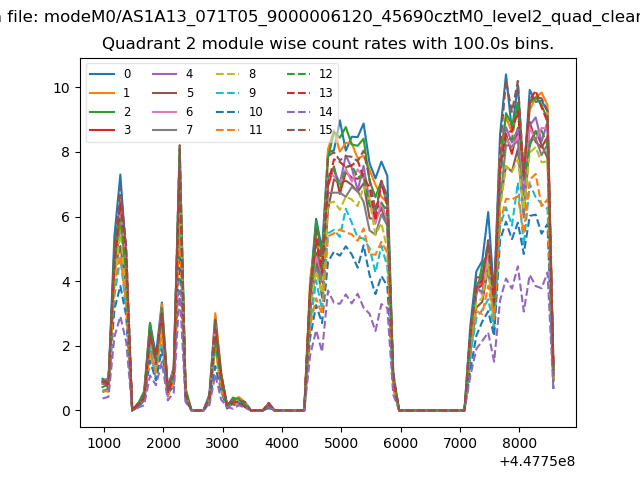
| Quadrant-wise count rates Data is divided into 100 sec bins |
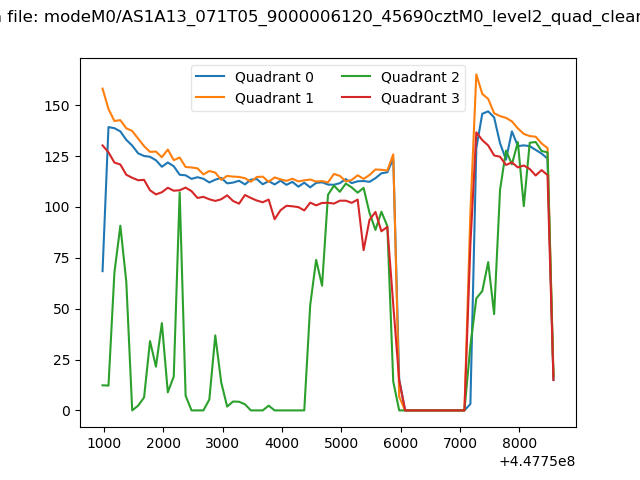 |
|
| Module-wise count rates for Quadrant A Data is divided into 100 sec bins |
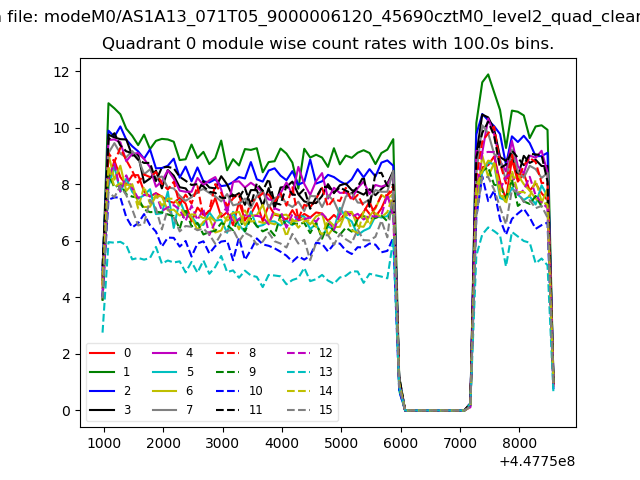 |
 |
| Module-wise count rates for Quadrant B Data is divided into 100 sec bins |
 |
 |
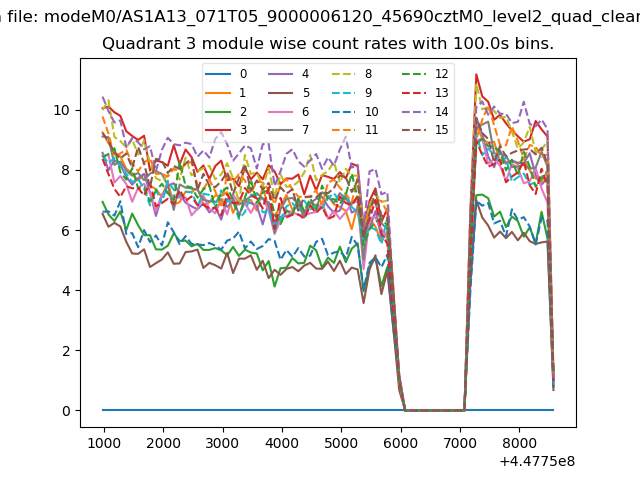
| Module-wise count rates for Quadrant C Data is divided into 100 sec bins |
 |
 |
| Module-wise count rates for Quadrant D Data is divided into 100 sec bins |
 |
 |
| Parameter | Plot |
|---|---|
| CZT HV Monitor |  |
| D_VDD | 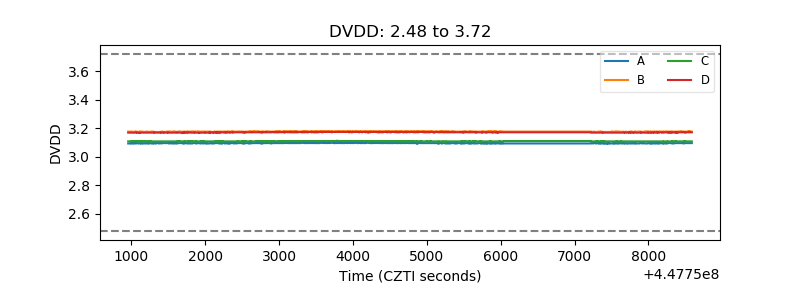 |
| Temperature 1 | 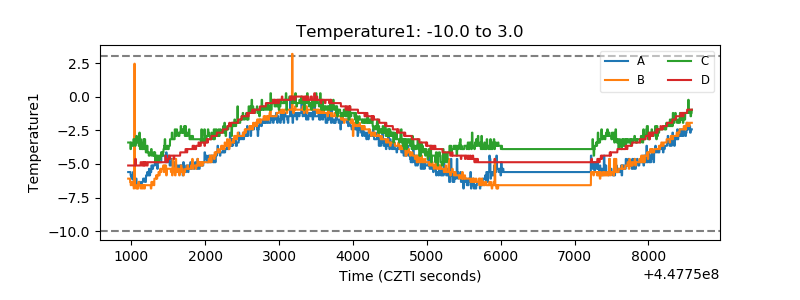 |
| Veto HV Monitor | 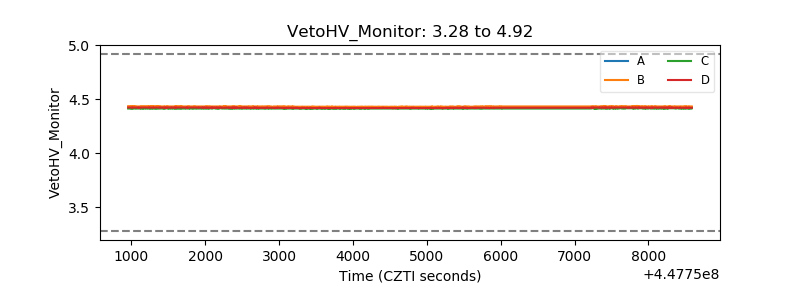 |
| Veto LLD | 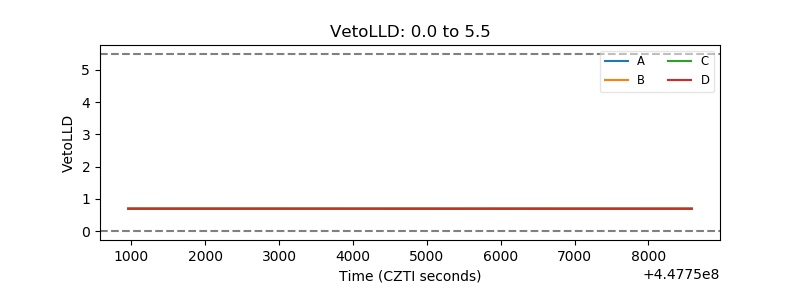 |
| Alpha Counter | 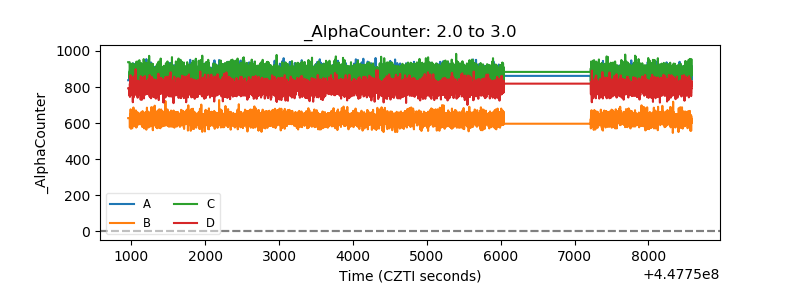 |
| _CPM_Rate | 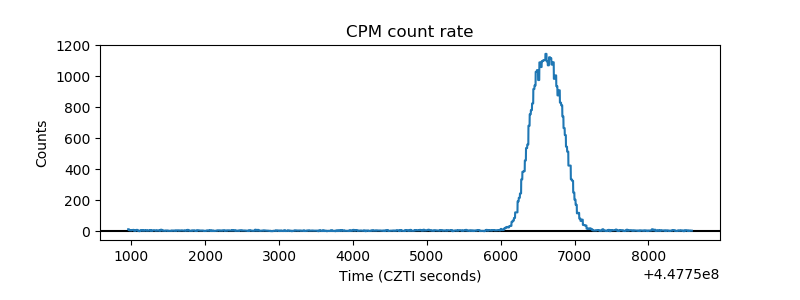 |
| CZT Counter | 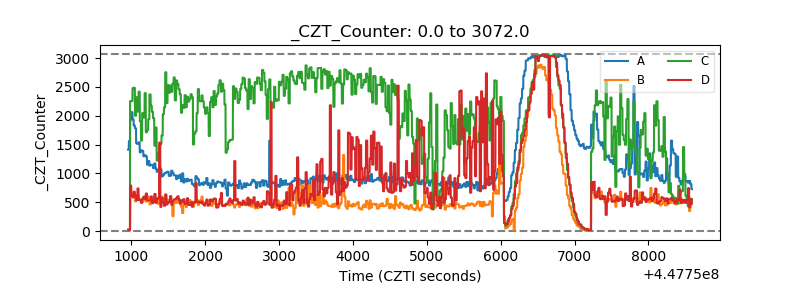 |
| +2.5 Volts monitor | 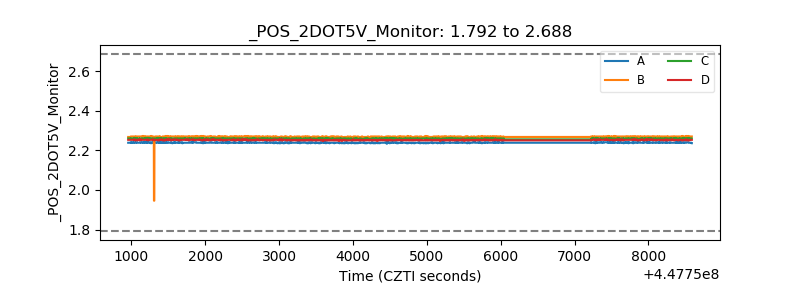 |
| +5 Volts monitor | 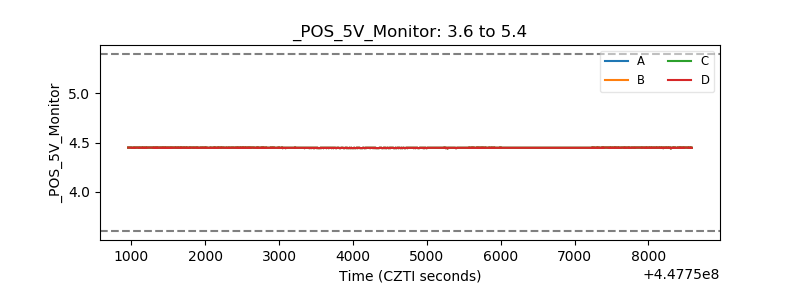 |
| _ROLL_ROT | 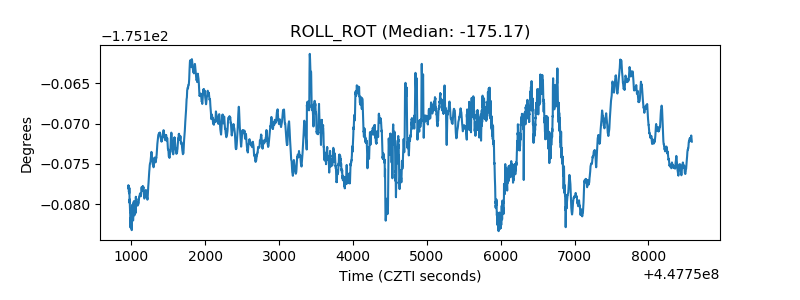 |
| _Roll_DEC | 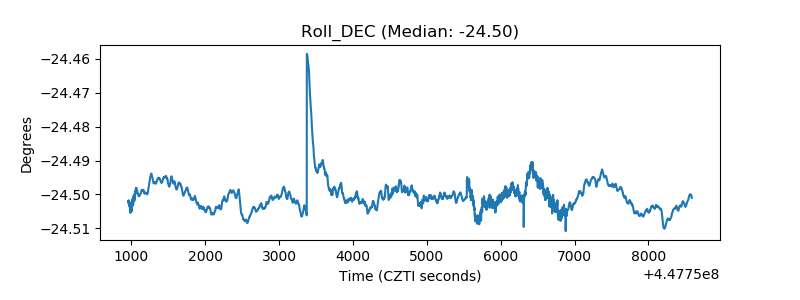 |
| _Roll_RA | 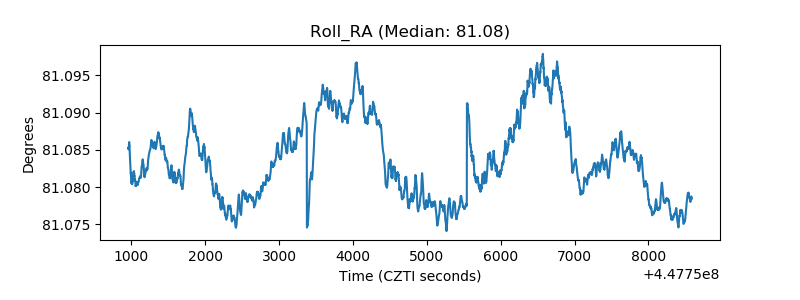 |
| Veto Counter | 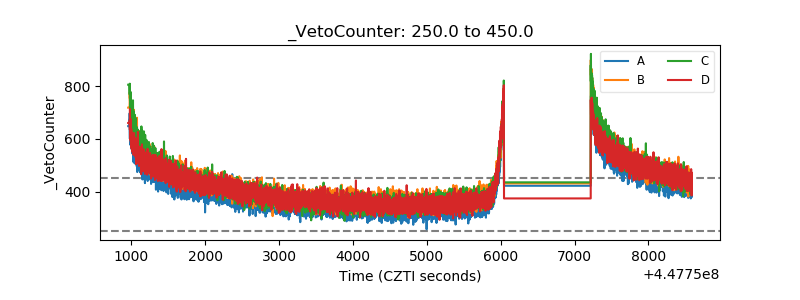 |