| Param | Original file | Final file |
|---|---|---|
| Filename | modeM0/AS1A13_028T01_9000006122_45693cztM0_level2.fits | modeM0/AS1A13_028T01_9000006122_45693cztM0_level2_quad_clean.evt |
| Size (bytes) | 831,499,200 | 95,221,440 |
| Size | 793.0 MB | 90.8 MB |
| Events in quadrant A | 6,033,158 | 768,182 |
| Events in quadrant B | 3,895,939 | 792,220 |
| Events in quadrant C | 15,041,876 | 169,695 |
| Events in quadrant D | 5,292,606 | 689,175 |
| Mode SS | |||
|---|---|---|---|
| Quadrant | BADHDUFLAG | Total packets | Discarded packets |
| A | 0 | 134 | 0 |
| B | 0 | 134 | 0 |
| C | 0 | 134 | 0 |
| D | 0 | 134 | 0 |
| Mode M9 | |||
|---|---|---|---|
| Quadrant | BADHDUFLAG | Total packets | Discarded packets |
| A | 0 | 11 | 0 |
| B | 0 | 11 | 0 |
| C | 0 | 11 | 0 |
| D | 0 | 11 | 0 |
| Mode M0 | |||
|---|---|---|---|
| Quadrant | BADHDUFLAG | Total packets | Discarded packets |
| A | 0 | 21870 | 1 |
| B | 0 | 15794 | 1 |
| C | 0 | 49216 | 7 |
| D | 0 | 20227 | 1 |
| Quadrant | Total seconds | Saturated seconds | Saturation percentage |
|---|---|---|---|
| A | 6658 | 254 | 3.814959% |
| B | 6659 | 250 | 3.754317% |
| C | 6658 | 5483 | 82.352058% |
| D | 6658 | 305 | 4.580955% |
Noise dominated data is calculated using 1-second bins in cleaned event files. If a bin has >2000 counts, and if more than 50% of those come from <1% of pixels, then it is considered to be noise-dominated and hence unusable.
| Quadrant | # 1 sec bins | Bins with >0 counts | Bins with >2000 counts | High rate bins dominated by noise | Noise dominated (total time) | Noise dominated (detector-on time) | Marked lightcurve |
|---|---|---|---|---|---|---|---|
| A | 7728 | 6658 | 6 | 6 | 0.08% | 0.09% | 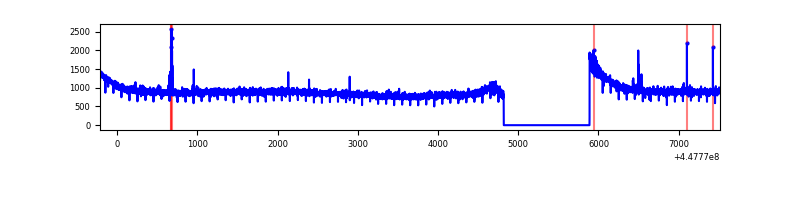 |
| B | 7729 | 6659 | 70 | 70 | 0.91% | 1.05% | 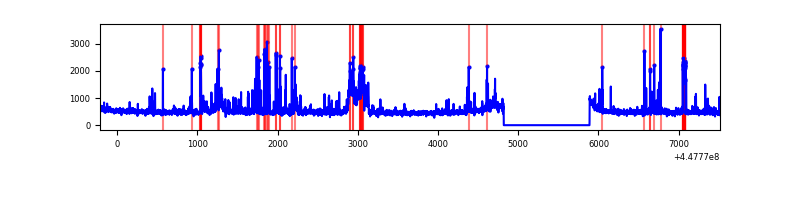 |
| C | 7727 | 6657 | 5228 | 5228 | 67.66% | 78.53% | 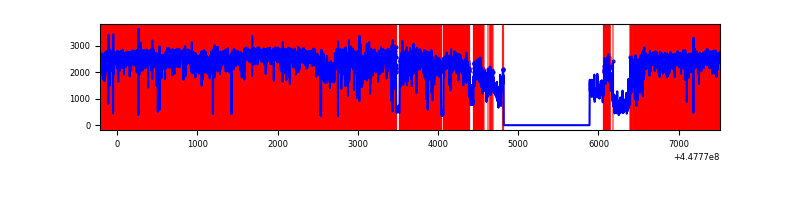 |
| D | 7728 | 6658 | 195 | 195 | 2.52% | 2.93% |  |
Top three noisy pixels from each quadrant. If the there are fewer than three noisy pixels in the level2.evt file, extra rows are filled as -1
| Pixel properties | Quadrant properties | ||||||
|---|---|---|---|---|---|---|---|
| Quadrant | DetID | PixID | Counts | Sigma | Mean | Median | Sigma |
| A | 10 | 83 | 2933672 | 17868.06 | 791 | 771 | 164.1 |
| A | 13 | 248 | 32756 | 194.86 | 791 | 771 | 164.1 |
| A | 3 | 137 | 8703 | 48.32 | 791 | 771 | 164.1 |
| B | 12 | 18 | 335869 | 2206.5 | 786 | 761 | 151.9 |
| B | 0 | 186 | 154347 | 1011.28 | 786 | 761 | 151.9 |
| B | 3 | 112 | 114473 | 748.73 | 786 | 761 | 151.9 |
| C | 9 | 54 | 12789716 | 100509.1 | 548 | 550 | 127.2 |
| C | 14 | 254 | 80030 | 624.63 | 548 | 550 | 127.2 |
| C | 0 | 207 | 24807 | 190.63 | 548 | 550 | 127.2 |
| D | 2 | 165 | 1186883 | 6157.9 | 772 | 746 | 192.6 |
| D | 2 | 249 | 342344 | 1773.42 | 772 | 746 | 192.6 |
| D | 1 | 52 | 281258 | 1456.29 | 772 | 746 | 192.6 |
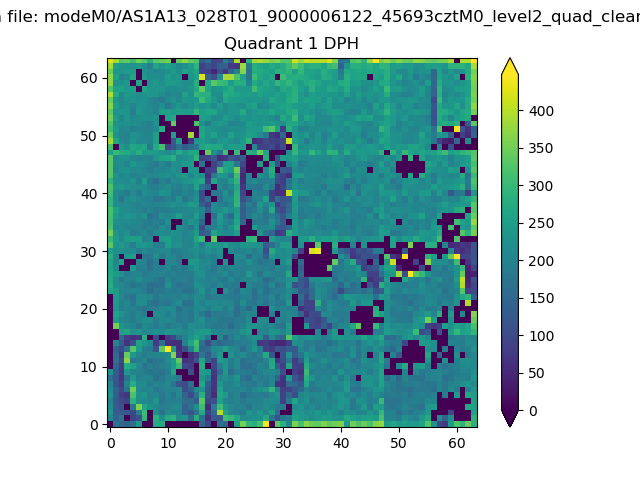
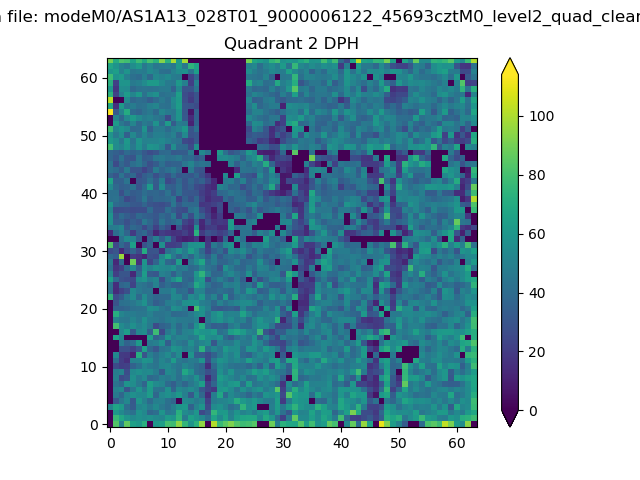
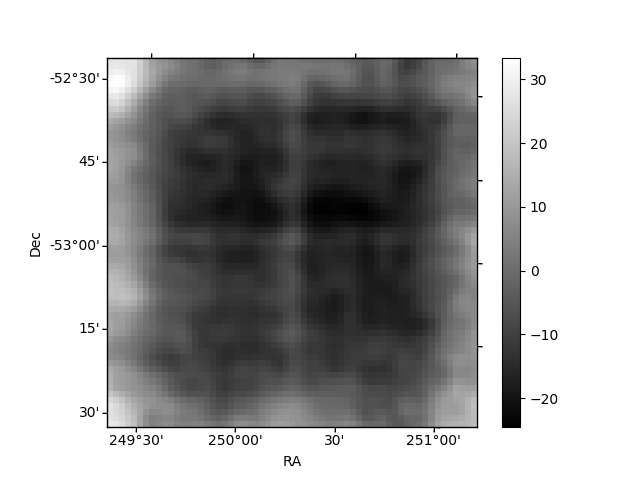
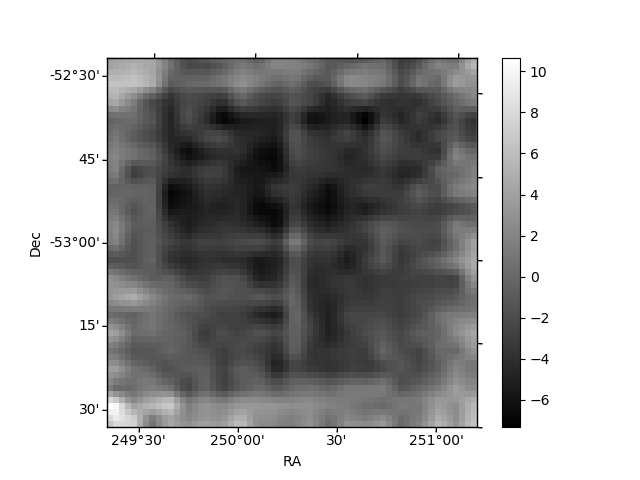
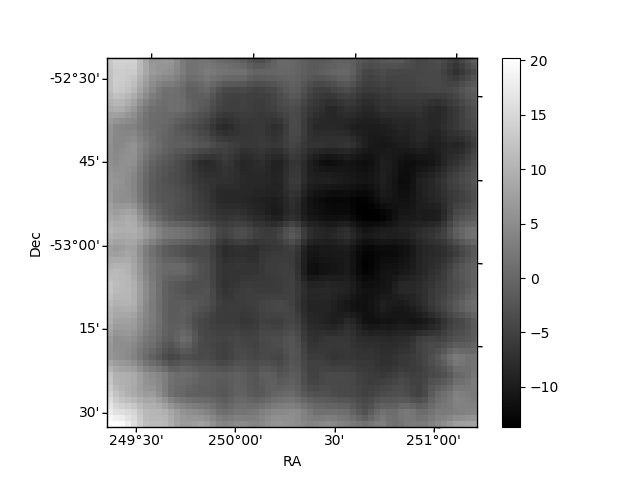
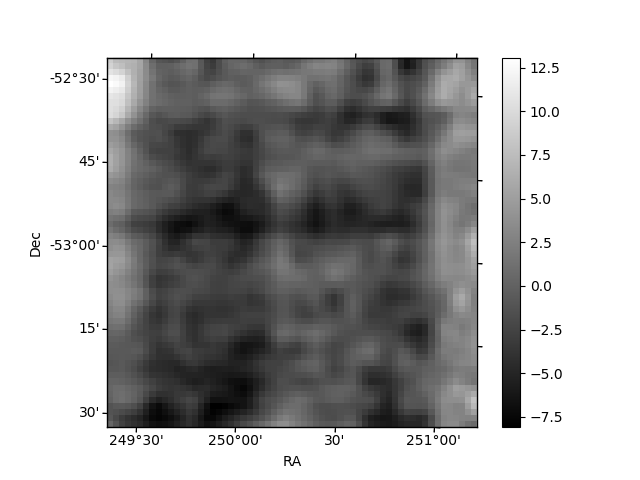
Histogram calculated using DETX and DETY for each event in the final _common_clean file
| Quadrant A | 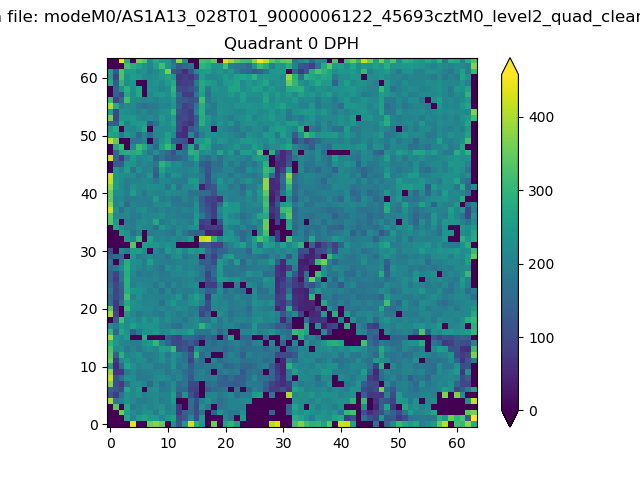 |
 |
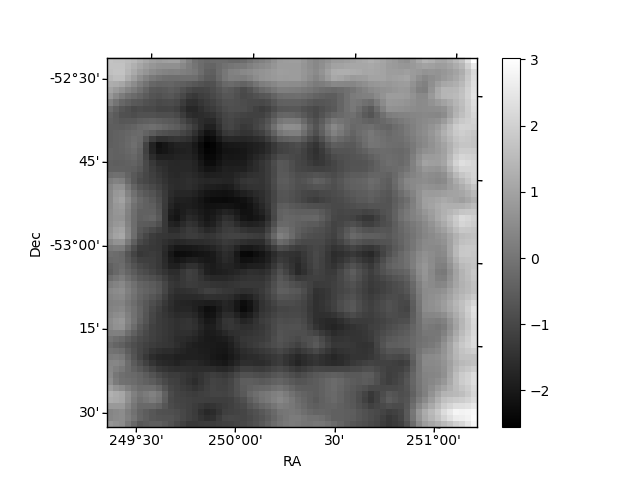
Quadrant B |
|---|---|---|---|
| Quadrant D | 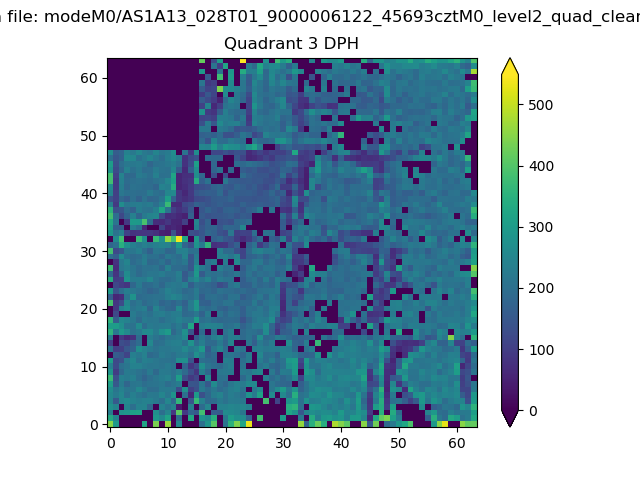 |
 |
Quadrant C |
| Plot type | Count rate plots | Images |
|---|---|---|
| Comparison with Poisson distribution Blue bars denote a histogram of data divided into 1 sec bins. Red curve is a Poisson curve with rate = median count rate of data. |
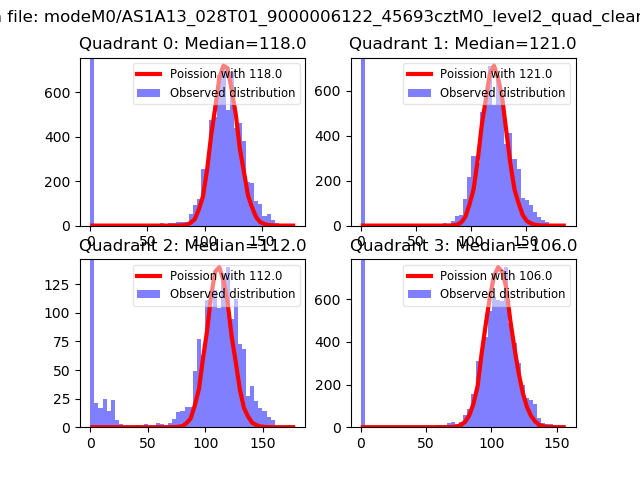 |
 |
| Quadrant-wise count rates Data is divided into 100 sec bins |
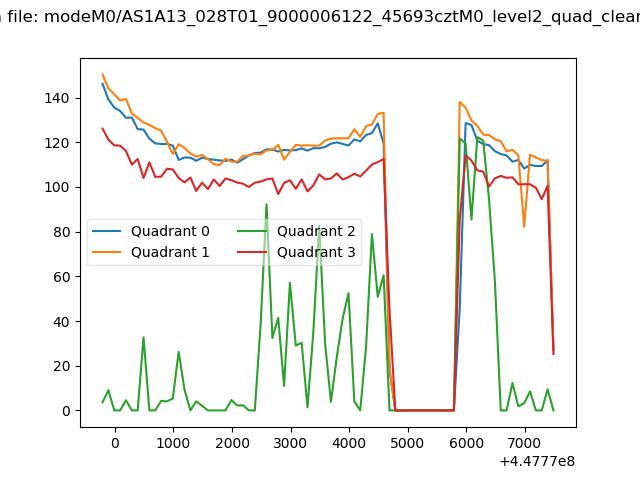 |
|
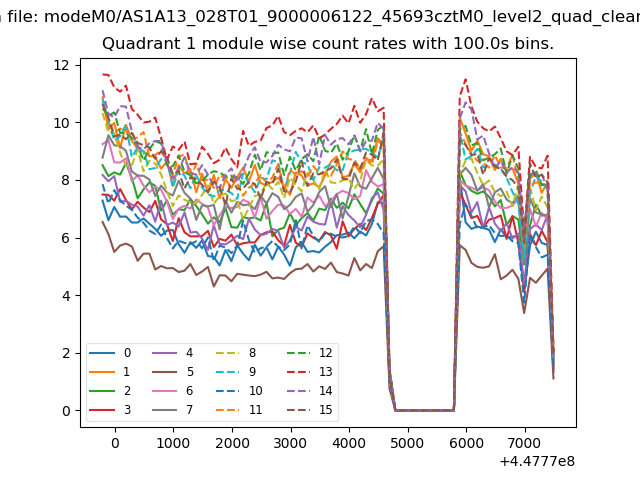
| Module-wise count rates for Quadrant A Data is divided into 100 sec bins |
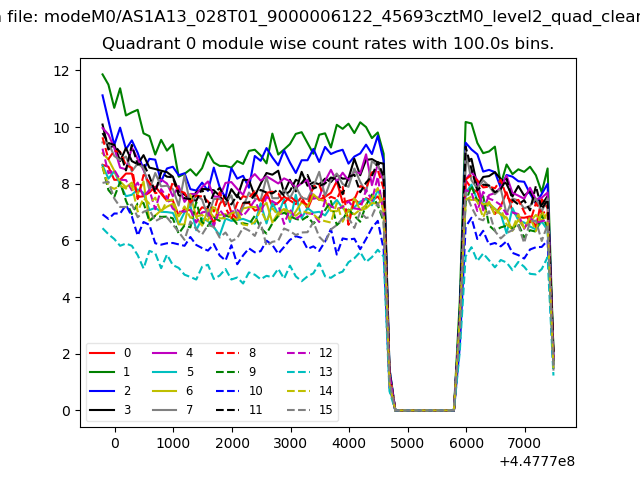 |
 |
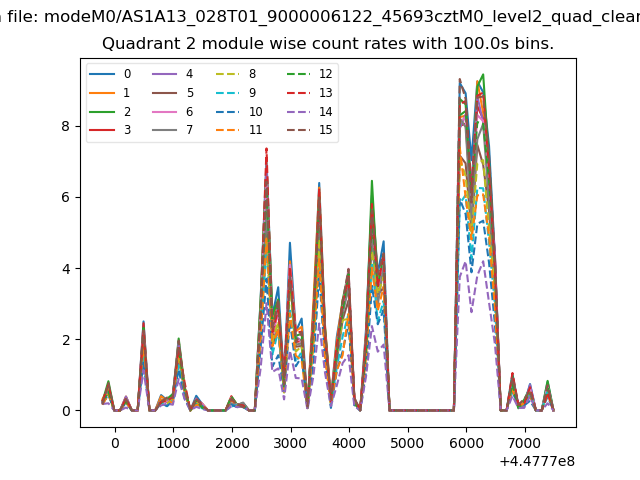
| Module-wise count rates for Quadrant B Data is divided into 100 sec bins |
 |
 |
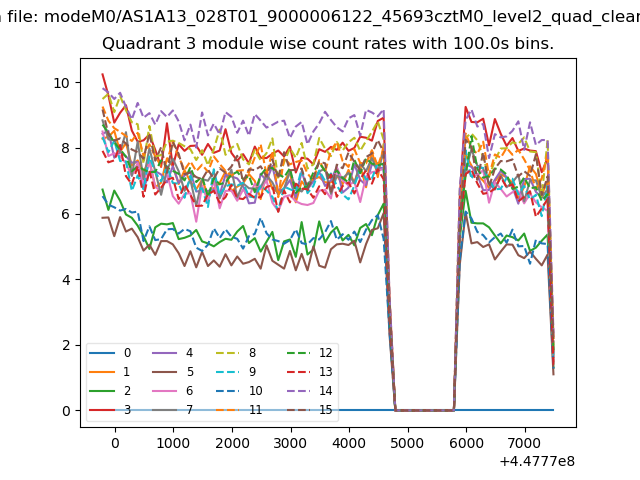
| Module-wise count rates for Quadrant C Data is divided into 100 sec bins |
 |
 |
| Module-wise count rates for Quadrant D Data is divided into 100 sec bins |
 |
 |
| Parameter | Plot |
|---|---|
| CZT HV Monitor | 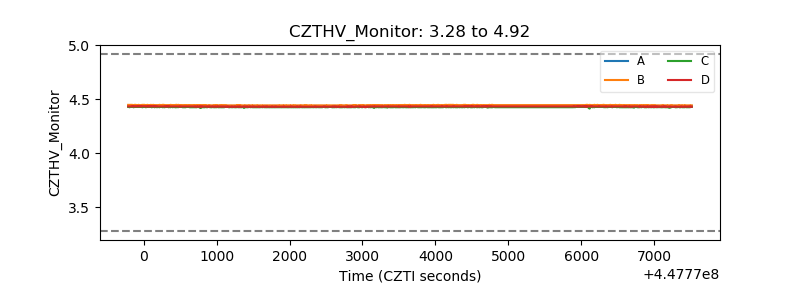 |
| D_VDD | 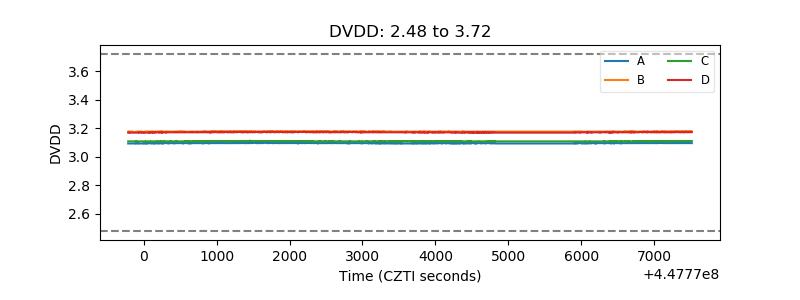 |
| Temperature 1 |  |
| Veto HV Monitor | 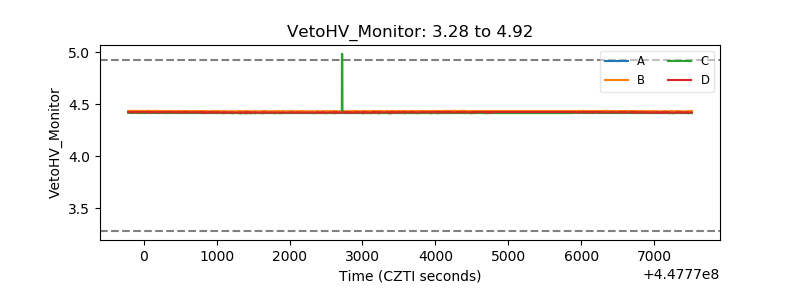 |
| Veto LLD | 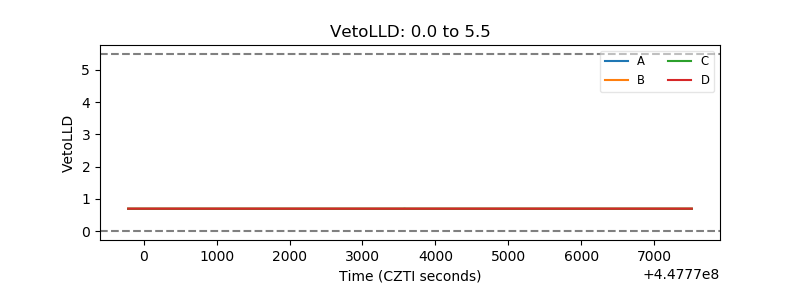 |
| Alpha Counter | 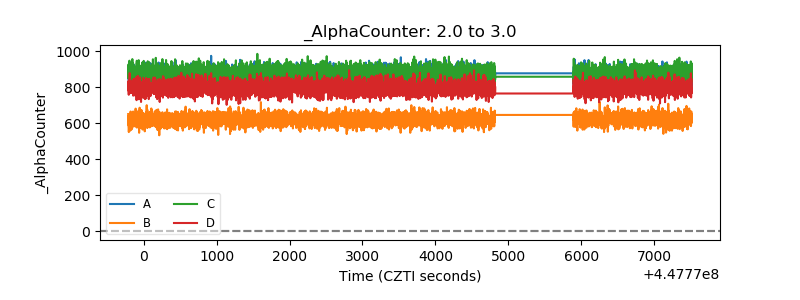 |
| _CPM_Rate | 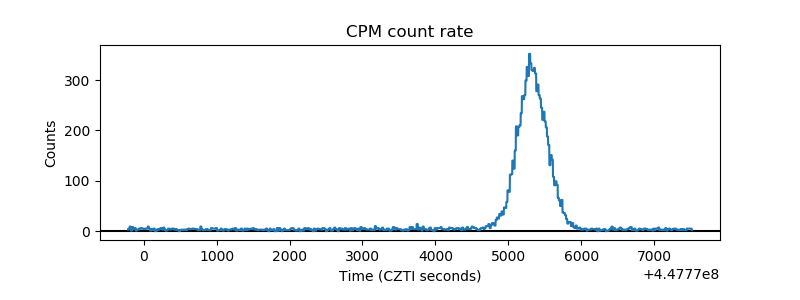 |
| CZT Counter | 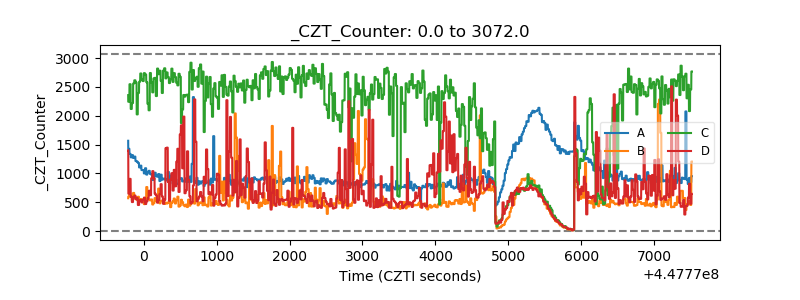 |
| +2.5 Volts monitor | 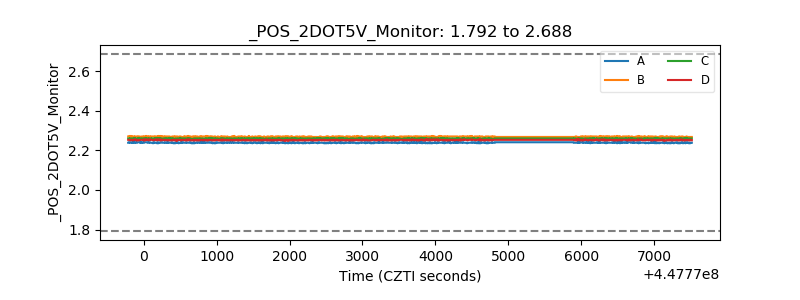 |
| +5 Volts monitor | 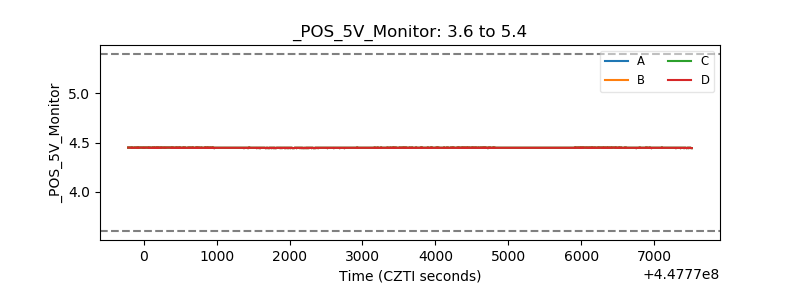 |
| _ROLL_ROT | 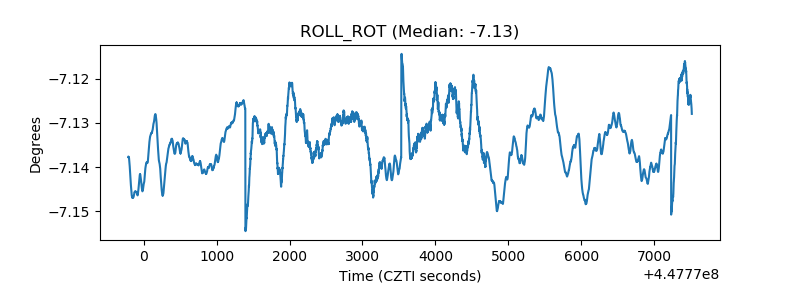 |
| _Roll_DEC | 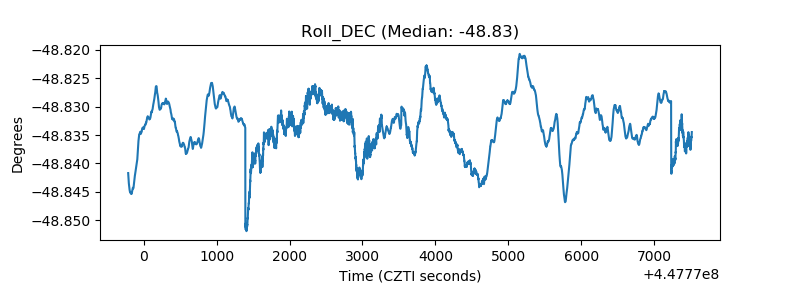 |
| _Roll_RA | 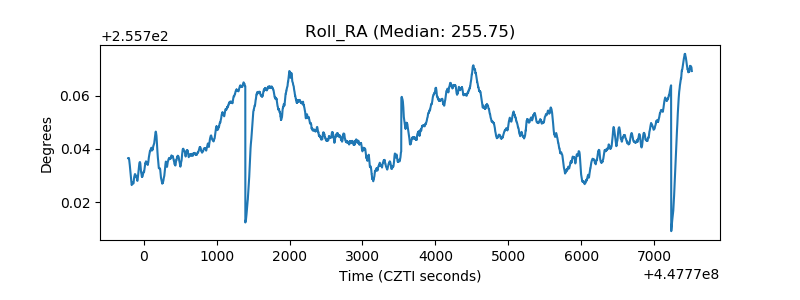 |
| Veto Counter | 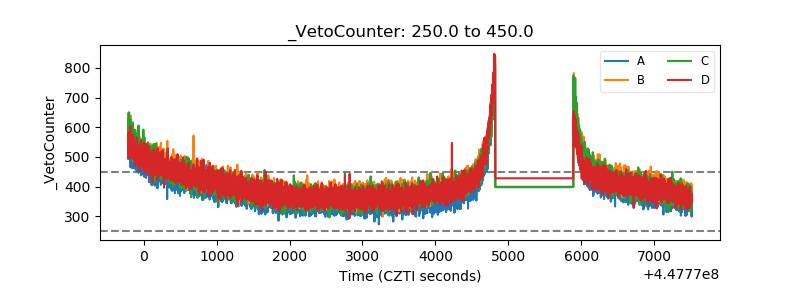 |