| Param | Original file | Final file |
|---|---|---|
| Filename | modeM0/AS1A13_028T01_9000006122_45694cztM0_level2.fits | modeM0/AS1A13_028T01_9000006122_45694cztM0_level2_quad_clean.evt |
| Size (bytes) | 789,238,080 | 96,906,240 |
| Size | 752.7 MB | 92.4 MB |
| Events in quadrant A | 6,035,251 | 743,805 |
| Events in quadrant B | 3,671,872 | 760,589 |
| Events in quadrant C | 14,358,757 | 284,023 |
| Events in quadrant D | 4,623,496 | 672,642 |
| Mode SS | |||
|---|---|---|---|
| Quadrant | BADHDUFLAG | Total packets | Discarded packets |
| A | 0 | 138 | 0 |
| B | 0 | 138 | 0 |
| C | 0 | 138 | 0 |
| D | 0 | 138 | 0 |
| Mode M9 | |||
|---|---|---|---|
| Quadrant | BADHDUFLAG | Total packets | Discarded packets |
| A | 0 | 8 | 0 |
| B | 0 | 8 | 0 |
| C | 0 | 8 | 0 |
| D | 0 | 8 | 0 |
| Mode M0 | |||
|---|---|---|---|
| Quadrant | BADHDUFLAG | Total packets | Discarded packets |
| A | 0 | 22187 | 1 |
| B | 0 | 15332 | 1 |
| C | 0 | 47310 | 1 |
| D | 0 | 18265 | 2 |
| Quadrant | Total seconds | Saturated seconds | Saturation percentage |
|---|---|---|---|
| A | 6786 | 250 | 3.684055% |
| B | 6787 | 252 | 3.712981% |
| C | 6787 | 4603 | 67.820834% |
| D | 6786 | 290 | 4.273504% |
Noise dominated data is calculated using 1-second bins in cleaned event files. If a bin has >2000 counts, and if more than 50% of those come from <1% of pixels, then it is considered to be noise-dominated and hence unusable.
| Quadrant | # 1 sec bins | Bins with >0 counts | Bins with >2000 counts | High rate bins dominated by noise | Noise dominated (total time) | Noise dominated (detector-on time) | Marked lightcurve |
|---|---|---|---|---|---|---|---|
| A | 7616 | 6786 | 3 | 3 | 0.04% | 0.04% | 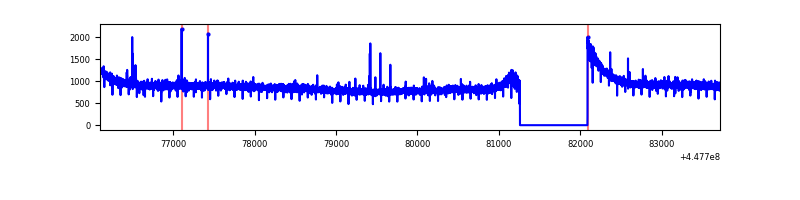 |
| B | 7617 | 6787 | 65 | 65 | 0.85% | 0.96% | 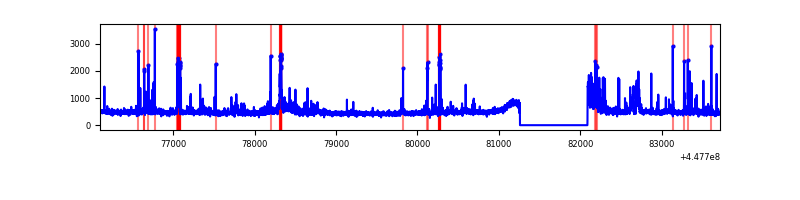 |
| C | 7616 | 6786 | 4492 | 4492 | 58.98% | 66.20% | 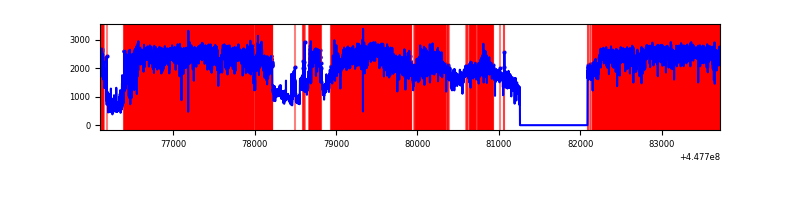 |
| D | 7616 | 6786 | 180 | 180 | 2.36% | 2.65% | 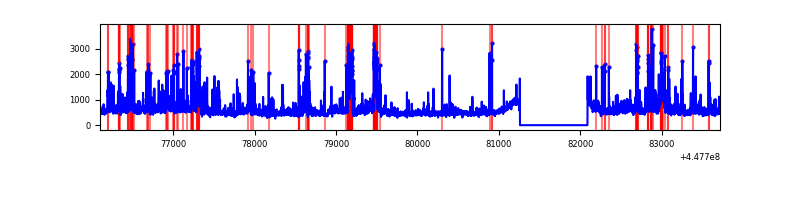 |
Top three noisy pixels from each quadrant. If the there are fewer than three noisy pixels in the level2.evt file, extra rows are filled as -1
| Pixel properties | Quadrant properties | ||||||
|---|---|---|---|---|---|---|---|
| Quadrant | DetID | PixID | Counts | Sigma | Mean | Median | Sigma |
| A | 10 | 83 | 2953836 | 18191.74 | 785 | 767 | 162.3 |
| A | 13 | 248 | 19787 | 117.17 | 785 | 767 | 162.3 |
| A | 2 | 79 | 13099 | 75.97 | 785 | 767 | 162.3 |
| B | 3 | 112 | 151332 | 979.59 | 781 | 754 | 153.7 |
| B | 12 | 18 | 125137 | 809.17 | 781 | 754 | 153.7 |
| B | 0 | 186 | 103072 | 665.63 | 781 | 754 | 153.7 |
| C | 9 | 54 | 11874470 | 84264.46 | 602 | 607 | 140.9 |
| C | 14 | 254 | 104185 | 735.06 | 602 | 607 | 140.9 |
| C | 0 | 207 | 23060 | 159.34 | 602 | 607 | 140.9 |
| D | 2 | 165 | 592618 | 3067.11 | 772 | 747 | 193.0 |
| D | 1 | 52 | 268110 | 1385.49 | 772 | 747 | 193.0 |
| D | 13 | 249 | 227175 | 1173.36 | 772 | 747 | 193.0 |
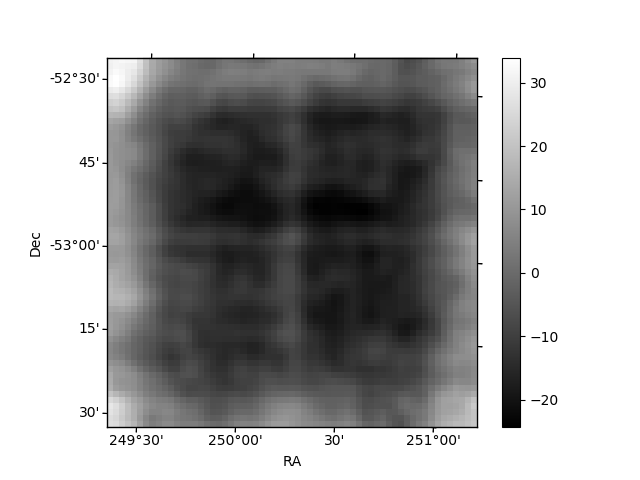
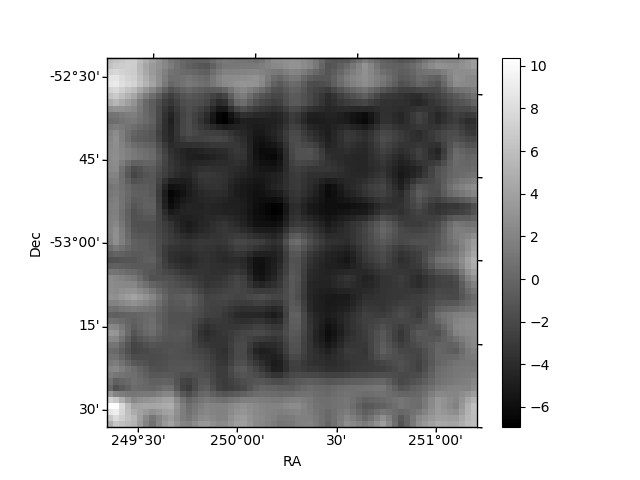
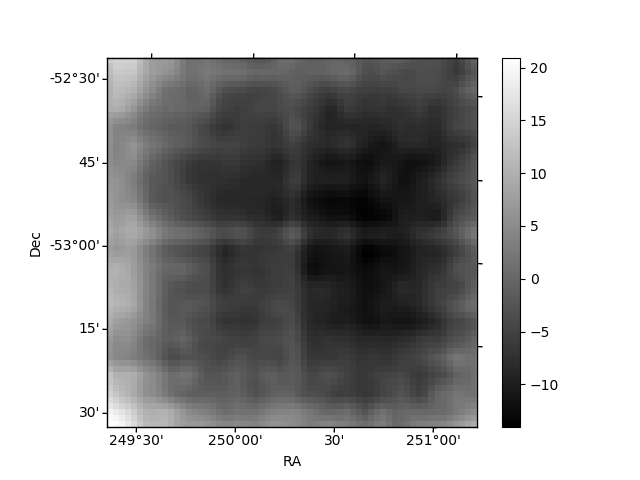
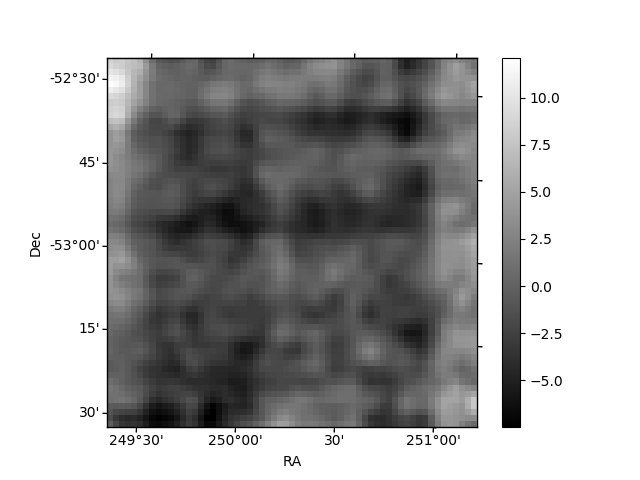
Histogram calculated using DETX and DETY for each event in the final _common_clean file
| Quadrant A | 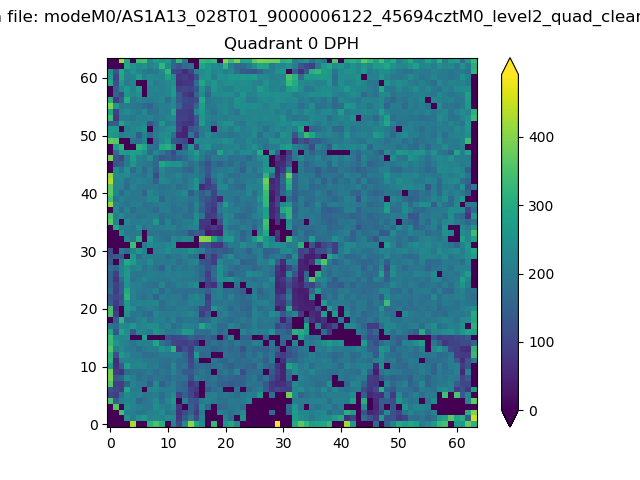 |
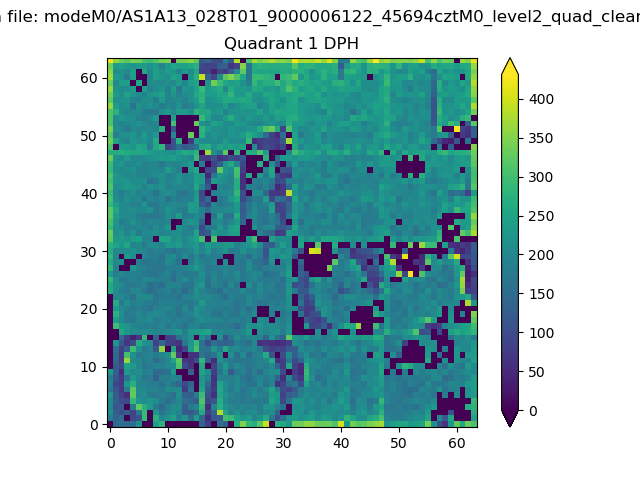 |
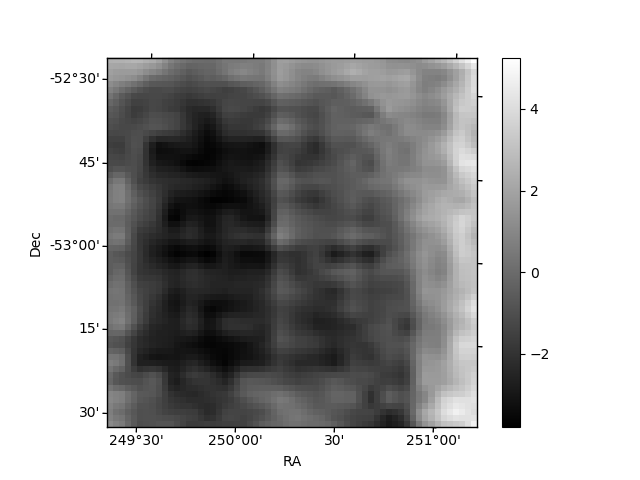
Quadrant B |
|---|---|---|---|
| Quadrant D | 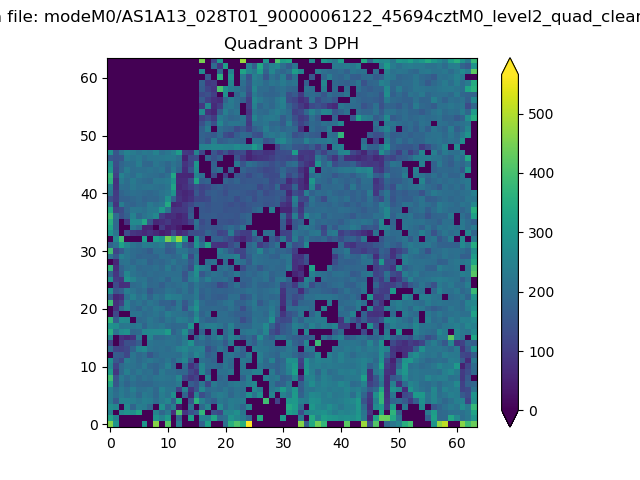 |
 |
Quadrant C |
| Plot type | Count rate plots | Images |
|---|---|---|
| Comparison with Poisson distribution Blue bars denote a histogram of data divided into 1 sec bins. Red curve is a Poisson curve with rate = median count rate of data. |
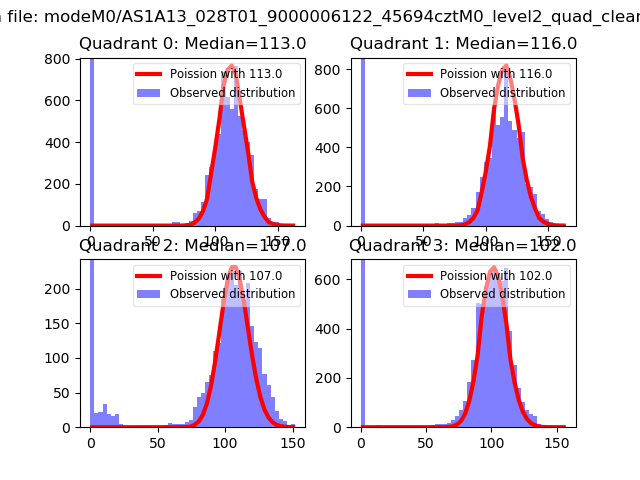 |
 |
| Quadrant-wise count rates Data is divided into 100 sec bins |
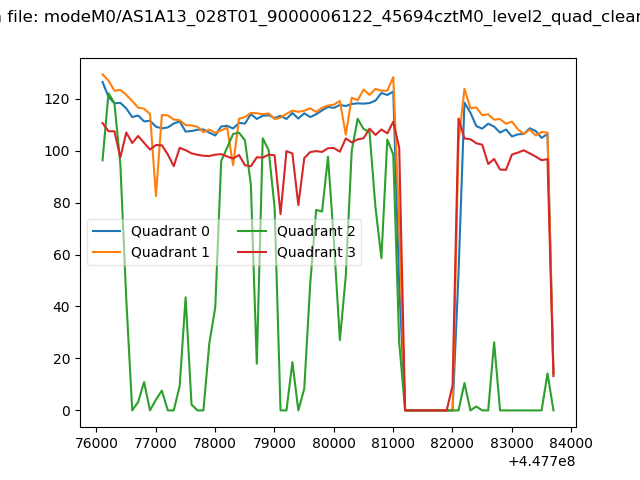 |
|
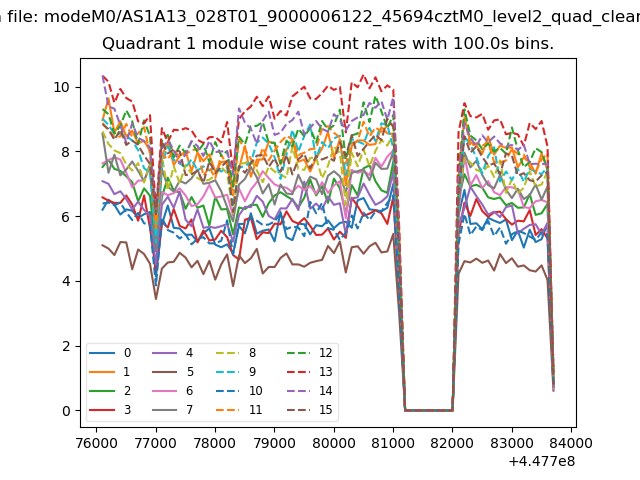
| Module-wise count rates for Quadrant A Data is divided into 100 sec bins |
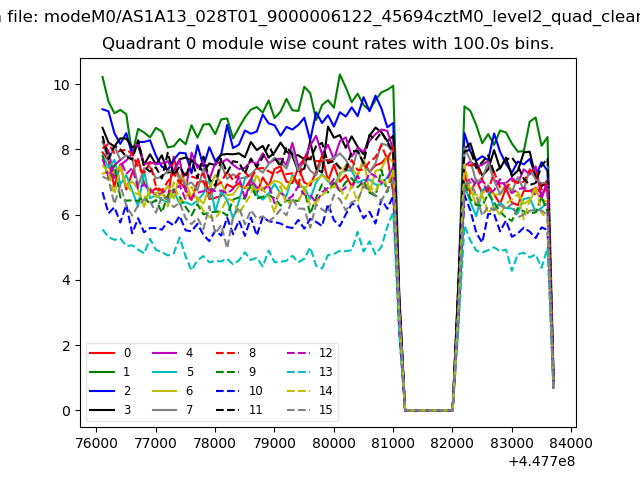 |
 |
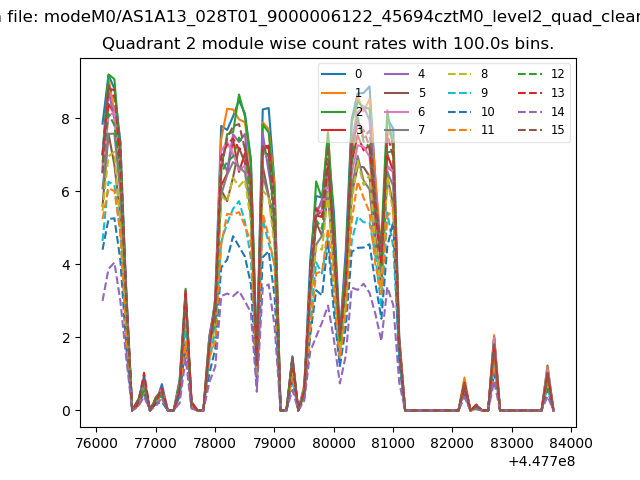
| Module-wise count rates for Quadrant B Data is divided into 100 sec bins |
 |
 |
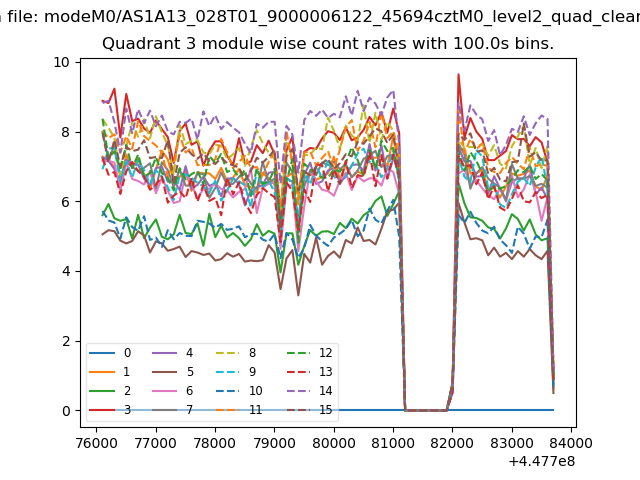
| Module-wise count rates for Quadrant C Data is divided into 100 sec bins |
 |
 |
| Module-wise count rates for Quadrant D Data is divided into 100 sec bins |
 |
 |
| Parameter | Plot |
|---|---|
| CZT HV Monitor | 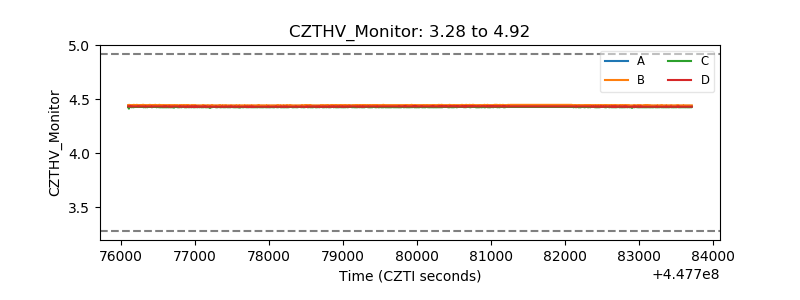 |
| D_VDD | 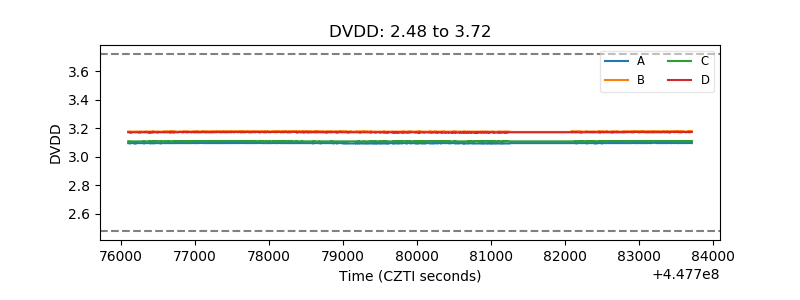 |
| Temperature 1 | 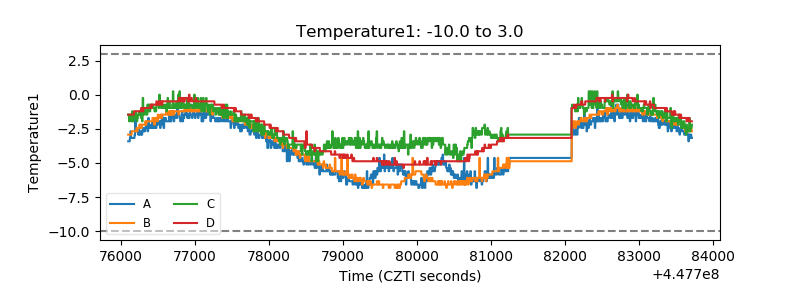 |
| Veto HV Monitor | 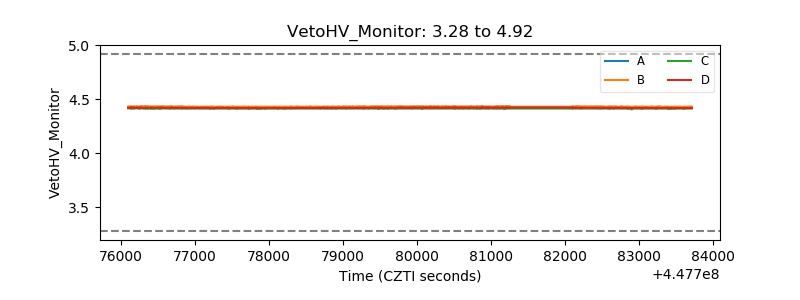 |
| Veto LLD | 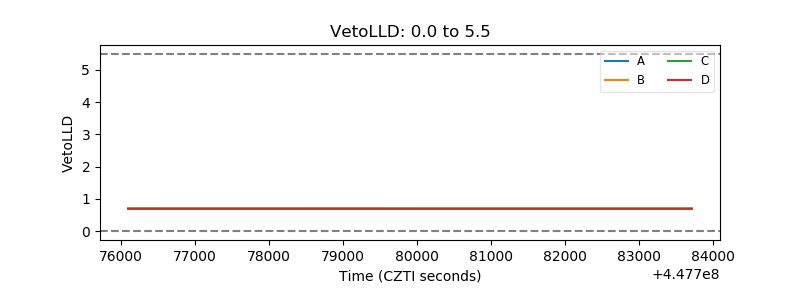 |
| Alpha Counter | 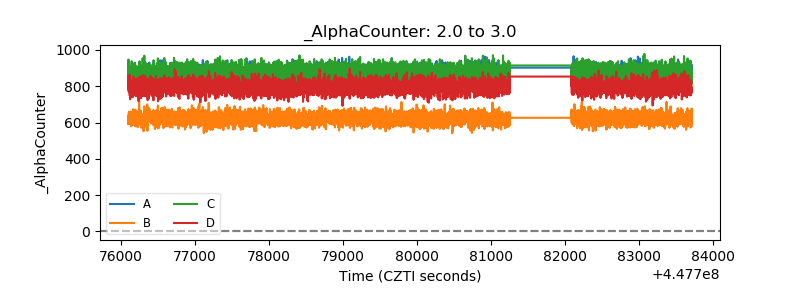 |
| _CPM_Rate | 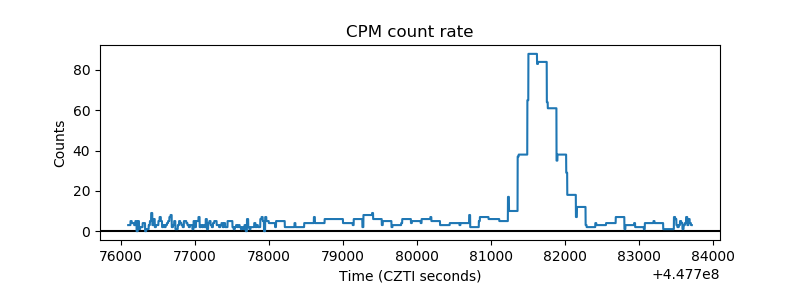 |
| CZT Counter | 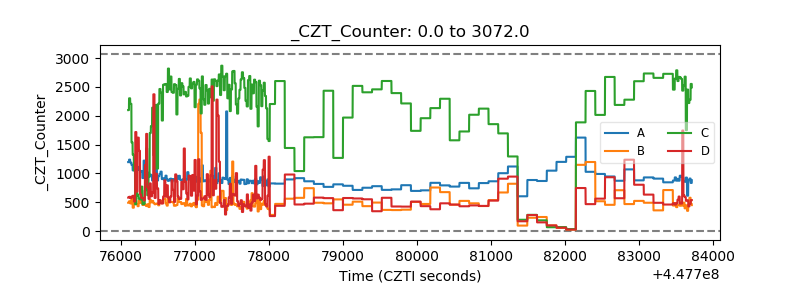 |
| +2.5 Volts monitor | 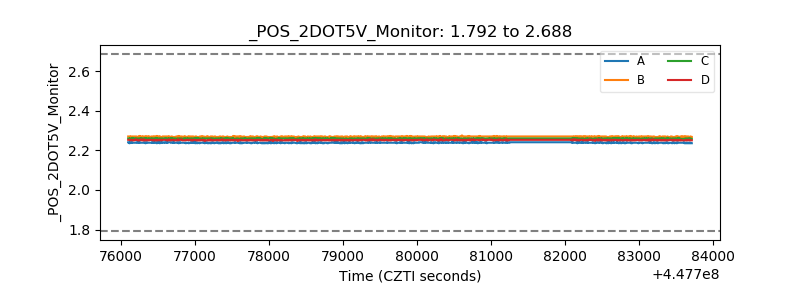 |
| +5 Volts monitor | 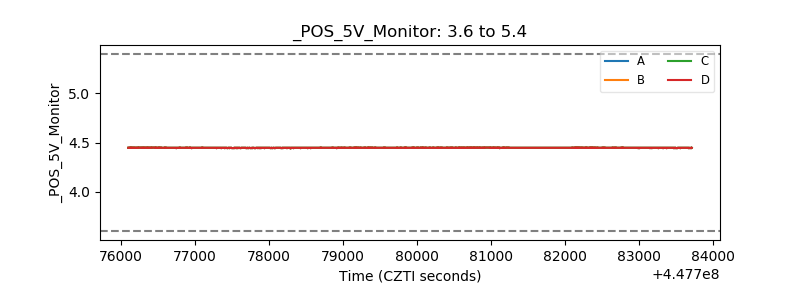 |
| _ROLL_ROT | 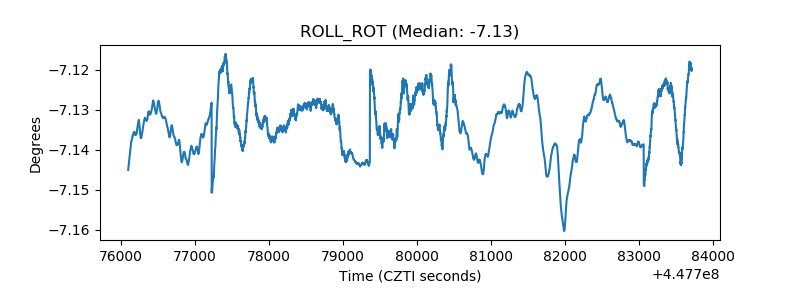 |
| _Roll_DEC | 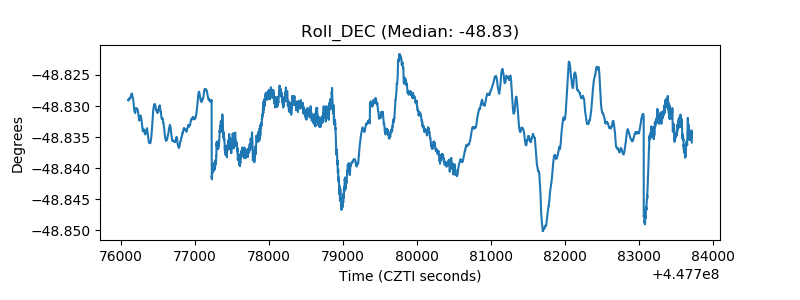 |
| _Roll_RA | 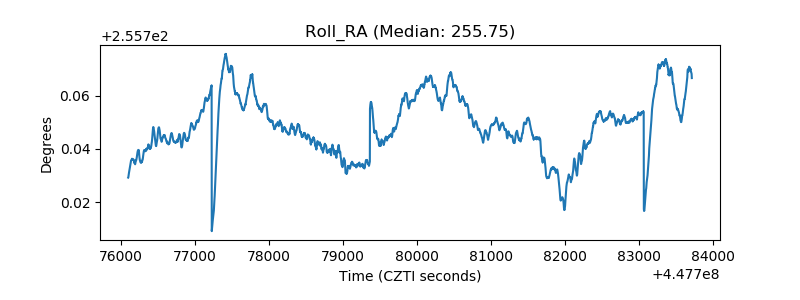 |
| Veto Counter | 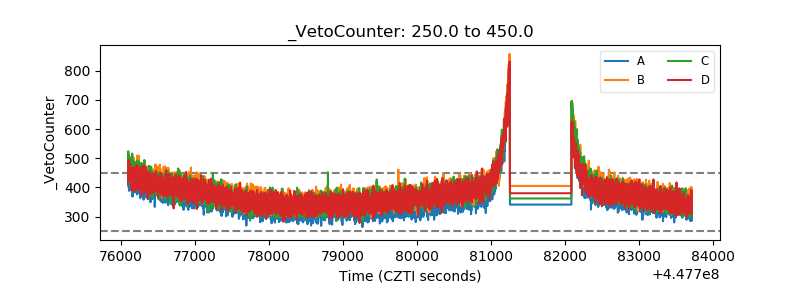 |