| Param | Original file | Final file |
|---|---|---|
| Filename | modeM0/AS1A13_028T01_9000006122_45695cztM0_level2.fits | modeM0/AS1A13_028T01_9000006122_45695cztM0_level2_quad_clean.evt |
| Size (bytes) | 844,352,640 | 90,267,840 |
| Size | 805.2 MB | 86.1 MB |
| Events in quadrant A | 5,950,941 | 723,779 |
| Events in quadrant B | 3,541,656 | 742,826 |
| Events in quadrant C | 16,114,902 | 143,594 |
| Events in quadrant D | 5,119,835 | 648,042 |
| Mode SS | |||
|---|---|---|---|
| Quadrant | BADHDUFLAG | Total packets | Discarded packets |
| A | 0 | 138 | 0 |
| B | 0 | 138 | 0 |
| C | 0 | 138 | 0 |
| D | 0 | 138 | 0 |
| Mode M9 | |||
|---|---|---|---|
| Quadrant | BADHDUFLAG | Total packets | Discarded packets |
| A | 0 | 3 | 0 |
| B | 0 | 3 | 0 |
| C | 0 | 3 | 0 |
| D | 0 | 3 | 0 |
| Mode M0 | |||
|---|---|---|---|
| Quadrant | BADHDUFLAG | Total packets | Discarded packets |
| A | 0 | 22224 | 1 |
| B | 0 | 15088 | 1 |
| C | 0 | 52496 | 7 |
| D | 0 | 19900 | 1 |
| Quadrant | Total seconds | Saturated seconds | Saturation percentage |
|---|---|---|---|
| A | 6810 | 311 | 4.566814% |
| B | 6810 | 280 | 4.111601% |
| C | 6809 | 5670 | 83.272140% |
| D | 6810 | 432 | 6.343612% |
Noise dominated data is calculated using 1-second bins in cleaned event files. If a bin has >2000 counts, and if more than 50% of those come from <1% of pixels, then it is considered to be noise-dominated and hence unusable.
| Quadrant | # 1 sec bins | Bins with >0 counts | Bins with >2000 counts | High rate bins dominated by noise | Noise dominated (total time) | Noise dominated (detector-on time) | Marked lightcurve |
|---|---|---|---|---|---|---|---|
| A | 7090 | 6810 | 10 | 10 | 0.14% | 0.15% | 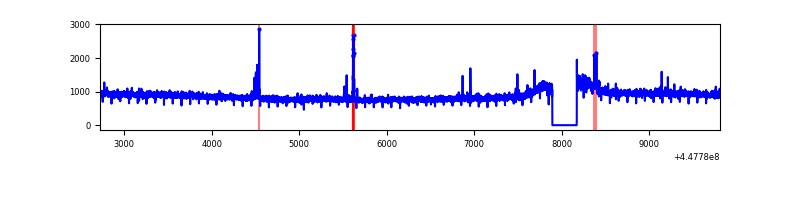 |
| B | 7090 | 6810 | 57 | 57 | 0.80% | 0.84% | 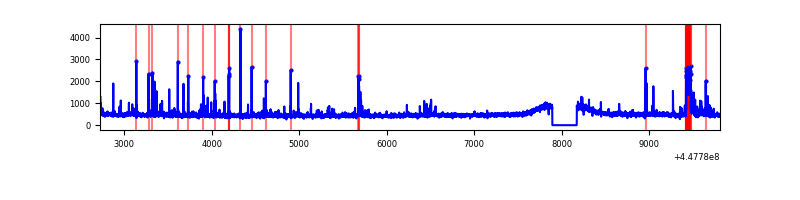 |
| C | 7088 | 6808 | 5687 | 5687 | 80.23% | 83.53% | 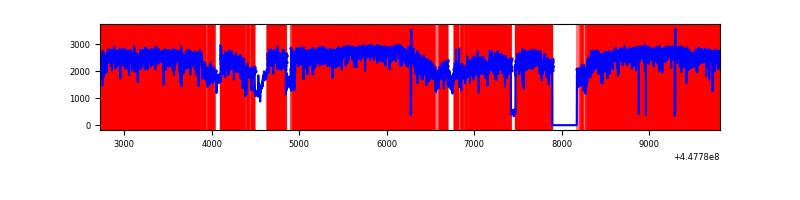 |
| D | 7090 | 6810 | 353 | 353 | 4.98% | 5.18% | 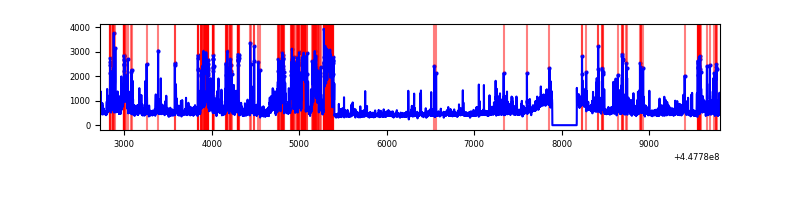 |
Top three noisy pixels from each quadrant. If the there are fewer than three noisy pixels in the level2.evt file, extra rows are filled as -1
| Pixel properties | Quadrant properties | ||||||
|---|---|---|---|---|---|---|---|
| Quadrant | DetID | PixID | Counts | Sigma | Mean | Median | Sigma |
| A | 10 | 83 | 2825658 | 17166.33 | 787 | 767 | 164.6 |
| A | 13 | 248 | 66405 | 398.87 | 787 | 767 | 164.6 |
| A | 0 | 243 | 15312 | 88.39 | 787 | 767 | 164.6 |
| B | 12 | 18 | 158527 | 1007.43 | 786 | 760 | 156.6 |
| B | 3 | 112 | 116761 | 740.73 | 786 | 760 | 156.6 |
| B | 0 | 186 | 47258 | 296.92 | 786 | 760 | 156.6 |
| C | 9 | 54 | 14194484 | 128944.99 | 467 | 469 | 110.1 |
| C | 14 | 254 | 70944 | 640.23 | 467 | 469 | 110.1 |
| C | 3 | 233 | 13053 | 114.32 | 467 | 469 | 110.1 |
| D | 2 | 165 | 1127963 | 5775.06 | 765 | 740 | 195.2 |
| D | 1 | 52 | 419994 | 2147.95 | 765 | 740 | 195.2 |
| D | 13 | 249 | 188435 | 961.61 | 765 | 740 | 195.2 |
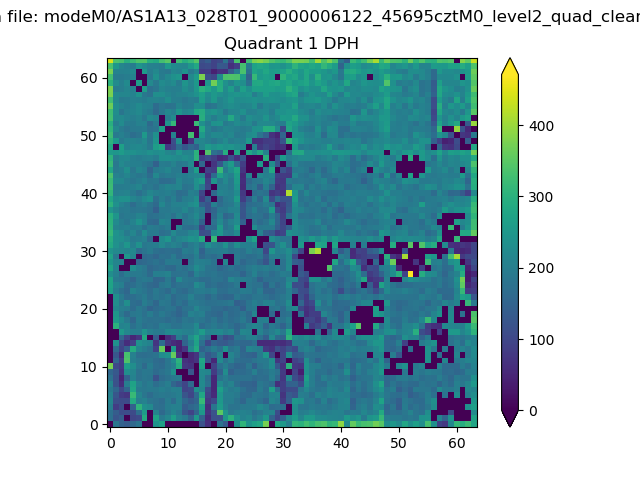
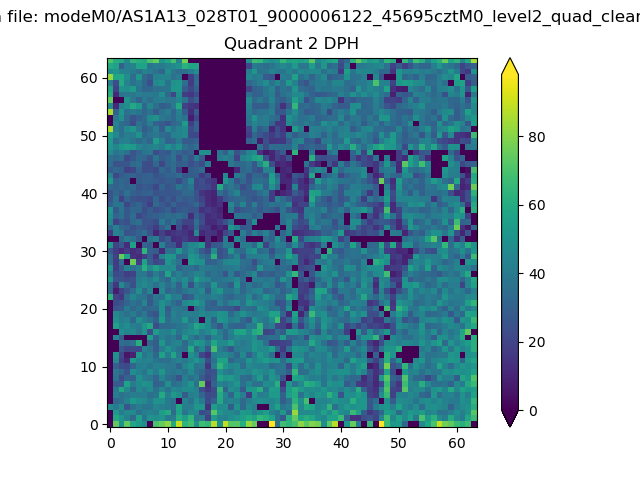
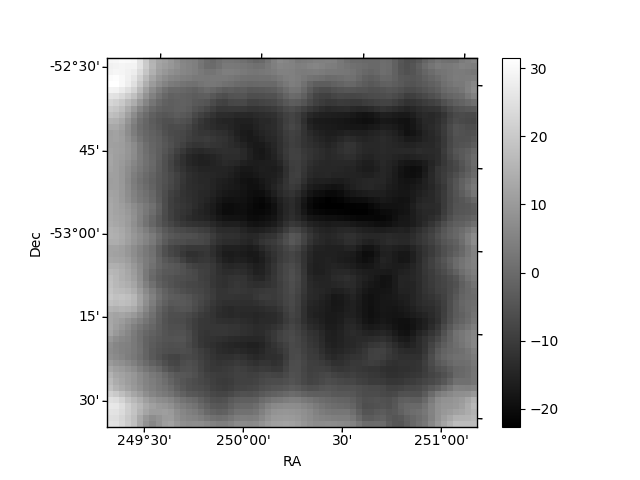
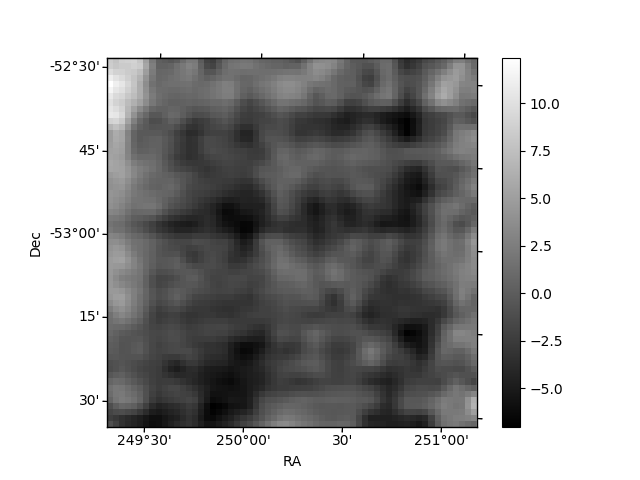
Histogram calculated using DETX and DETY for each event in the final _common_clean file
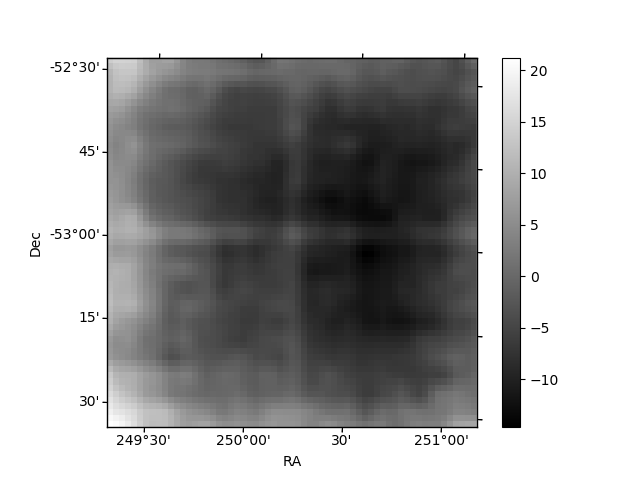
| Quadrant A |  |
 |
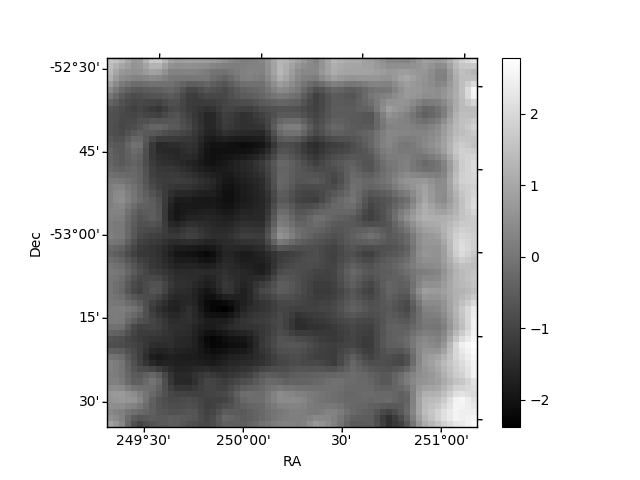
Quadrant B |
|---|---|---|---|
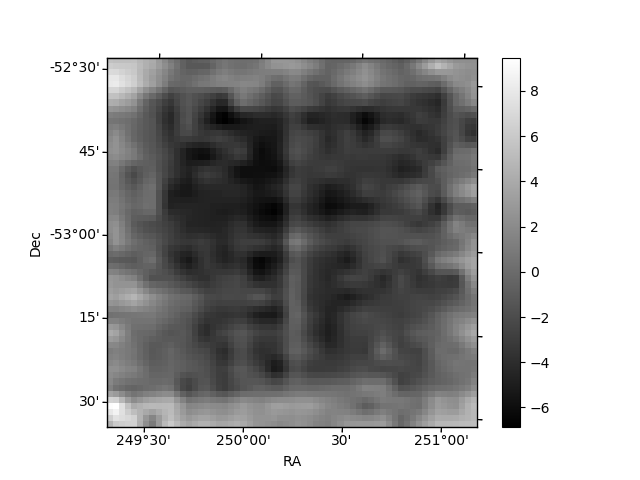
| Quadrant D | 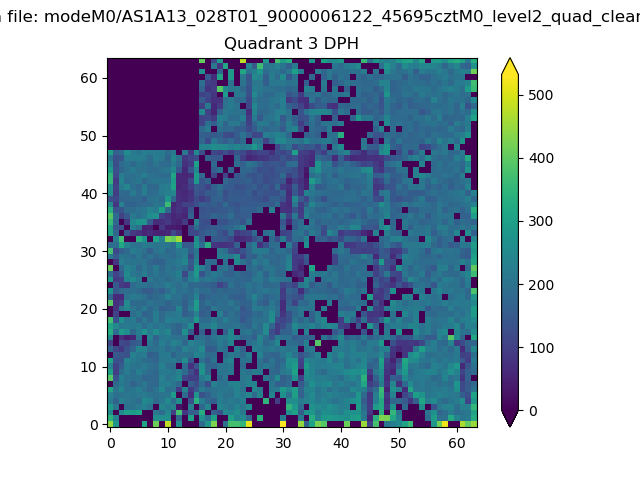 |
 |
Quadrant C |
| Plot type | Count rate plots | Images |
|---|---|---|
| Comparison with Poisson distribution Blue bars denote a histogram of data divided into 1 sec bins. Red curve is a Poisson curve with rate = median count rate of data. |
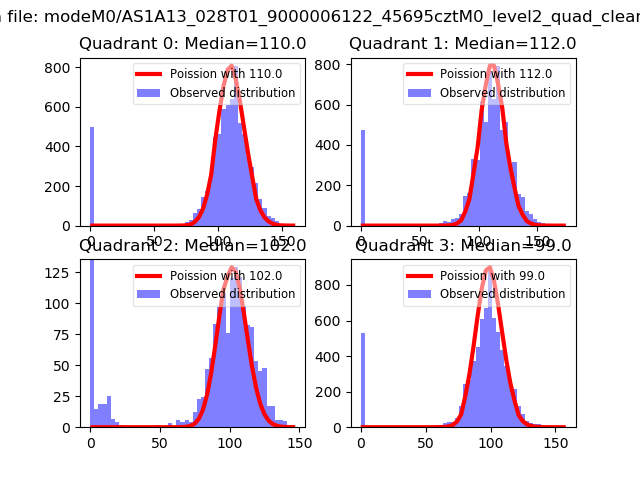 |
 |
| Quadrant-wise count rates Data is divided into 100 sec bins |
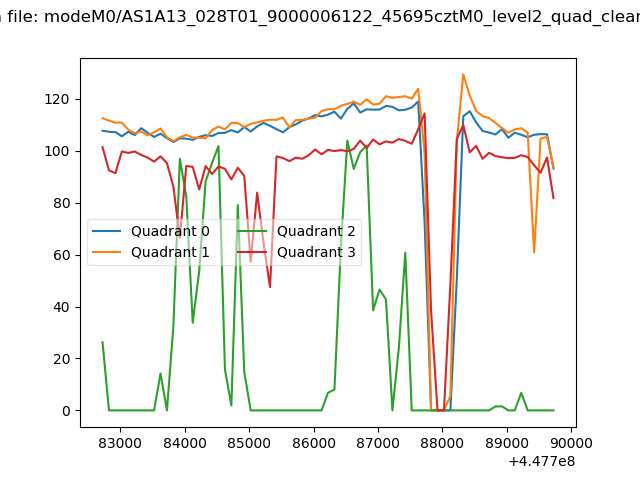 |
|
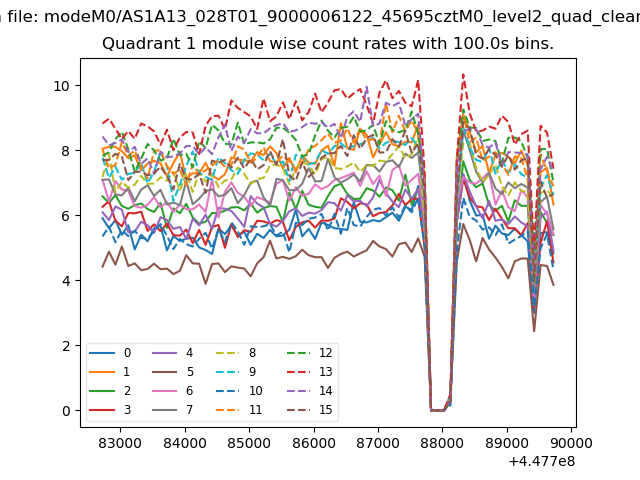
| Module-wise count rates for Quadrant A Data is divided into 100 sec bins |
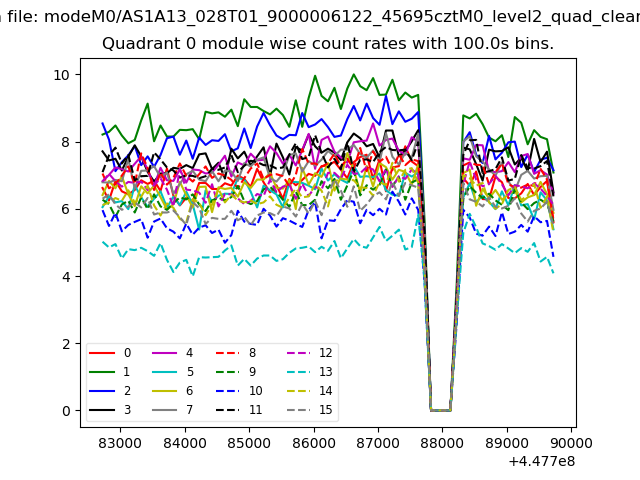 |
 |
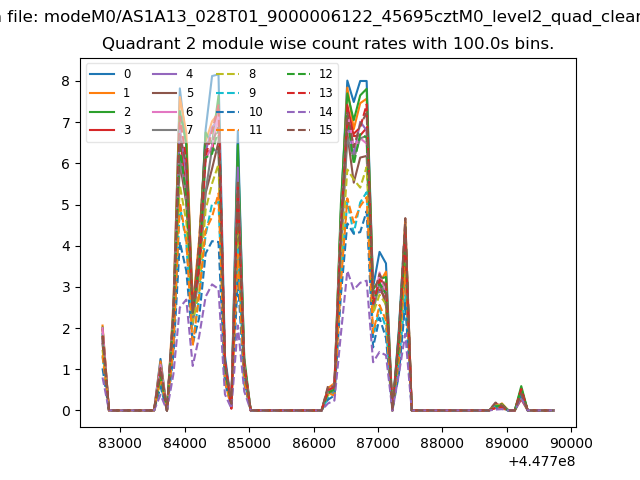
| Module-wise count rates for Quadrant B Data is divided into 100 sec bins |
 |
 |
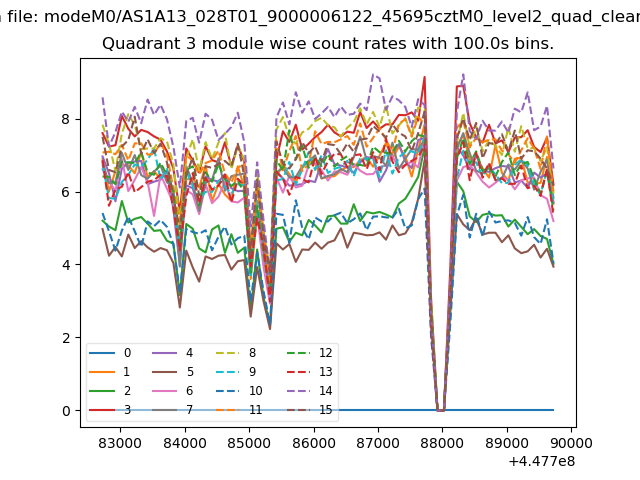
| Module-wise count rates for Quadrant C Data is divided into 100 sec bins |
 |
 |
| Module-wise count rates for Quadrant D Data is divided into 100 sec bins |
 |
 |
| Parameter | Plot |
|---|---|
| CZT HV Monitor | 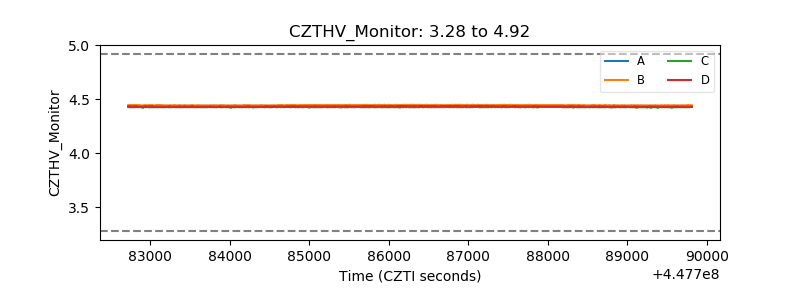 |
| D_VDD | 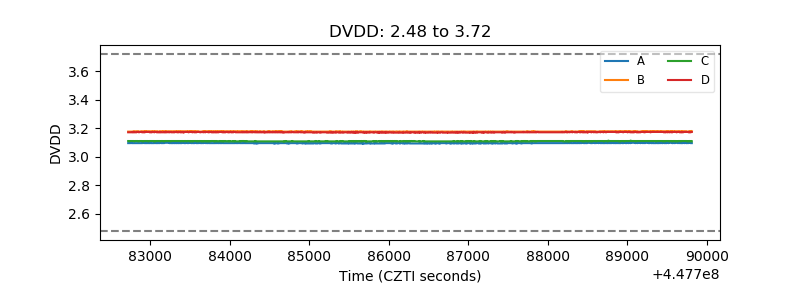 |
| Temperature 1 | 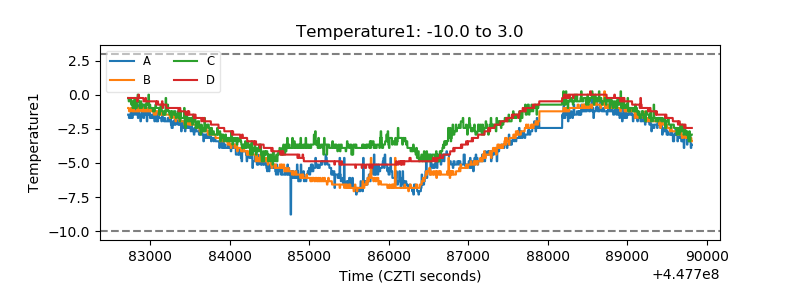 |
| Veto HV Monitor | 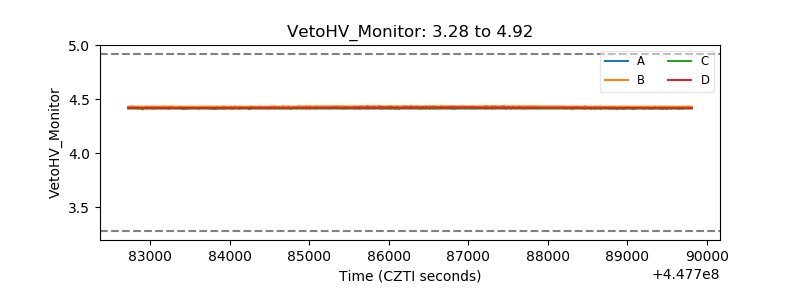 |
| Veto LLD | 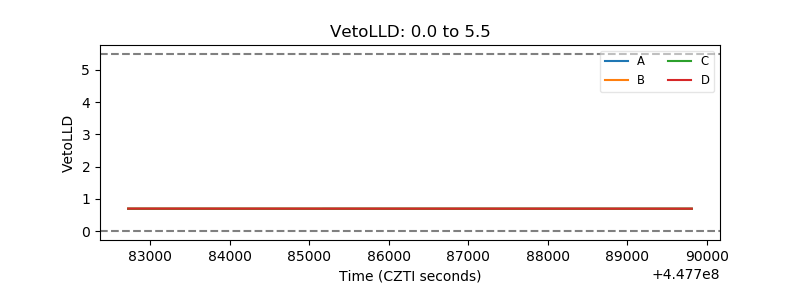 |
| Alpha Counter | 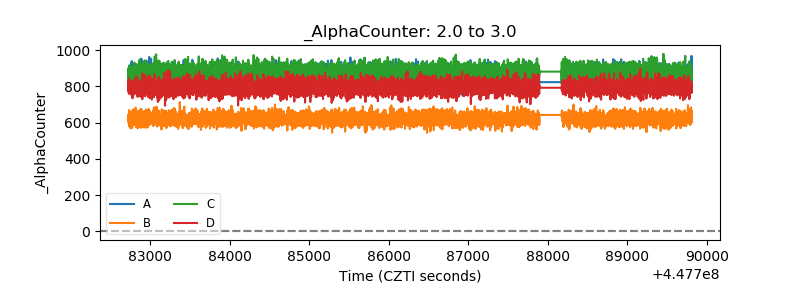 |
| _CPM_Rate | 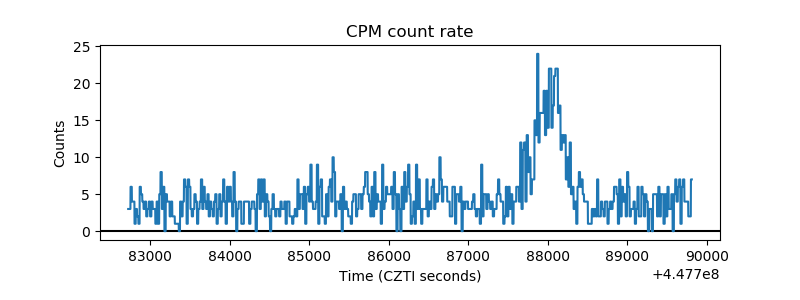 |
| CZT Counter | 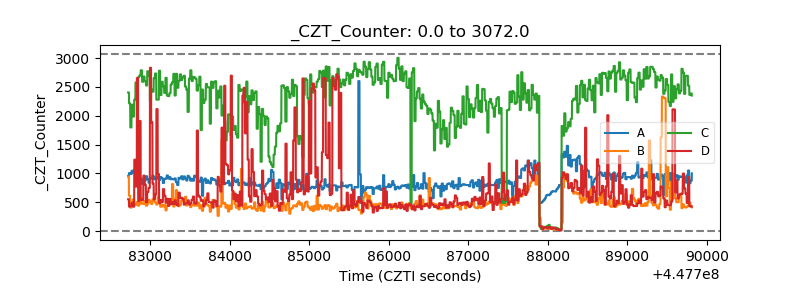 |
| +2.5 Volts monitor | 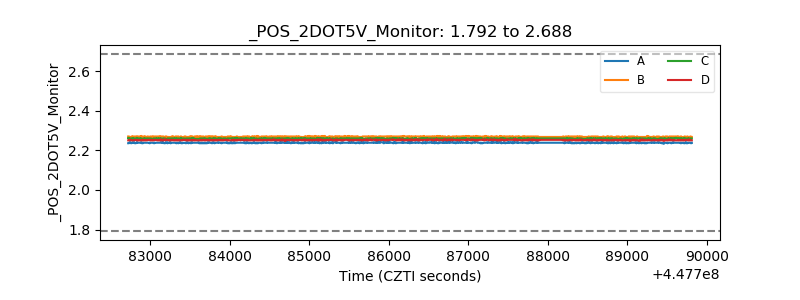 |
| +5 Volts monitor | 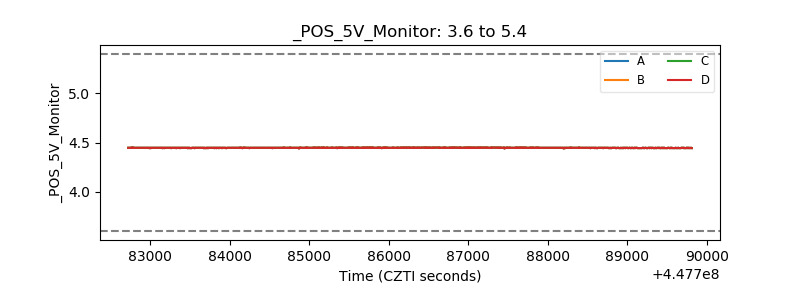 |
| _ROLL_ROT | 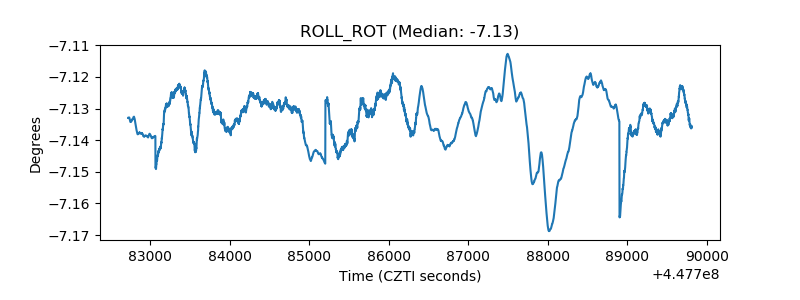 |
| _Roll_DEC | 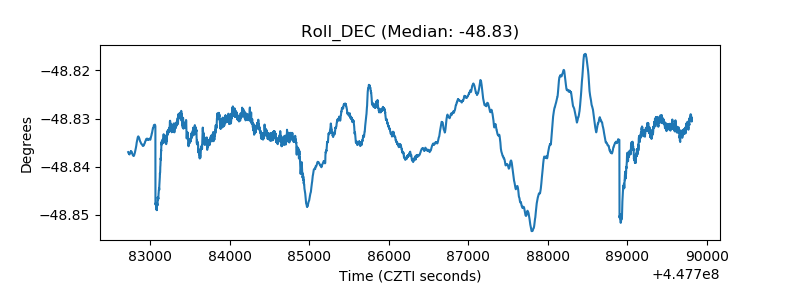 |
| _Roll_RA | 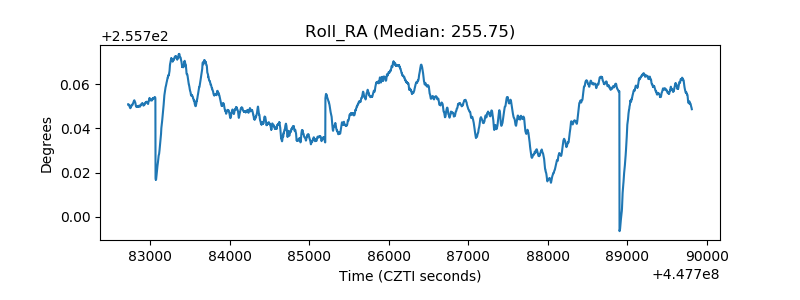 |
| Veto Counter | 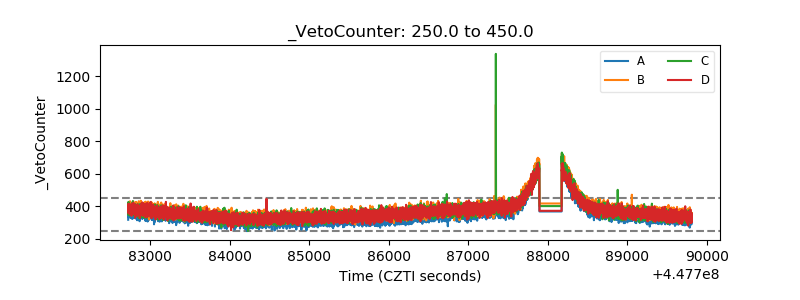 |