| Param | Original file | Final file |
|---|---|---|
| Filename | modeM0/AS1A13_028T01_9000006122_45696cztM0_level2.fits | modeM0/AS1A13_028T01_9000006122_45696cztM0_level2_quad_clean.evt |
| Size (bytes) | 740,969,280 | 106,424,640 |
| Size | 706.6 MB | 101.5 MB |
| Events in quadrant A | 6,364,642 | 793,740 |
| Events in quadrant B | 3,628,861 | 805,400 |
| Events in quadrant C | 11,598,319 | 420,290 |
| Events in quadrant D | 5,270,867 | 694,768 |
| Mode SS | |||
|---|---|---|---|
| Quadrant | BADHDUFLAG | Total packets | Discarded packets |
| A | 0 | 146 | 0 |
| B | 0 | 146 | 0 |
| C | 0 | 146 | 0 |
| D | 0 | 146 | 0 |
| Mode M0 | |||
|---|---|---|---|
| Quadrant | BADHDUFLAG | Total packets | Discarded packets |
| A | 0 | 23860 | 0 |
| B | 0 | 15857 | 0 |
| C | 0 | 39407 | 0 |
| D | 0 | 20659 | 0 |
| Quadrant | Total seconds | Saturated seconds | Saturation percentage |
|---|---|---|---|
| A | 7299 | 118 | 1.616660% |
| B | 7299 | 90 | 1.233046% |
| C | 7299 | 3540 | 48.499794% |
| D | 7299 | 323 | 4.425264% |
Noise dominated data is calculated using 1-second bins in cleaned event files. If a bin has >2000 counts, and if more than 50% of those come from <1% of pixels, then it is considered to be noise-dominated and hence unusable.
| Quadrant | # 1 sec bins | Bins with >0 counts | Bins with >2000 counts | High rate bins dominated by noise | Noise dominated (total time) | Noise dominated (detector-on time) | Marked lightcurve |
|---|---|---|---|---|---|---|---|
| A | 7299 | 7299 | 16 | 16 | 0.22% | 0.22% | 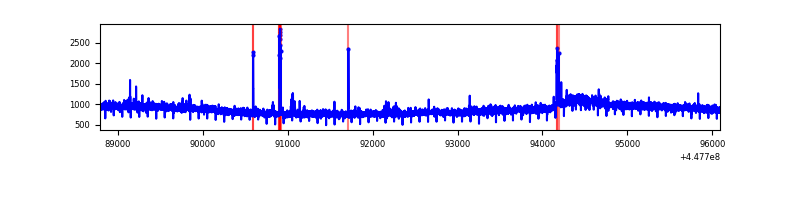 |
| B | 7299 | 7299 | 53 | 53 | 0.73% | 0.73% | 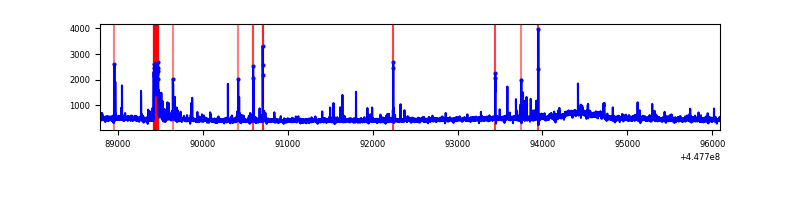 |
| C | 7299 | 7299 | 3590 | 3590 | 49.18% | 49.18% | 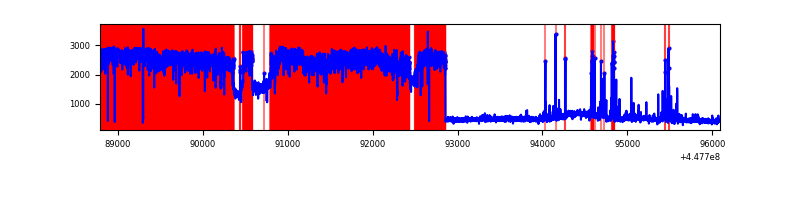 |
| D | 7299 | 7299 | 283 | 283 | 3.88% | 3.88% | 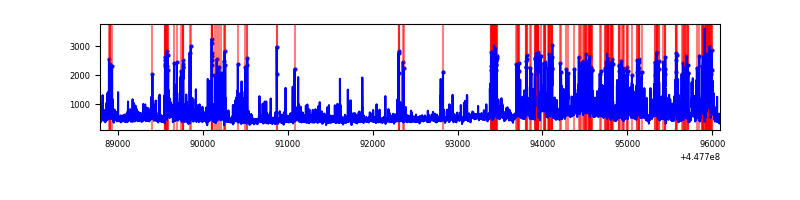 |
Top three noisy pixels from each quadrant. If the there are fewer than three noisy pixels in the level2.evt file, extra rows are filled as -1
| Pixel properties | Quadrant properties | ||||||
|---|---|---|---|---|---|---|---|
| Quadrant | DetID | PixID | Counts | Sigma | Mean | Median | Sigma |
| A | 10 | 83 | 3071930 | 17788.49 | 825 | 807 | 172.6 |
| A | 13 | 248 | 77059 | 441.67 | 825 | 807 | 172.6 |
| A | 0 | 243 | 17950 | 99.3 | 825 | 807 | 172.6 |
| B | 12 | 18 | 155328 | 953.15 | 822 | 797 | 162.1 |
| B | 3 | 112 | 70046 | 427.13 | 822 | 797 | 162.1 |
| B | 5 | 172 | 40695 | 246.09 | 822 | 797 | 162.1 |
| C | 9 | 54 | 8782979 | 57363.34 | 644 | 647 | 153.1 |
| C | 14 | 254 | 201225 | 1310.11 | 644 | 647 | 153.1 |
| C | 3 | 233 | 78168 | 506.34 | 644 | 647 | 153.1 |
| D | 1 | 52 | 1455953 | 7186.72 | 797 | 770 | 202.5 |
| D | 2 | 249 | 255380 | 1257.44 | 797 | 770 | 202.5 |
| D | 13 | 171 | 116633 | 572.21 | 797 | 770 | 202.5 |
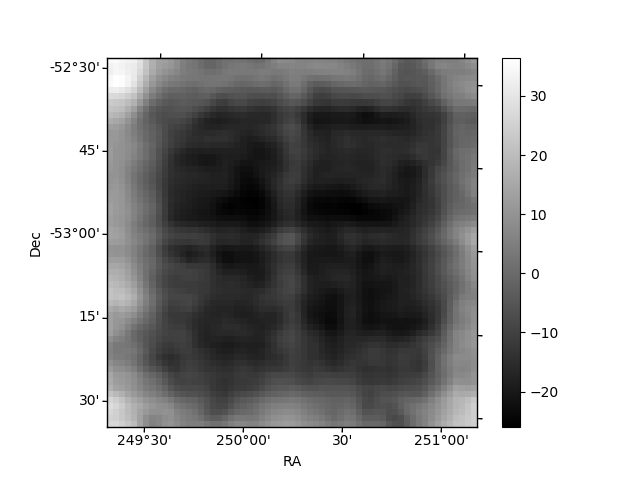
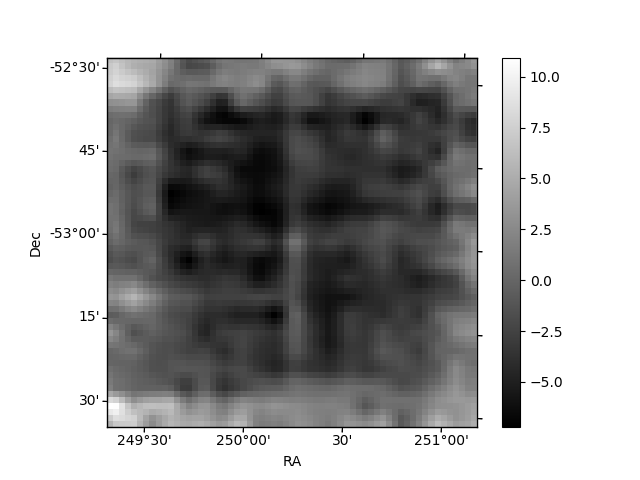
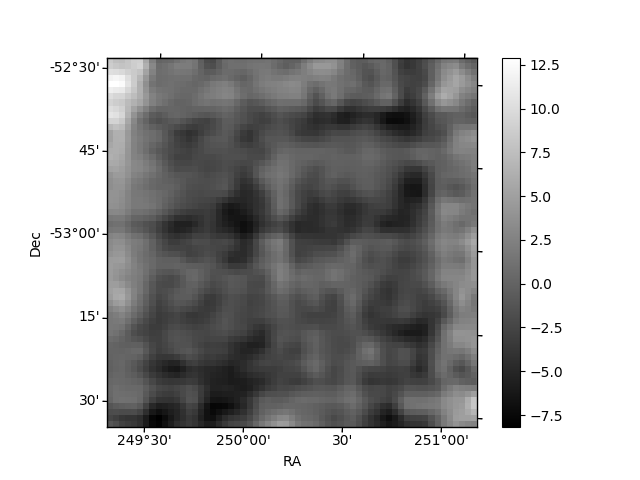
Histogram calculated using DETX and DETY for each event in the final _common_clean file
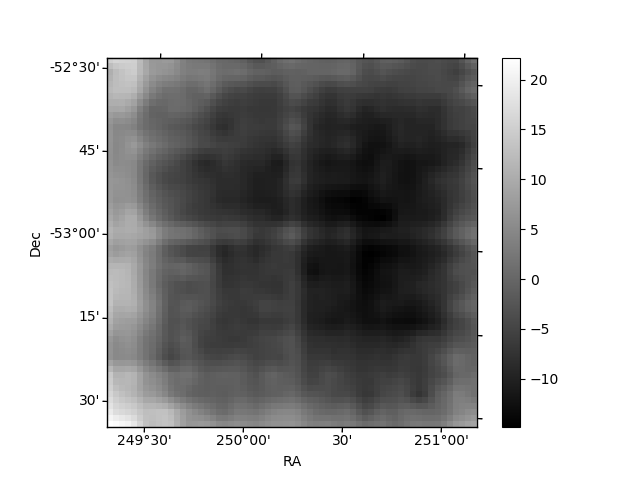
| Quadrant A | 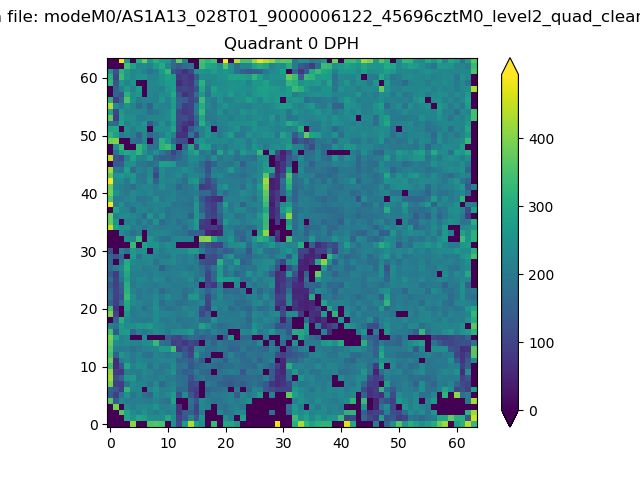 |
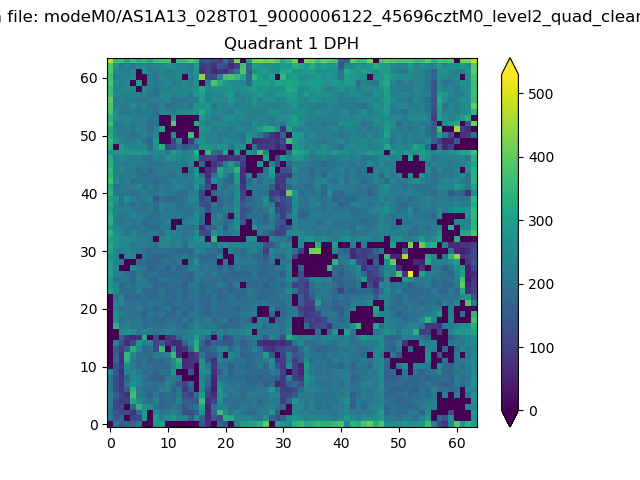 |
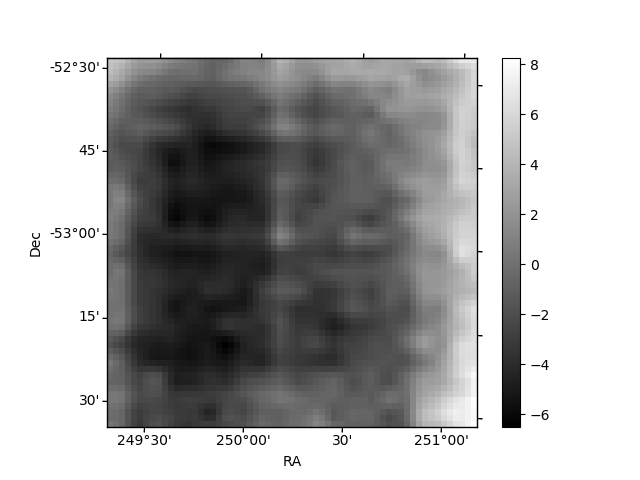
Quadrant B |
|---|---|---|---|
| Quadrant D |  |
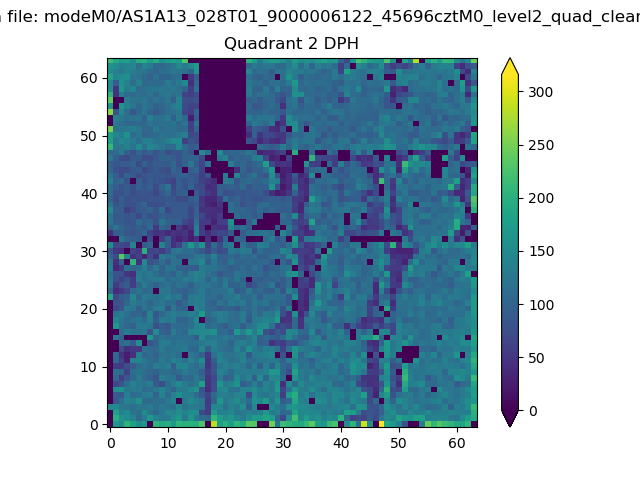 |
Quadrant C |
| Plot type | Count rate plots | Images |
|---|---|---|
| Comparison with Poisson distribution Blue bars denote a histogram of data divided into 1 sec bins. Red curve is a Poisson curve with rate = median count rate of data. |
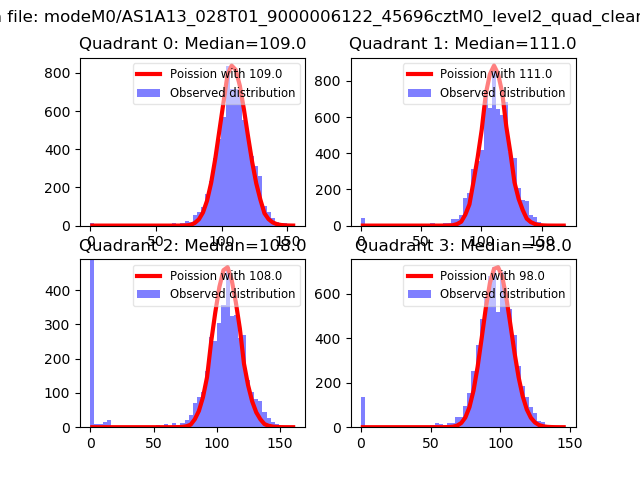 |
 |
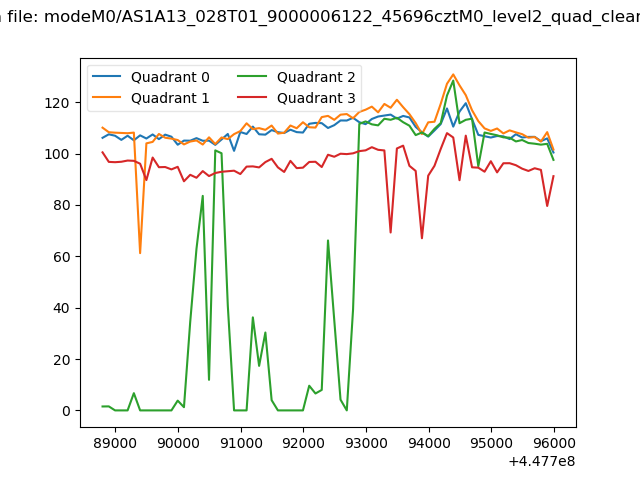
| Quadrant-wise count rates Data is divided into 100 sec bins |
 |
|
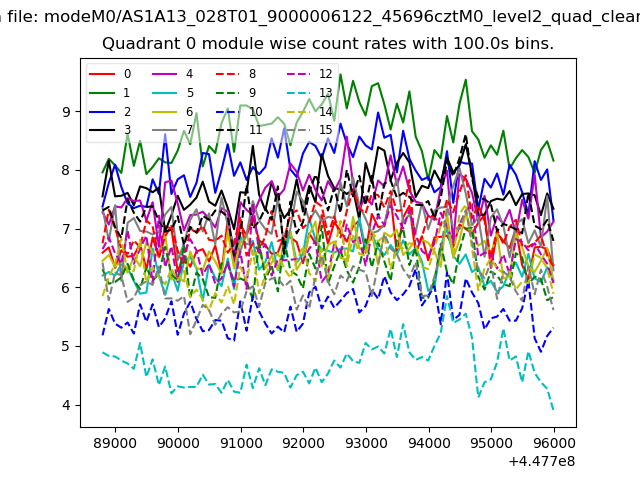
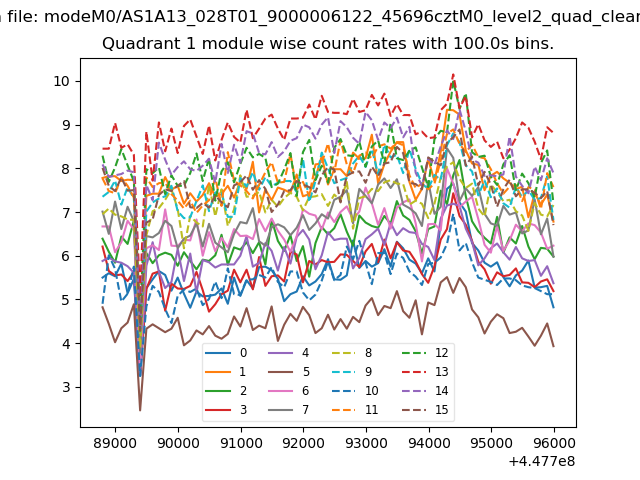
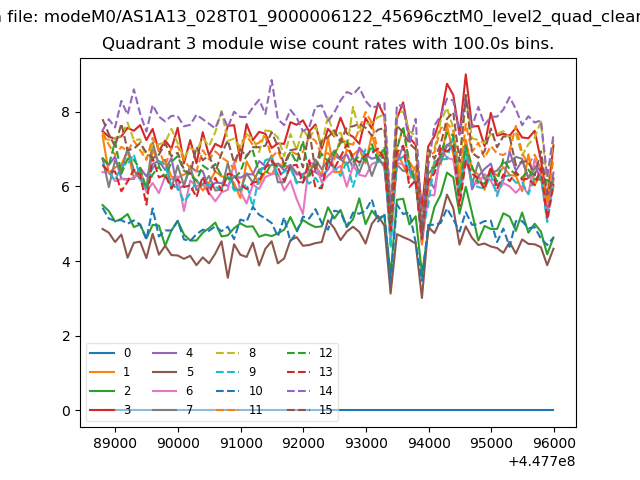
| Module-wise count rates for Quadrant A Data is divided into 100 sec bins |
 |
 |
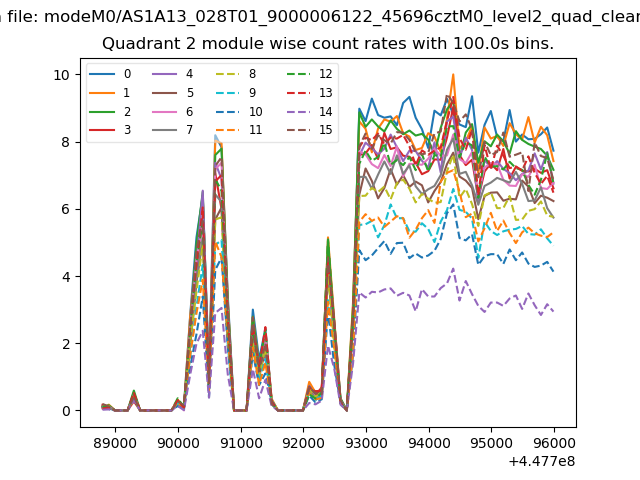
| Module-wise count rates for Quadrant B Data is divided into 100 sec bins |
 |
 |
| Module-wise count rates for Quadrant C Data is divided into 100 sec bins |
 |
 |
| Module-wise count rates for Quadrant D Data is divided into 100 sec bins |
 |
 |
| Parameter | Plot |
|---|---|
| CZT HV Monitor | 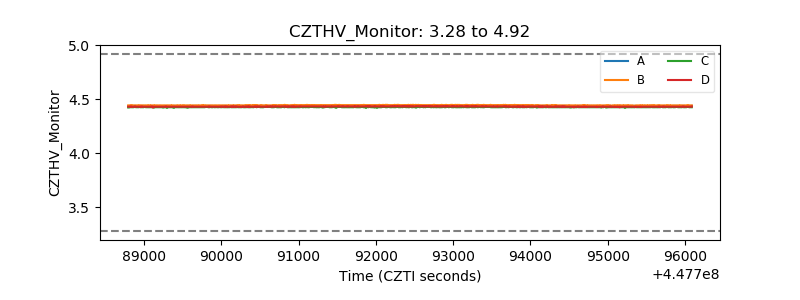 |
| D_VDD | 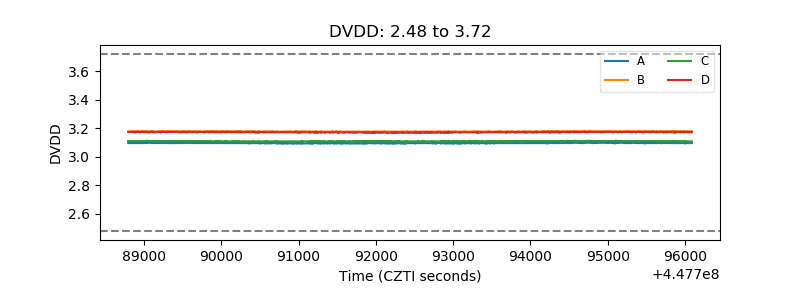 |
| Temperature 1 | 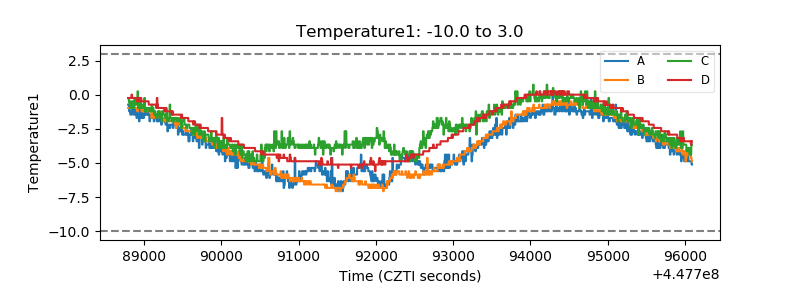 |
| Veto HV Monitor | 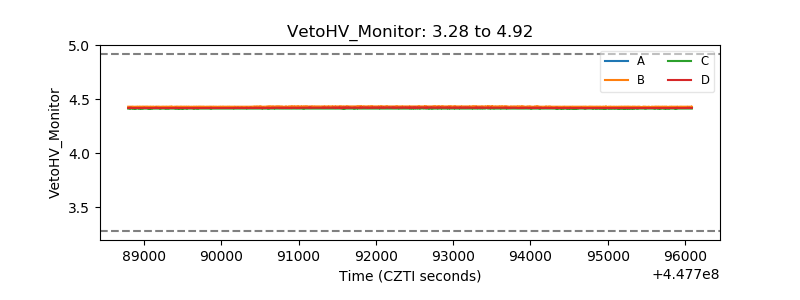 |
| Veto LLD | 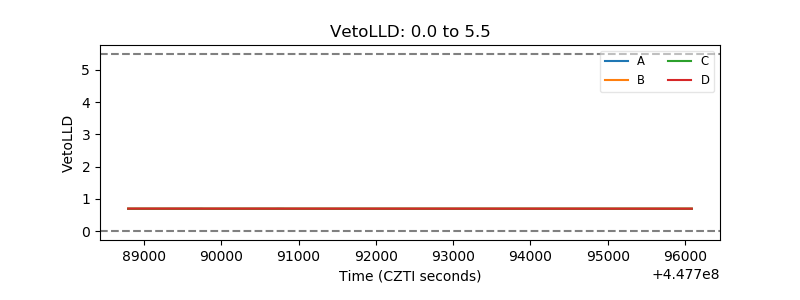 |
| Alpha Counter |  |
| _CPM_Rate | 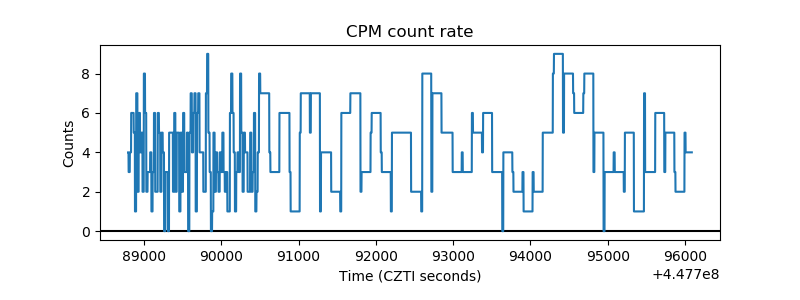 |
| CZT Counter | 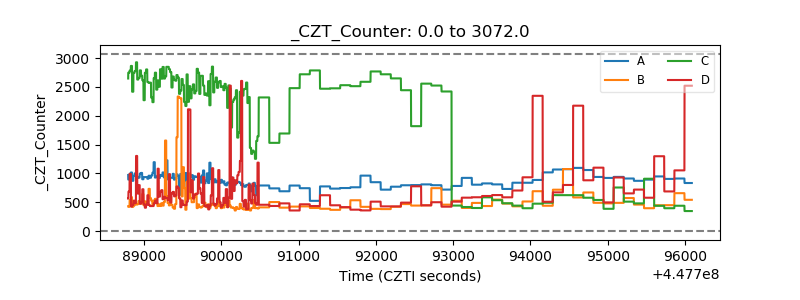 |
| +2.5 Volts monitor | 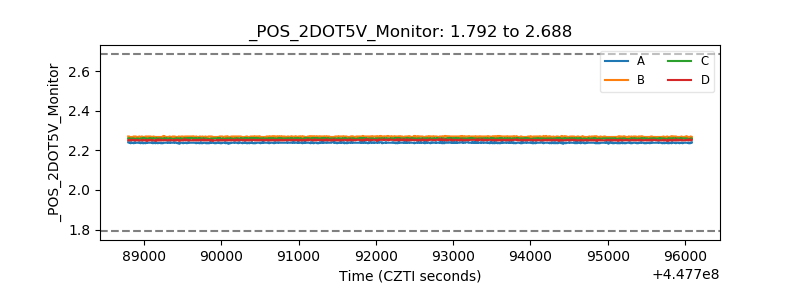 |
| +5 Volts monitor | 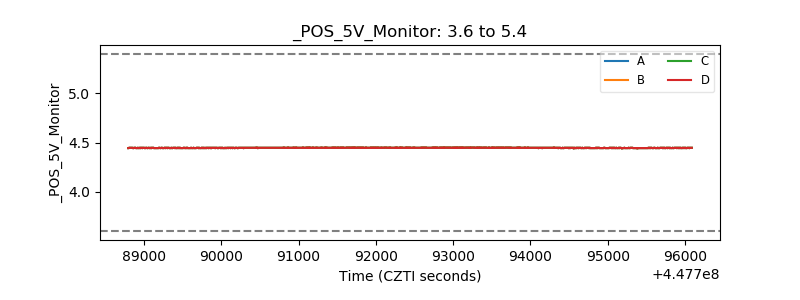 |
| _ROLL_ROT | 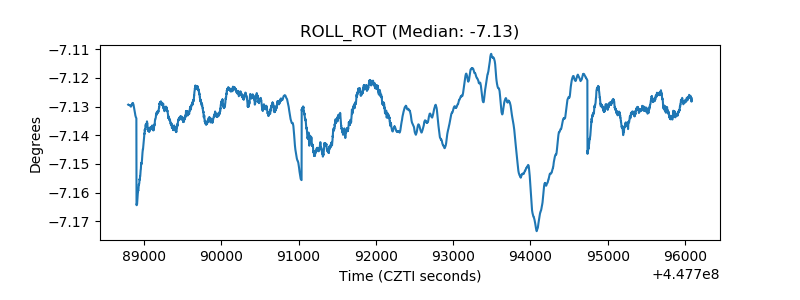 |
| _Roll_DEC | 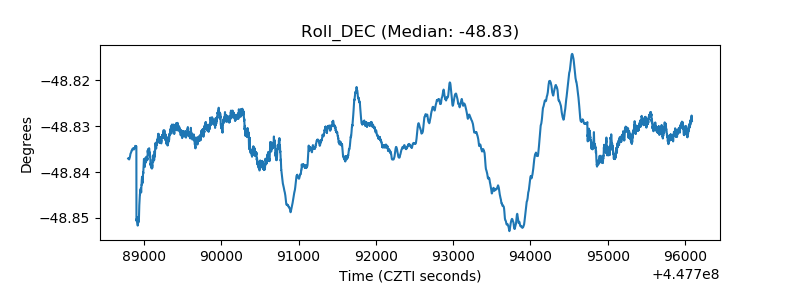 |
| _Roll_RA | 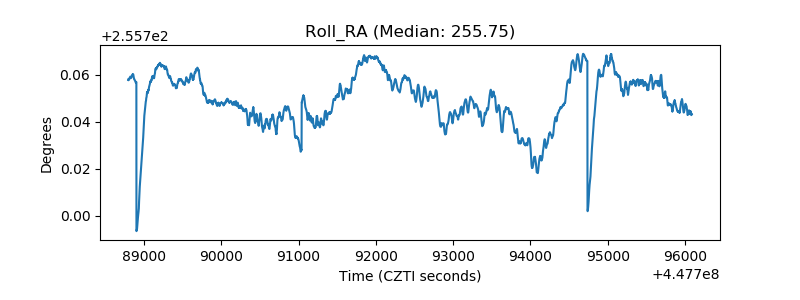 |
| Veto Counter | 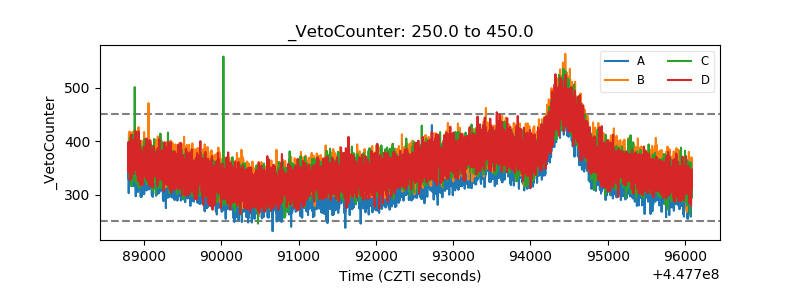 |