| Param | Original file | Final file |
|---|---|---|
| Filename | modeM0/AS1A13_028T01_9000006122_45703cztM0_level2.fits | modeM0/AS1A13_028T01_9000006122_45703cztM0_level2_quad_clean.evt |
| Size (bytes) | 243,478,080 | 61,079,040 |
| Size | 232.2 MB | 58.2 MB |
| Events in quadrant A | 3,124,572 | 405,240 |
| Events in quadrant B | 1,791,212 | 416,999 |
| Events in quadrant C | 1,690,531 | 397,656 |
| Events in quadrant D | 2,108,317 | 359,958 |
| Mode SS | |||
|---|---|---|---|
| Quadrant | BADHDUFLAG | Total packets | Discarded packets |
| A | 0 | 76 | 0 |
| B | 0 | 76 | 2 |
| C | 0 | 76 | 0 |
| D | 0 | 76 | 0 |
| Mode M0 | |||
|---|---|---|---|
| Quadrant | BADHDUFLAG | Total packets | Discarded packets |
| A | 0 | 12245 | 216 |
| B | 0 | 8213 | 93 |
| C | 0 | 8092 | 97 |
| D | 0 | 9028 | 138 |
| Quadrant | Total seconds | Saturated seconds | Saturation percentage |
|---|---|---|---|
| A | 3801 | 38 | 0.999737% |
| B | 3830 | 21 | 0.548303% |
| C | 3827 | 13 | 0.339692% |
| D | 3804 | 51 | 1.340694% |
Noise dominated data is calculated using 1-second bins in cleaned event files. If a bin has >2000 counts, and if more than 50% of those come from <1% of pixels, then it is considered to be noise-dominated and hence unusable.
| Quadrant | # 1 sec bins | Bins with >0 counts | Bins with >2000 counts | High rate bins dominated by noise | Noise dominated (total time) | Noise dominated (detector-on time) | Marked lightcurve |
|---|---|---|---|---|---|---|---|
| A | 3887 | 3867 | 2 | 2 | 0.05% | 0.05% | 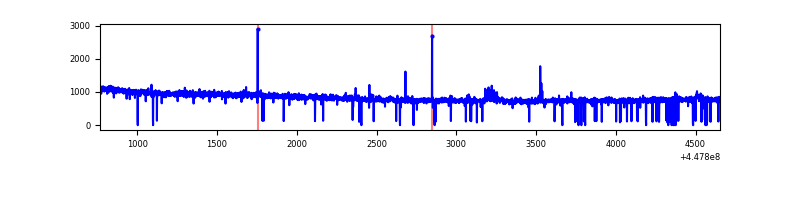 |
| B | 3887 | 3872 | 12 | 12 | 0.31% | 0.31% | 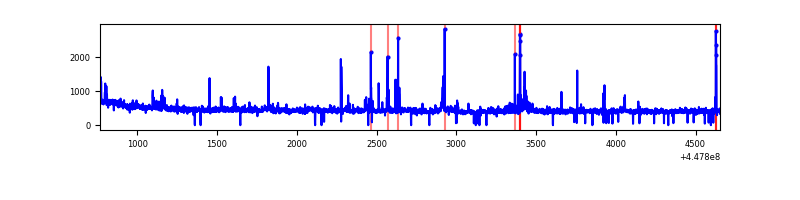 |
| C | 3887 | 3876 | 6 | 6 | 0.15% | 0.15% | 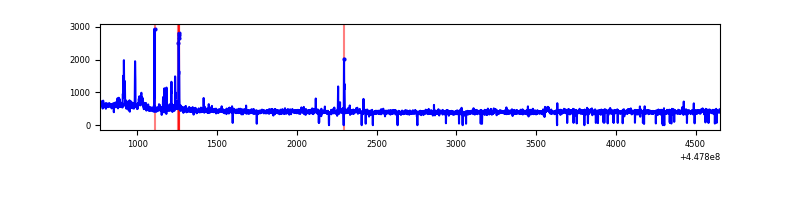 |
| D | 3887 | 3869 | 47 | 47 | 1.21% | 1.21% | 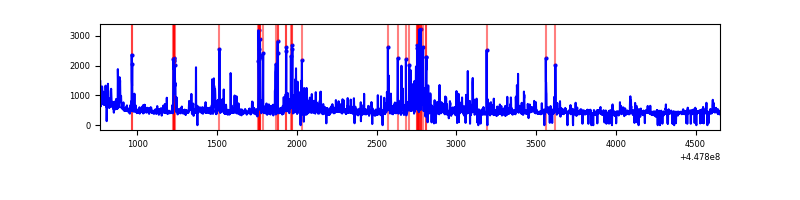 |
Top three noisy pixels from each quadrant. If the there are fewer than three noisy pixels in the level2.evt file, extra rows are filled as -1
| Pixel properties | Quadrant properties | ||||||
|---|---|---|---|---|---|---|---|
| Quadrant | DetID | PixID | Counts | Sigma | Mean | Median | Sigma |
| A | 10 | 83 | 1527655 | 17780.85 | 404 | 396 | 85.9 |
| A | 13 | 248 | 24629 | 282.13 | 404 | 396 | 85.9 |
| A | 13 | 254 | 7007 | 76.97 | 404 | 396 | 85.9 |
| B | 5 | 172 | 60522 | 735.33 | 411 | 398 | 81.8 |
| B | 3 | 112 | 49311 | 598.22 | 411 | 398 | 81.8 |
| B | 12 | 18 | 10394 | 122.25 | 411 | 398 | 81.8 |
| C | 3 | 233 | 52424 | 541.48 | 402 | 405 | 96.1 |
| C | 14 | 254 | 42407 | 437.21 | 402 | 405 | 96.1 |
| C | 11 | 16 | 12409 | 124.95 | 402 | 405 | 96.1 |
| D | 1 | 52 | 211812 | 2112.0 | 392 | 379 | 100.1 |
| D | 13 | 249 | 98193 | 977.06 | 392 | 379 | 100.1 |
| D | 12 | 1 | 78740 | 782.75 | 392 | 379 | 100.1 |
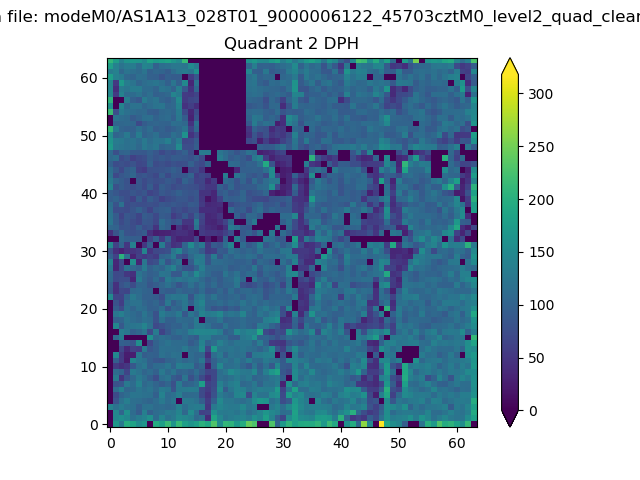
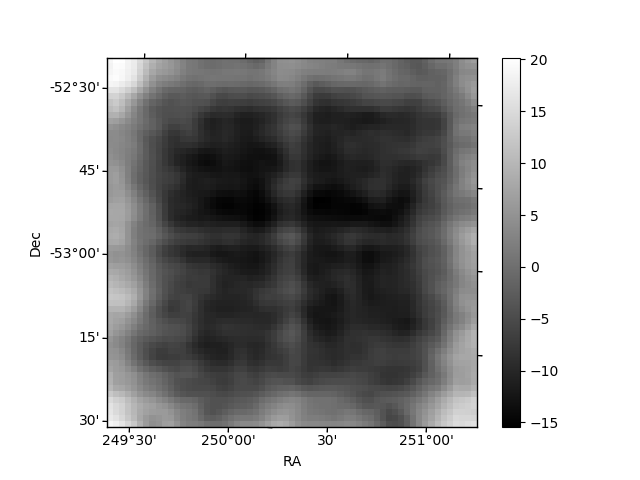
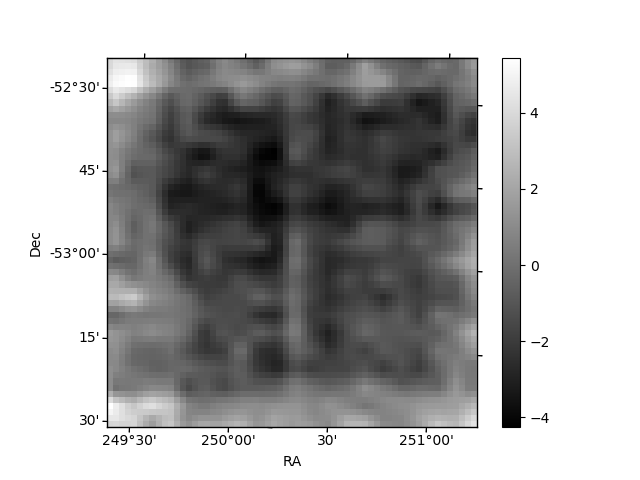
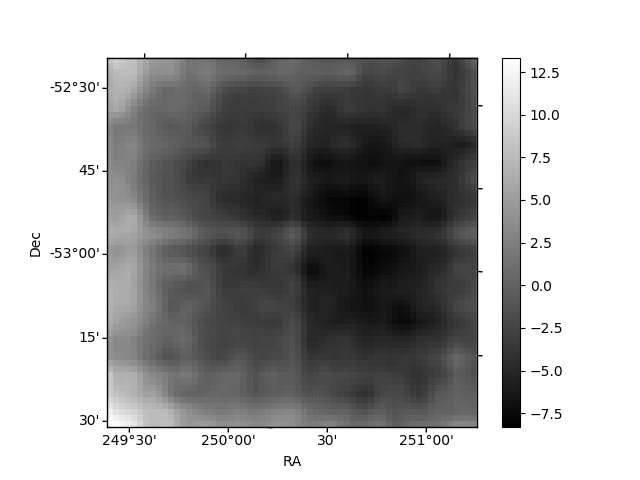
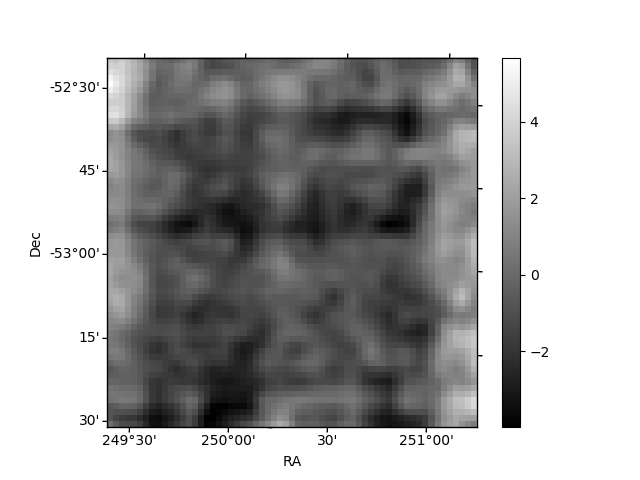
Histogram calculated using DETX and DETY for each event in the final _common_clean file
| Quadrant A | 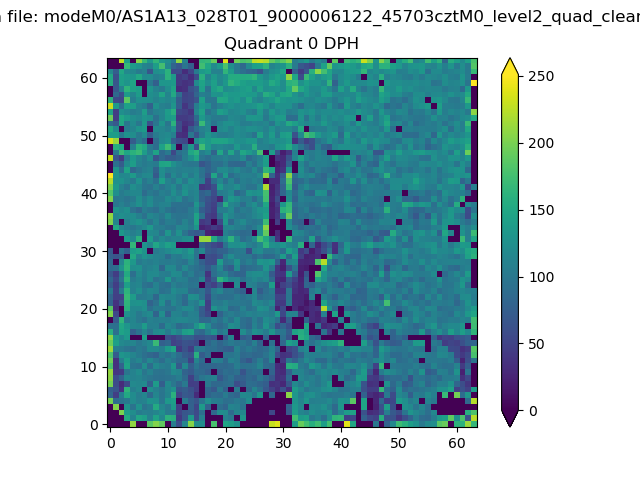 |
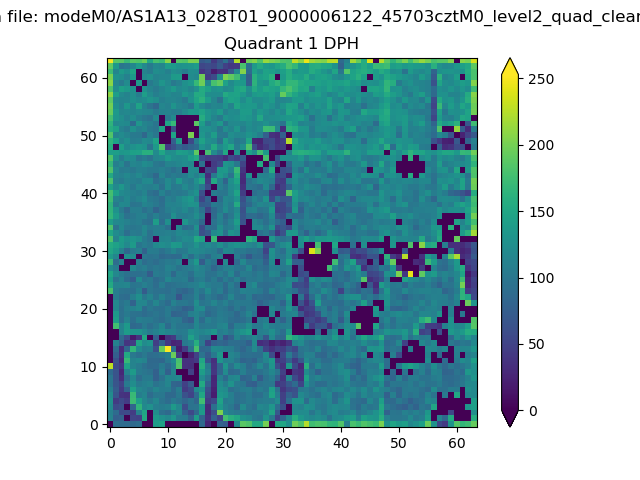 |
Quadrant B |
|---|---|---|---|
| Quadrant D | 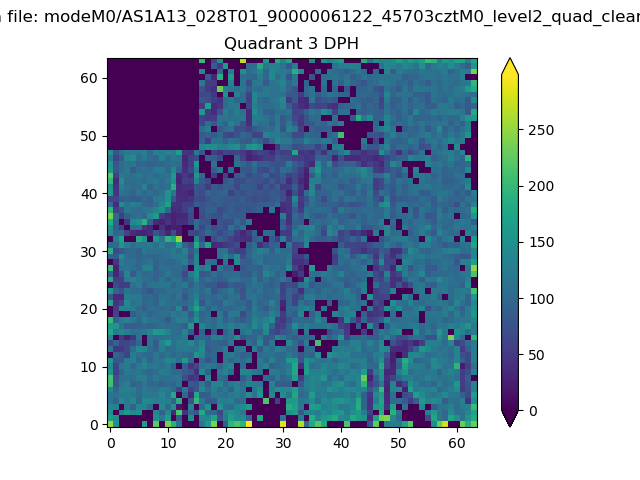 |
 |
Quadrant C |
| Plot type | Count rate plots | Images |
|---|---|---|
| Comparison with Poisson distribution Blue bars denote a histogram of data divided into 1 sec bins. Red curve is a Poisson curve with rate = median count rate of data. |
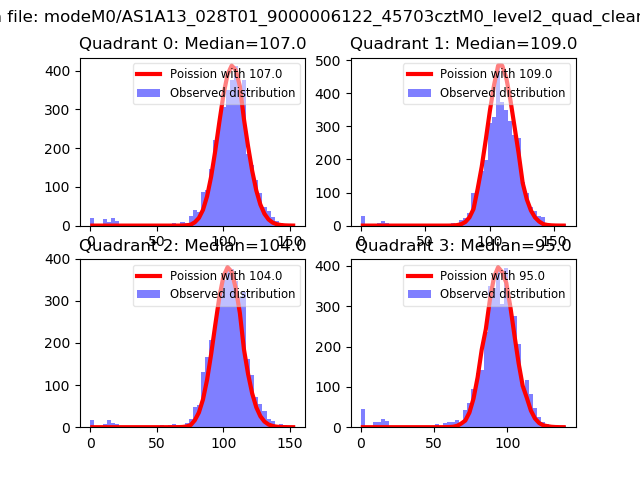 |
 |
| Quadrant-wise count rates Data is divided into 100 sec bins |
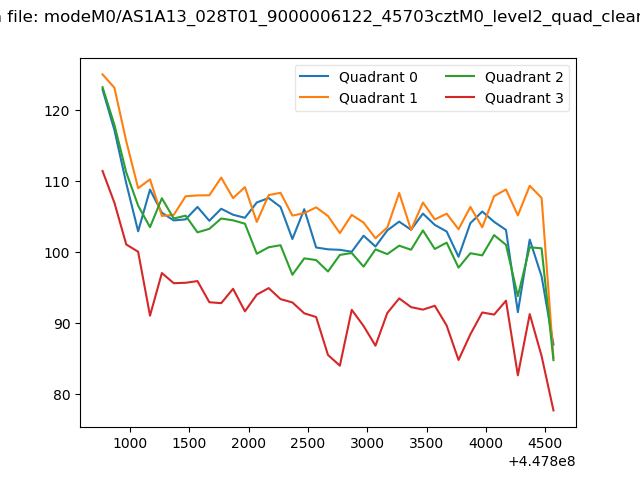 |
|
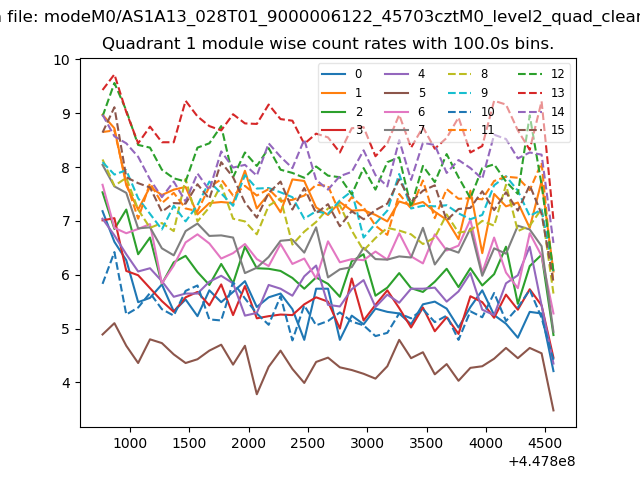
| Module-wise count rates for Quadrant A Data is divided into 100 sec bins |
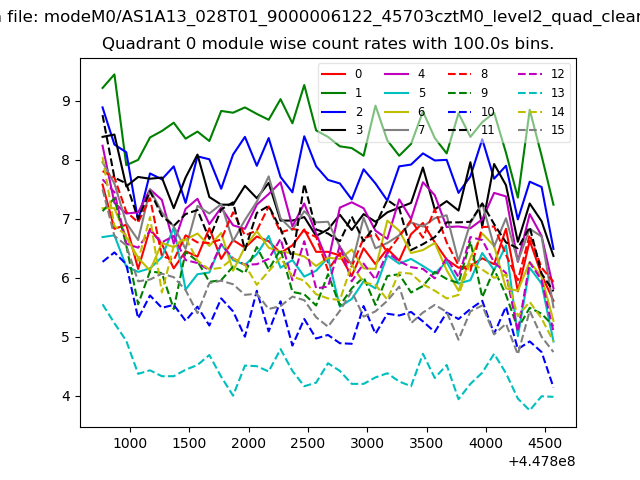 |
 |
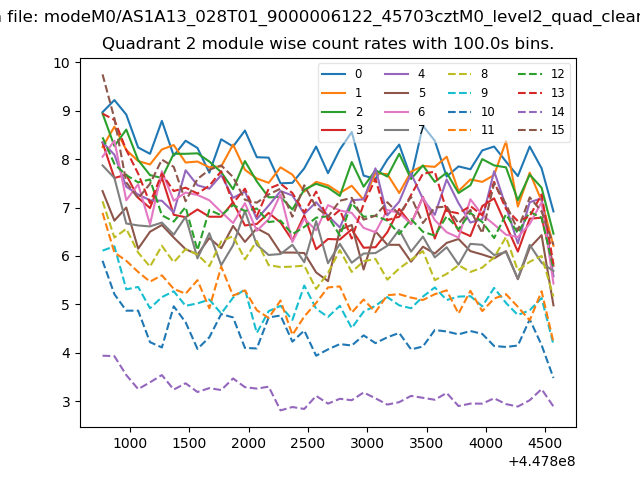
| Module-wise count rates for Quadrant B Data is divided into 100 sec bins |
 |
 |
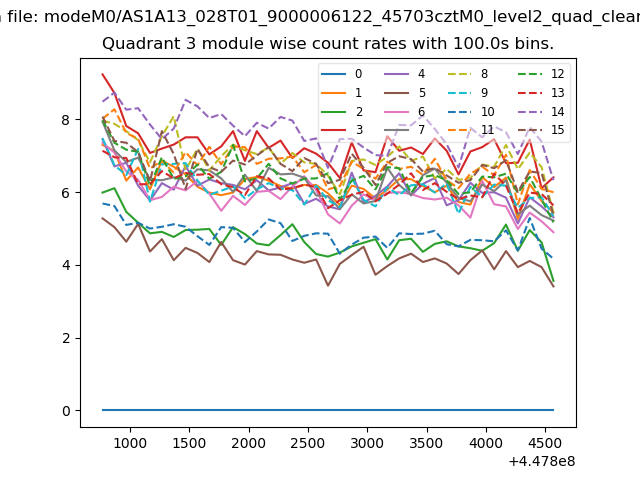
| Module-wise count rates for Quadrant C Data is divided into 100 sec bins |
 |
 |
| Module-wise count rates for Quadrant D Data is divided into 100 sec bins |
 |
 |
| Parameter | Plot |
|---|---|
| CZT HV Monitor | 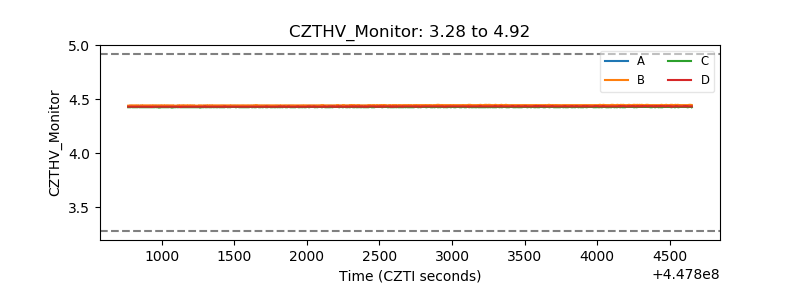 |
| D_VDD | 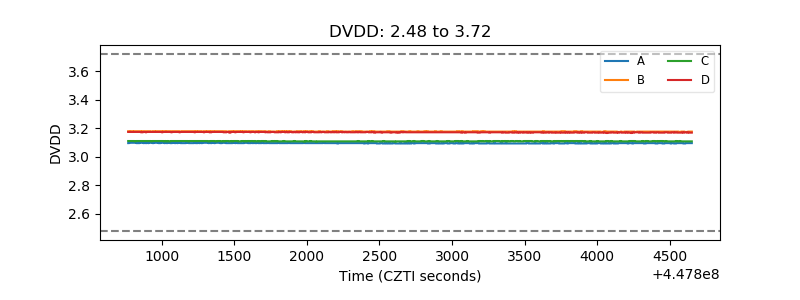 |
| Temperature 1 | 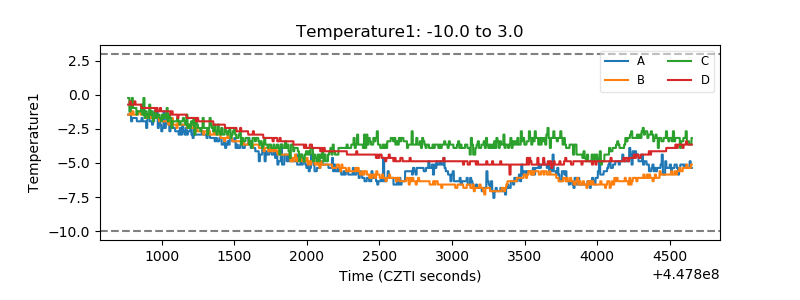 |
| Veto HV Monitor | 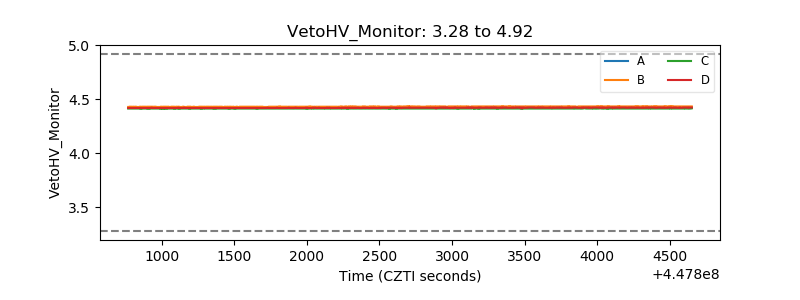 |
| Veto LLD | 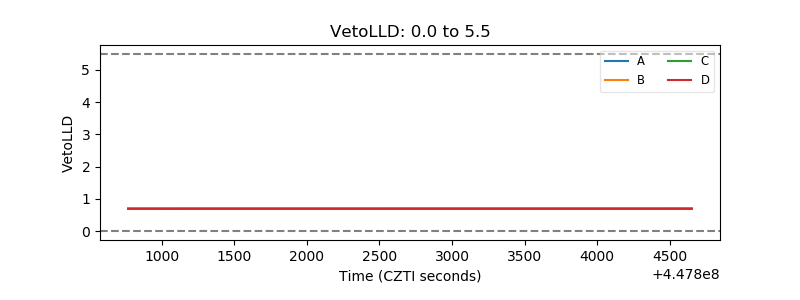 |
| Alpha Counter | 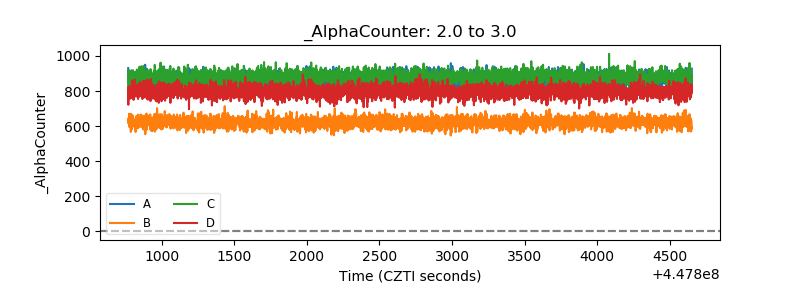 |
| _CPM_Rate | 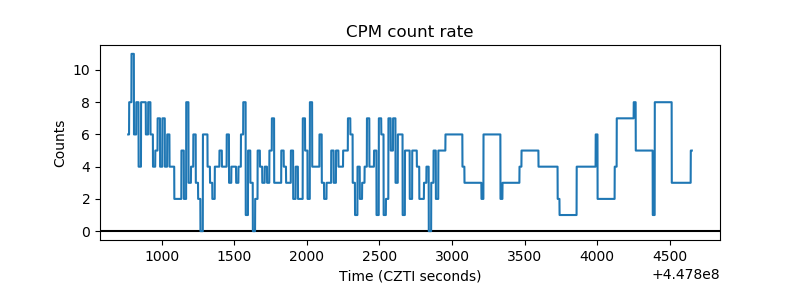 |
| CZT Counter | 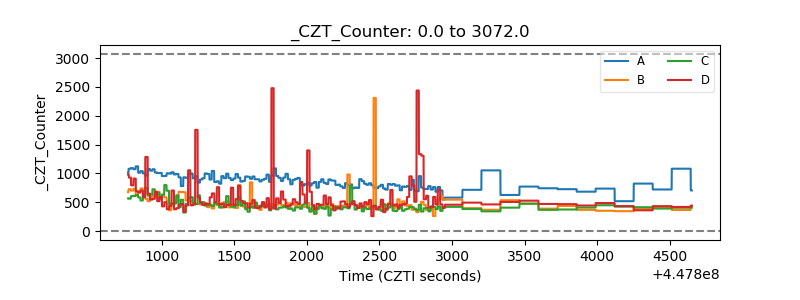 |
| +2.5 Volts monitor | 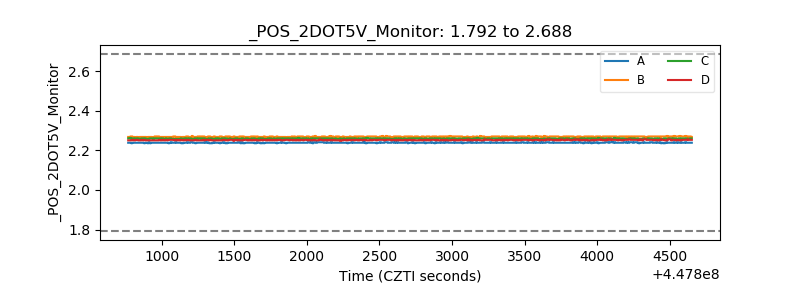 |
| +5 Volts monitor | 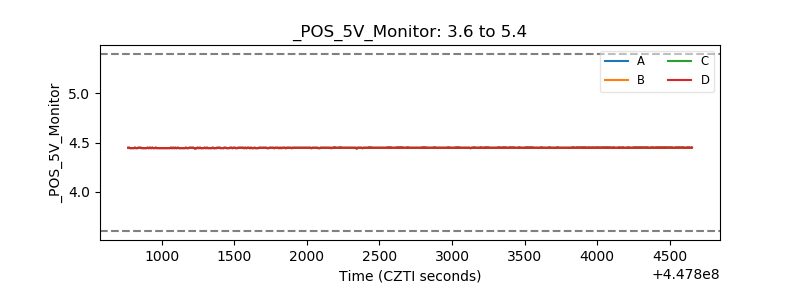 |
| _ROLL_ROT | 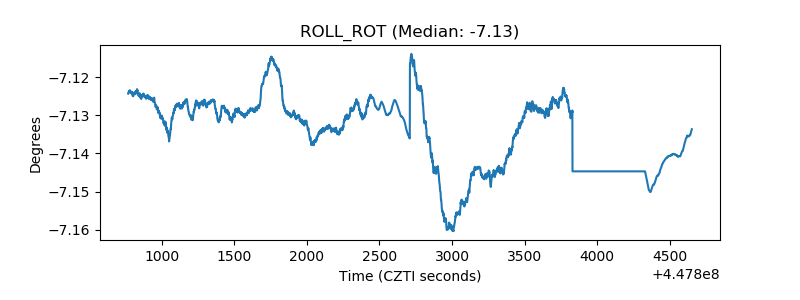 |
| _Roll_DEC | 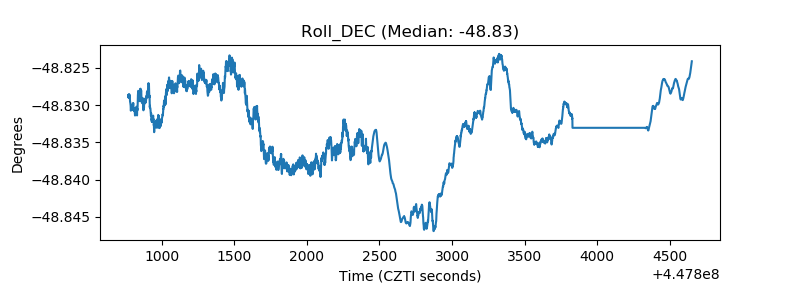 |
| _Roll_RA | 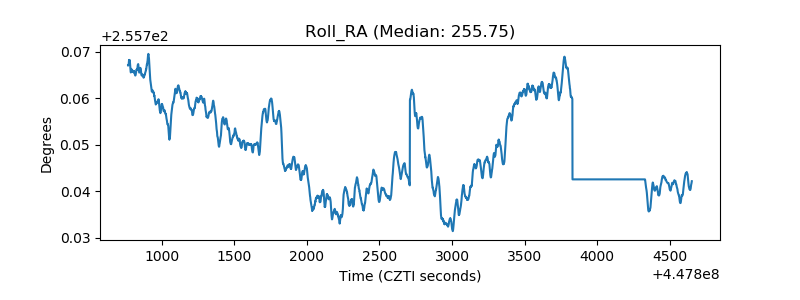 |
| Veto Counter | 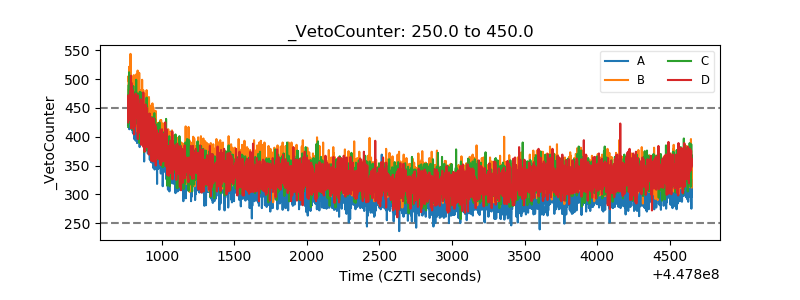 |