| Param | Original file | Final file |
|---|---|---|
| Filename | modeM0/AS1A13_028T01_9000006122_45706cztM0_level2.fits | modeM0/AS1A13_028T01_9000006122_45706cztM0_level2_quad_clean.evt |
| Size (bytes) | 466,009,920 | 117,619,200 |
| Size | 444.4 MB | 112.2 MB |
| Events in quadrant A | 5,896,721 | 801,713 |
| Events in quadrant B | 3,394,024 | 827,814 |
| Events in quadrant C | 3,278,951 | 795,424 |
| Events in quadrant D | 4,170,671 | 678,841 |
| Mode SS | |||
|---|---|---|---|
| Quadrant | BADHDUFLAG | Total packets | Discarded packets |
| A | 0 | 134 | 0 |
| B | 0 | 134 | 0 |
| C | 0 | 134 | 0 |
| D | 0 | 134 | 0 |
| Mode M9 | |||
|---|---|---|---|
| Quadrant | BADHDUFLAG | Total packets | Discarded packets |
| A | 0 | 11 | 0 |
| B | 0 | 11 | 0 |
| C | 0 | 11 | 0 |
| D | 0 | 11 | 0 |
| Mode M0 | |||
|---|---|---|---|
| Quadrant | BADHDUFLAG | Total packets | Discarded packets |
| A | 0 | 21335 | 1 |
| B | 0 | 13985 | 1 |
| C | 0 | 13982 | 1 |
| D | 0 | 16606 | 1 |
| Quadrant | Total seconds | Saturated seconds | Saturation percentage |
|---|---|---|---|
| A | 6564 | 194 | 2.955515% |
| B | 6565 | 124 | 1.888804% |
| C | 6565 | 91 | 1.386139% |
| D | 6565 | 471 | 7.174410% |
Noise dominated data is calculated using 1-second bins in cleaned event files. If a bin has >2000 counts, and if more than 50% of those come from <1% of pixels, then it is considered to be noise-dominated and hence unusable.
| Quadrant | # 1 sec bins | Bins with >0 counts | Bins with >2000 counts | High rate bins dominated by noise | Noise dominated (total time) | Noise dominated (detector-on time) | Marked lightcurve |
|---|---|---|---|---|---|---|---|
| A | 7754 | 6564 | 4 | 4 | 0.05% | 0.06% | 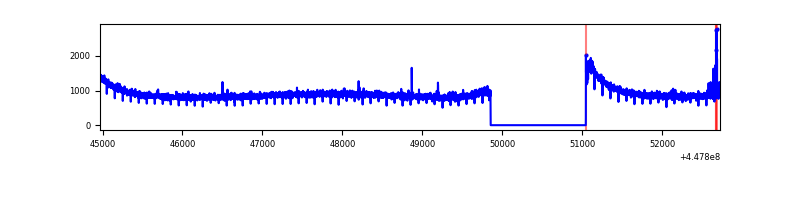 |
| B | 7755 | 6565 | 21 | 21 | 0.27% | 0.32% | 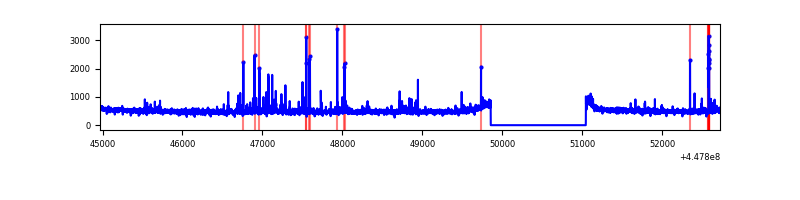 |
| C | 7755 | 6565 | 27 | 27 | 0.35% | 0.41% | 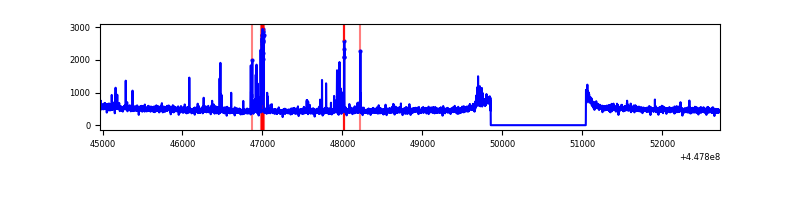 |
| D | 7755 | 6565 | 377 | 377 | 4.86% | 5.74% | 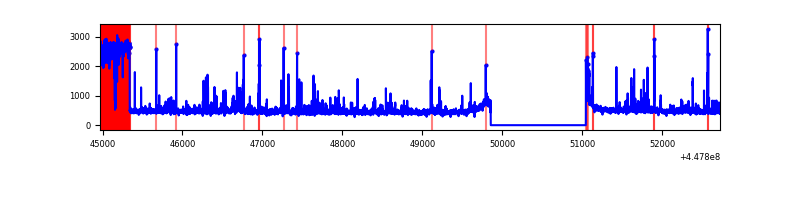 |
Top three noisy pixels from each quadrant. If the there are fewer than three noisy pixels in the level2.evt file, extra rows are filled as -1
| Pixel properties | Quadrant properties | ||||||
|---|---|---|---|---|---|---|---|
| Quadrant | DetID | PixID | Counts | Sigma | Mean | Median | Sigma |
| A | 10 | 83 | 2760659 | 16851.44 | 801 | 784 | 163.8 |
| A | 13 | 248 | 18574 | 108.62 | 801 | 784 | 163.8 |
| A | 13 | 254 | 11933 | 68.07 | 801 | 784 | 163.8 |
| B | 5 | 172 | 62221 | 397.25 | 796 | 772 | 154.7 |
| B | 3 | 112 | 52637 | 335.29 | 796 | 772 | 154.7 |
| B | 5 | 250 | 37954 | 240.37 | 796 | 772 | 154.7 |
| C | 14 | 254 | 99843 | 535.08 | 788 | 795 | 185.1 |
| C | 0 | 207 | 44523 | 236.23 | 788 | 795 | 185.1 |
| C | 1 | 241 | 35140 | 185.54 | 788 | 795 | 185.1 |
| D | 13 | 249 | 977111 | 5146.67 | 758 | 733 | 189.7 |
| D | 2 | 249 | 117317 | 614.54 | 758 | 733 | 189.7 |
| D | 1 | 52 | 55925 | 290.93 | 758 | 733 | 189.7 |
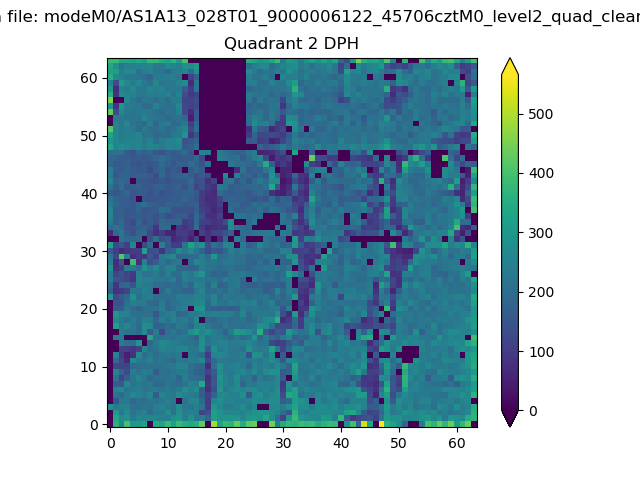
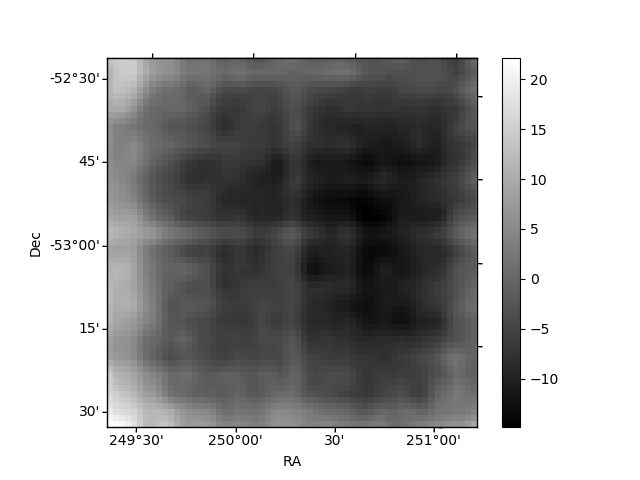
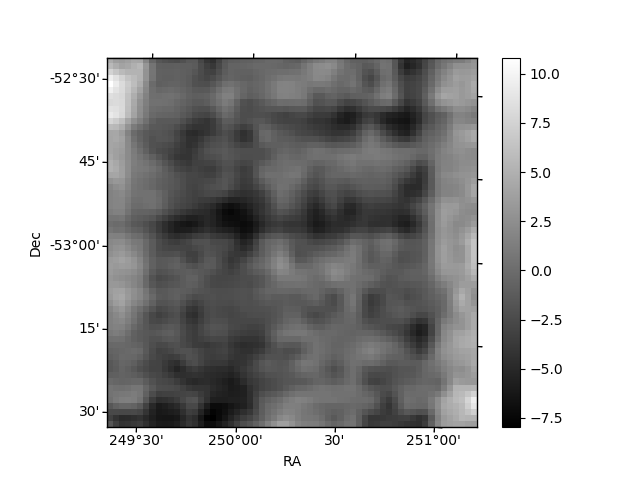
Histogram calculated using DETX and DETY for each event in the final _common_clean file
| Quadrant A | 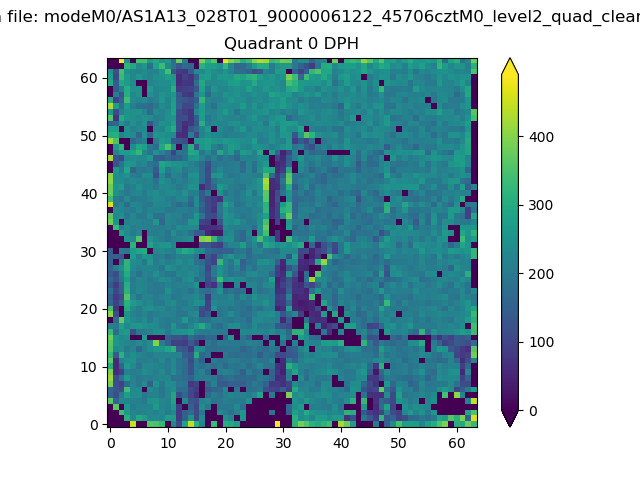 |
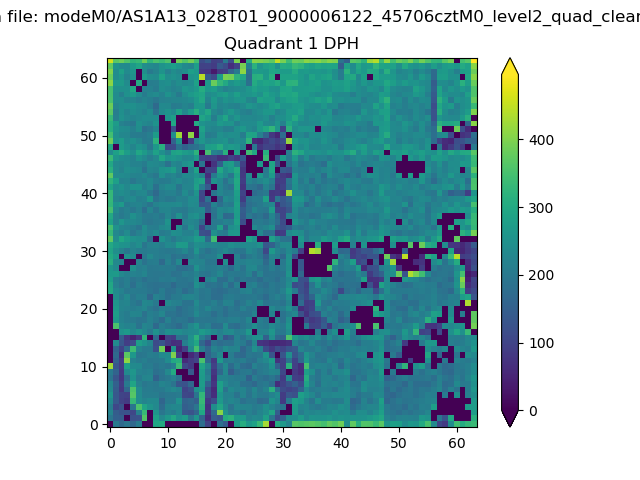 |
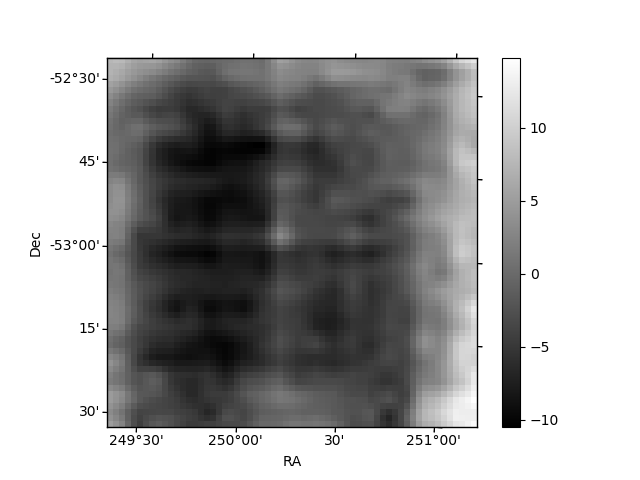
Quadrant B |
|---|---|---|---|
| Quadrant D | 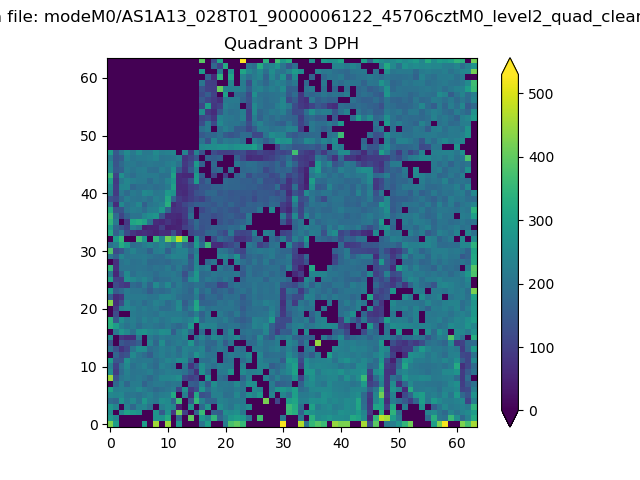 |
 |
Quadrant C |
| Plot type | Count rate plots | Images |
|---|---|---|
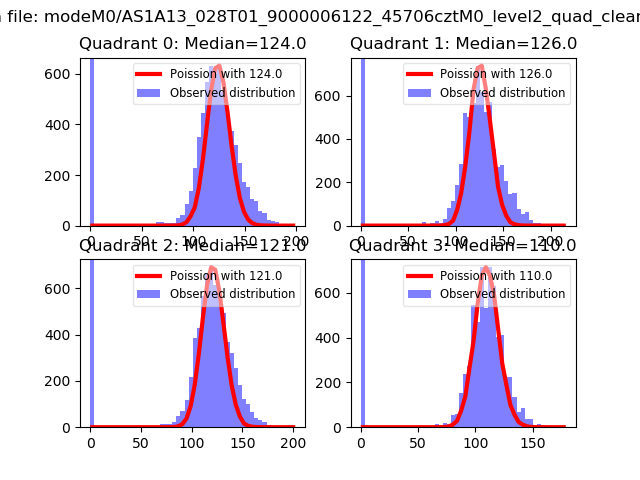
| Comparison with Poisson distribution Blue bars denote a histogram of data divided into 1 sec bins. Red curve is a Poisson curve with rate = median count rate of data. |
 |
 |
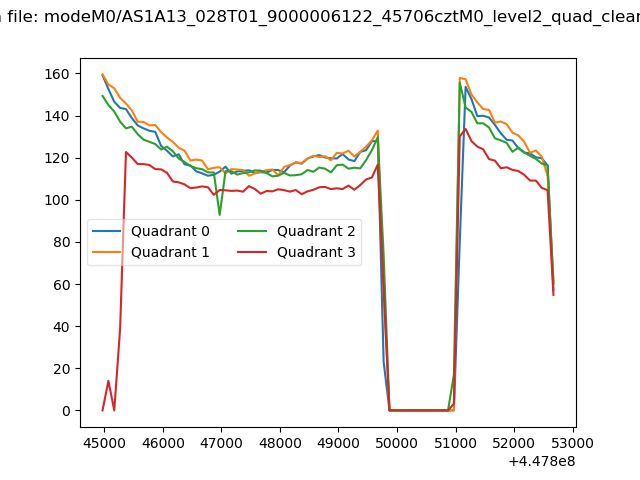
| Quadrant-wise count rates Data is divided into 100 sec bins |
 |
|
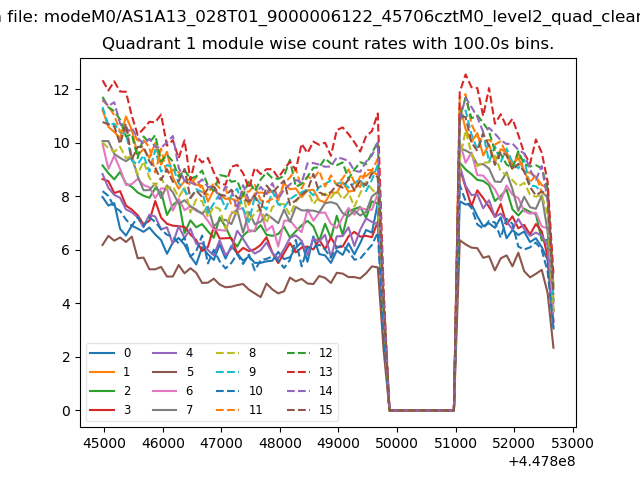
| Module-wise count rates for Quadrant A Data is divided into 100 sec bins |
 |
 |
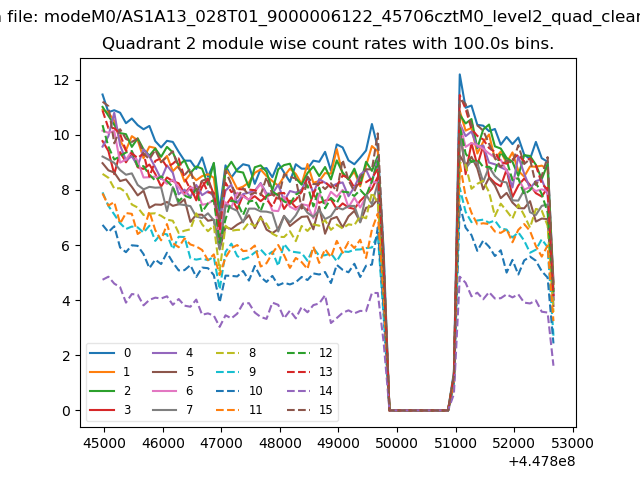
| Module-wise count rates for Quadrant B Data is divided into 100 sec bins |
 |
 |
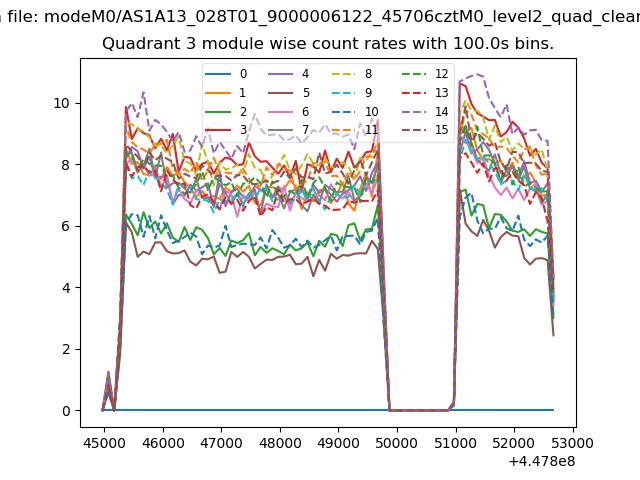
| Module-wise count rates for Quadrant C Data is divided into 100 sec bins |
 |
 |
| Module-wise count rates for Quadrant D Data is divided into 100 sec bins |
 |
 |
| Parameter | Plot |
|---|---|
| CZT HV Monitor | 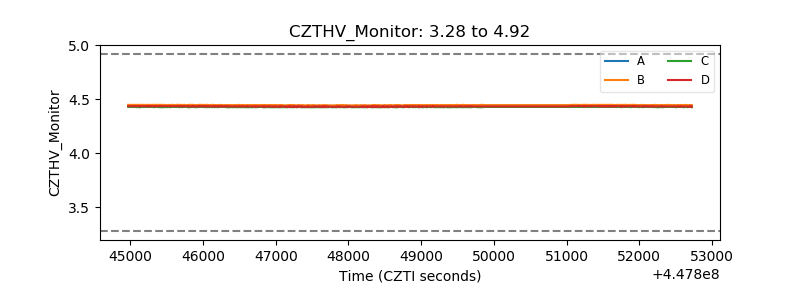 |
| D_VDD | 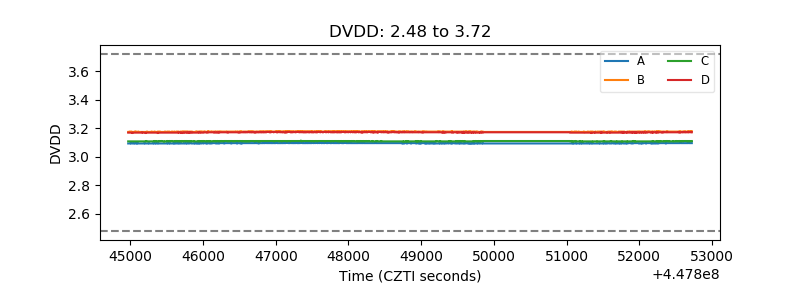 |
| Temperature 1 | 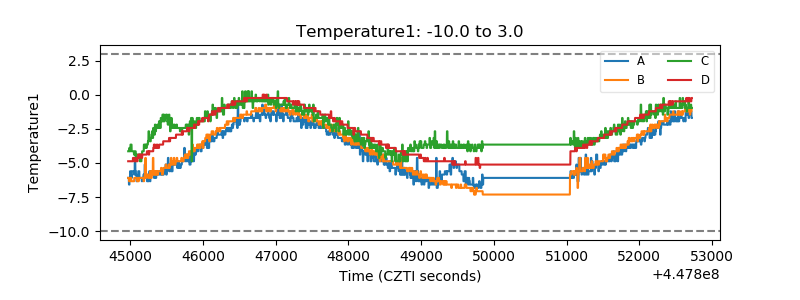 |
| Veto HV Monitor | 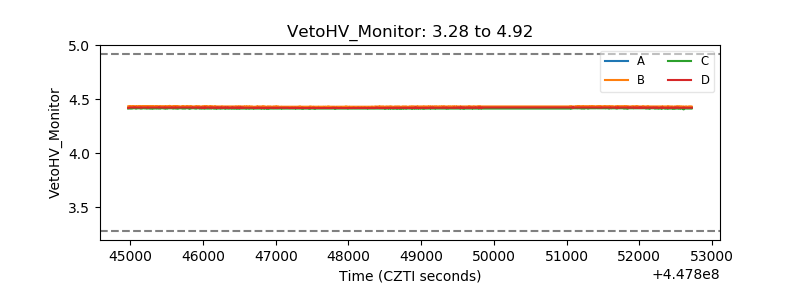 |
| Veto LLD | 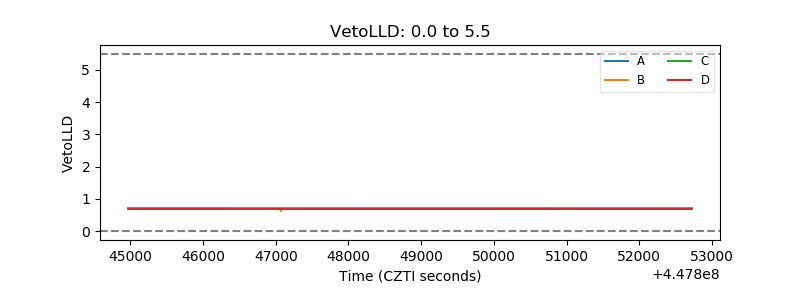 |
| Alpha Counter | 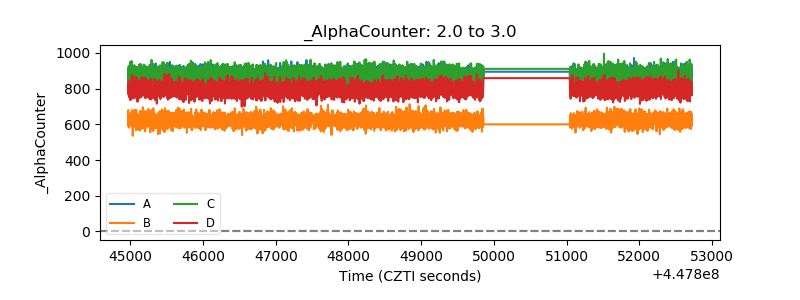 |
| _CPM_Rate | 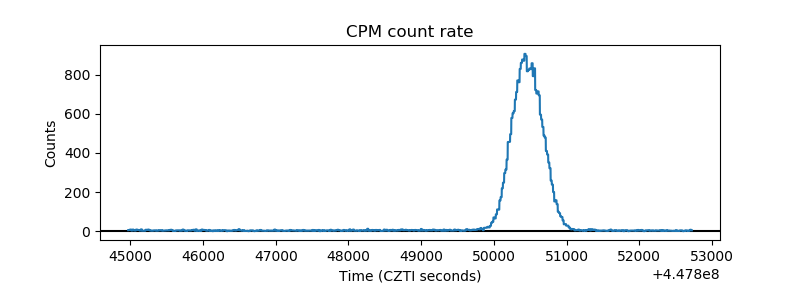 |
| CZT Counter | 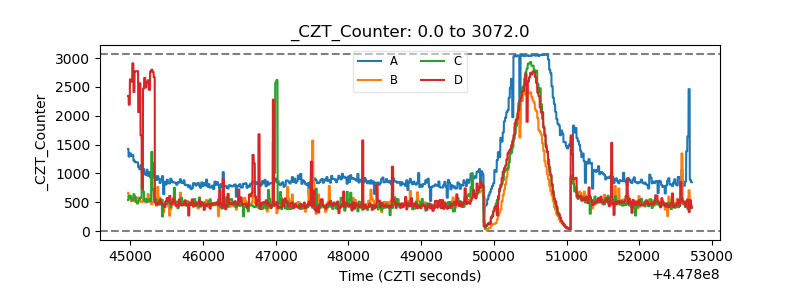 |
| +2.5 Volts monitor | 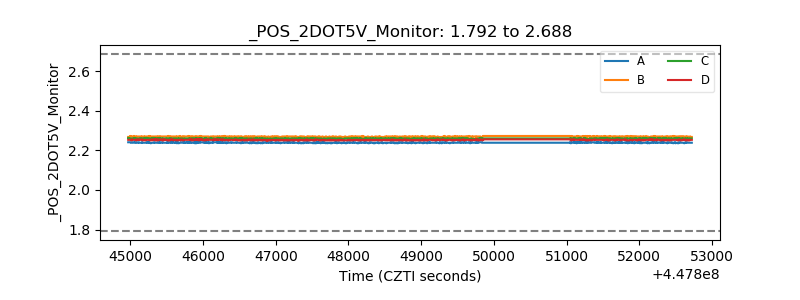 |
| +5 Volts monitor | 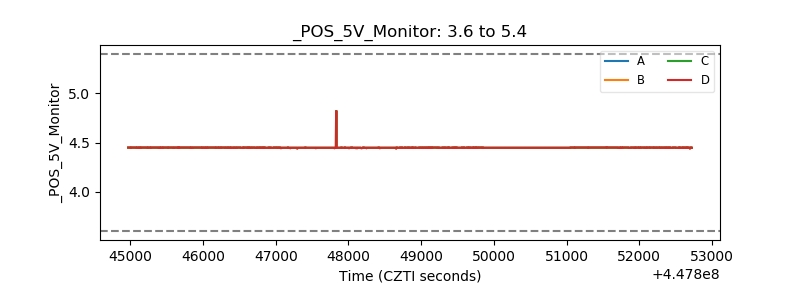 |
| _ROLL_ROT | 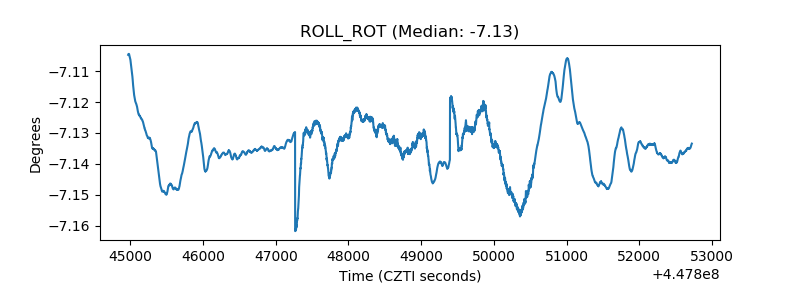 |
| _Roll_DEC | 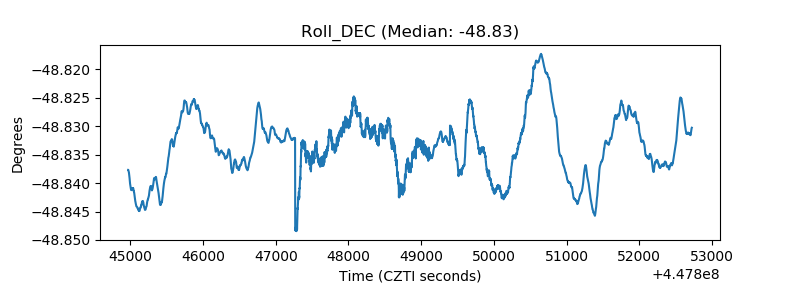 |
| _Roll_RA | 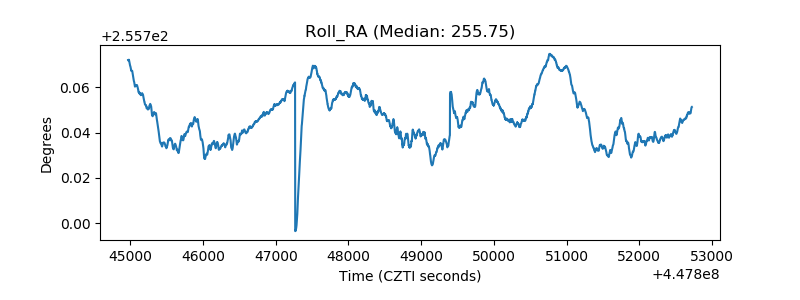 |
| Veto Counter |  |