| Param | Original file | Final file |
|---|---|---|
| Filename | modeM0/AS1A13_028T01_9000006122_45707cztM0_level2.fits | modeM0/AS1A13_028T01_9000006122_45707cztM0_level2_quad_clean.evt |
| Size (bytes) | 452,105,280 | 113,644,800 |
| Size | 431.2 MB | 108.4 MB |
| Events in quadrant A | 5,860,609 | 756,970 |
| Events in quadrant B | 3,477,131 | 785,234 |
| Events in quadrant C | 3,122,134 | 761,531 |
| Events in quadrant D | 3,772,261 | 685,825 |
| Mode SS | |||
|---|---|---|---|
| Quadrant | BADHDUFLAG | Total packets | Discarded packets |
| A | 0 | 130 | 0 |
| B | 0 | 130 | 0 |
| C | 0 | 130 | 0 |
| D | 0 | 130 | 0 |
| Mode M9 | |||
|---|---|---|---|
| Quadrant | BADHDUFLAG | Total packets | Discarded packets |
| A | 0 | 12 | 0 |
| B | 0 | 12 | 0 |
| C | 0 | 12 | 0 |
| D | 0 | 12 | 0 |
| Mode M0 | |||
|---|---|---|---|
| Quadrant | BADHDUFLAG | Total packets | Discarded packets |
| A | 0 | 21103 | 1 |
| B | 0 | 14197 | 3 |
| C | 0 | 13641 | 1 |
| D | 0 | 15471 | 1 |
| Quadrant | Total seconds | Saturated seconds | Saturation percentage |
|---|---|---|---|
| A | 6481 | 233 | 3.595124% |
| B | 6481 | 163 | 2.515044% |
| C | 6481 | 83 | 1.280667% |
| D | 6481 | 207 | 3.193952% |
Noise dominated data is calculated using 1-second bins in cleaned event files. If a bin has >2000 counts, and if more than 50% of those come from <1% of pixels, then it is considered to be noise-dominated and hence unusable.
| Quadrant | # 1 sec bins | Bins with >0 counts | Bins with >2000 counts | High rate bins dominated by noise | Noise dominated (total time) | Noise dominated (detector-on time) | Marked lightcurve |
|---|---|---|---|---|---|---|---|
| A | 7631 | 6481 | 14 | 14 | 0.18% | 0.22% | 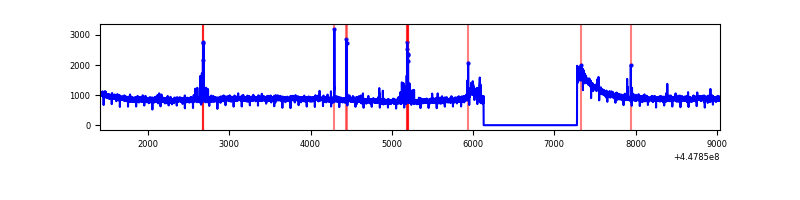 |
| B | 7631 | 6481 | 21 | 21 | 0.28% | 0.32% | 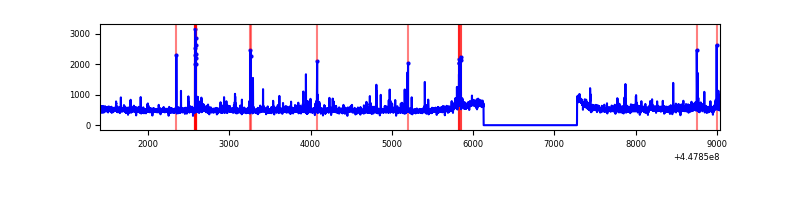 |
| C | 7631 | 6481 | 17 | 17 | 0.22% | 0.26% | 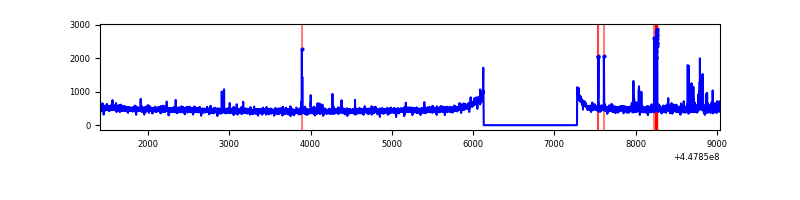 |
| D | 7631 | 6481 | 112 | 112 | 1.47% | 1.73% | 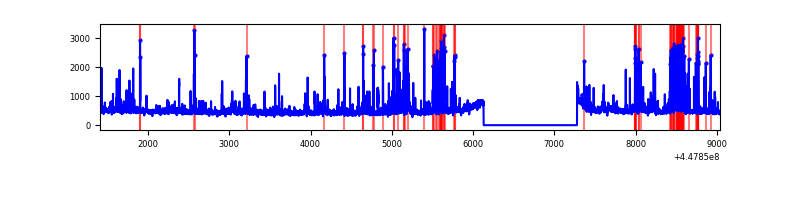 |
Top three noisy pixels from each quadrant. If the there are fewer than three noisy pixels in the level2.evt file, extra rows are filled as -1
| Pixel properties | Quadrant properties | ||||||
|---|---|---|---|---|---|---|---|
| Quadrant | DetID | PixID | Counts | Sigma | Mean | Median | Sigma |
| A | 10 | 83 | 2735687 | 17239.37 | 773 | 757 | 158.6 |
| A | 13 | 248 | 89272 | 557.94 | 773 | 757 | 158.6 |
| A | 4 | 0 | 12371 | 73.2 | 773 | 757 | 158.6 |
| B | 3 | 112 | 134718 | 898.51 | 771 | 748 | 149.1 |
| B | 0 | 189 | 114253 | 761.25 | 771 | 748 | 149.1 |
| B | 5 | 172 | 51862 | 342.81 | 771 | 748 | 149.1 |
| C | 1 | 241 | 57254 | 316.97 | 761 | 767 | 178.2 |
| C | 0 | 207 | 56390 | 312.13 | 761 | 767 | 178.2 |
| C | 9 | 54 | 31938 | 174.91 | 761 | 767 | 178.2 |
| D | 13 | 249 | 465850 | 2473.8 | 762 | 740 | 188.0 |
| D | 2 | 249 | 121751 | 643.63 | 762 | 740 | 188.0 |
| D | 1 | 52 | 72975 | 384.2 | 762 | 740 | 188.0 |
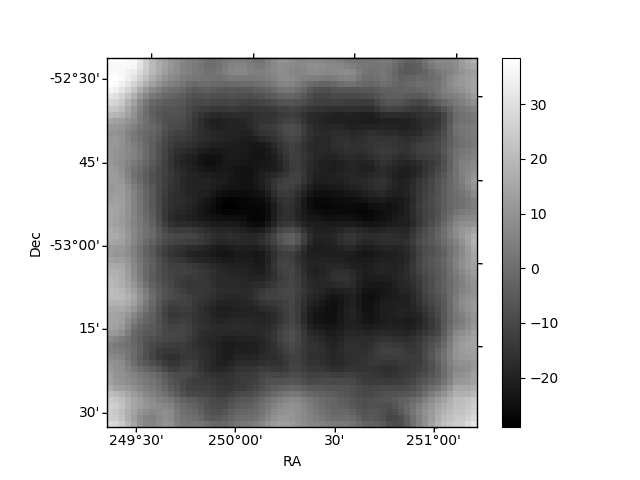
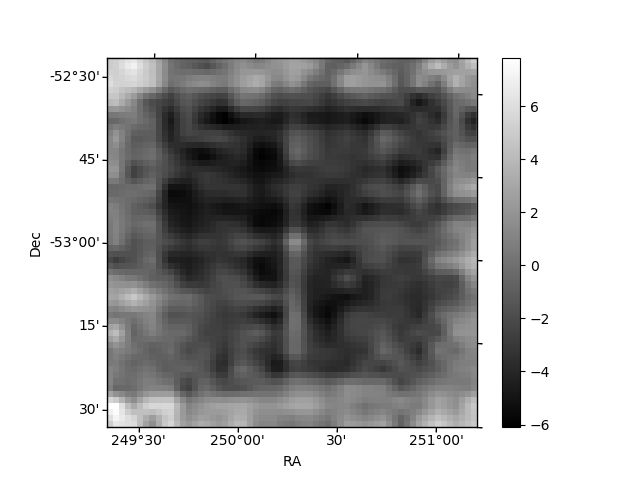
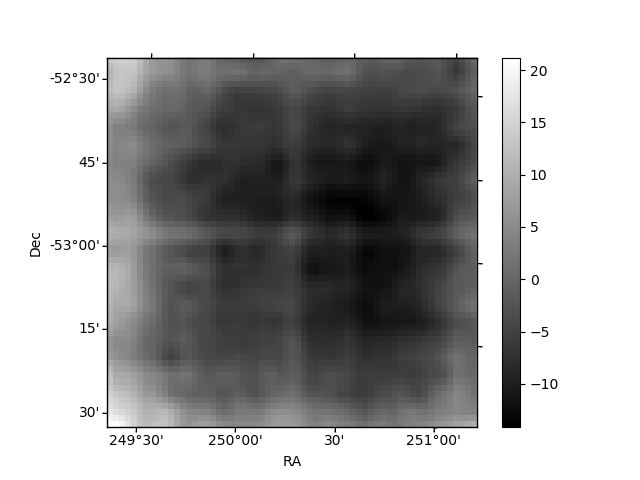
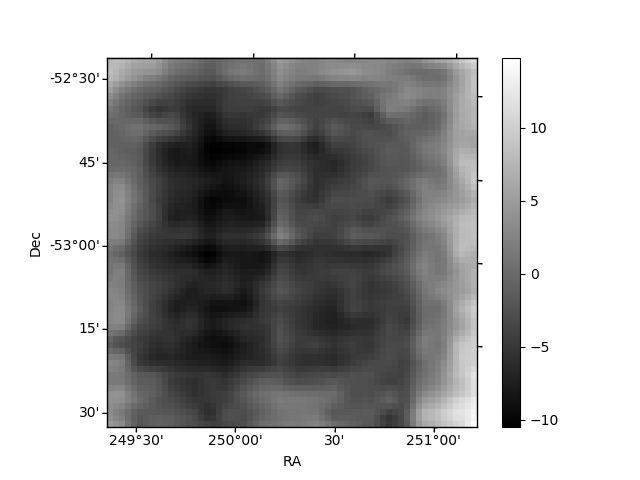
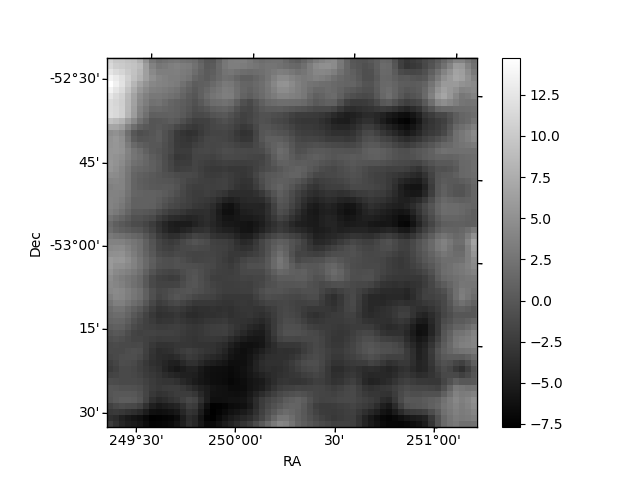
Histogram calculated using DETX and DETY for each event in the final _common_clean file
| Quadrant A | 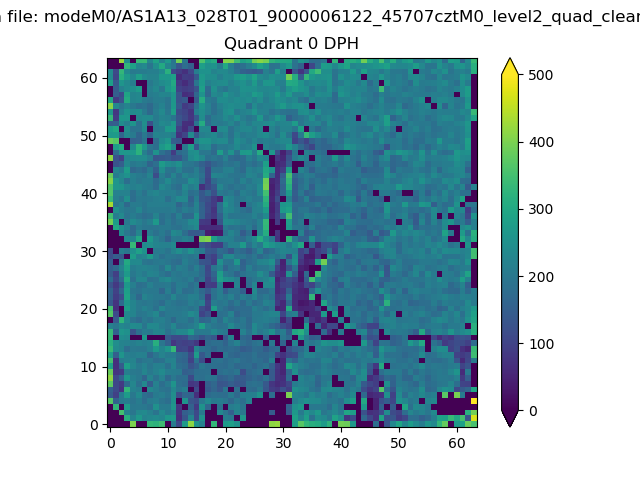 |
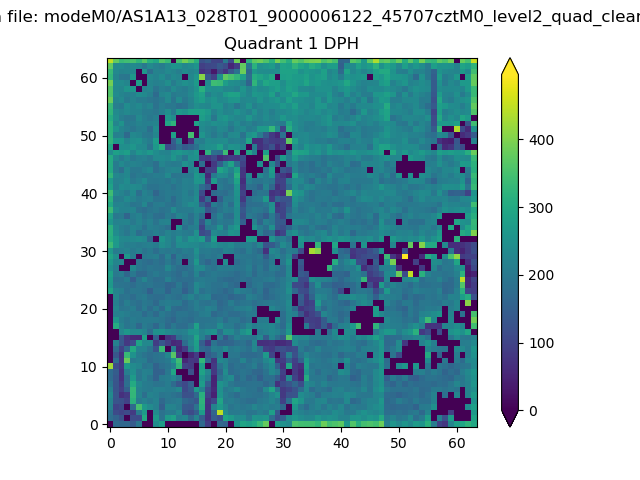 |
Quadrant B |
|---|---|---|---|
| Quadrant D | 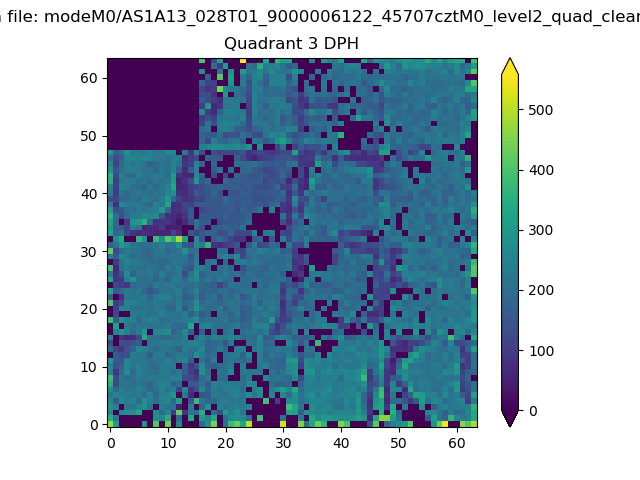 |
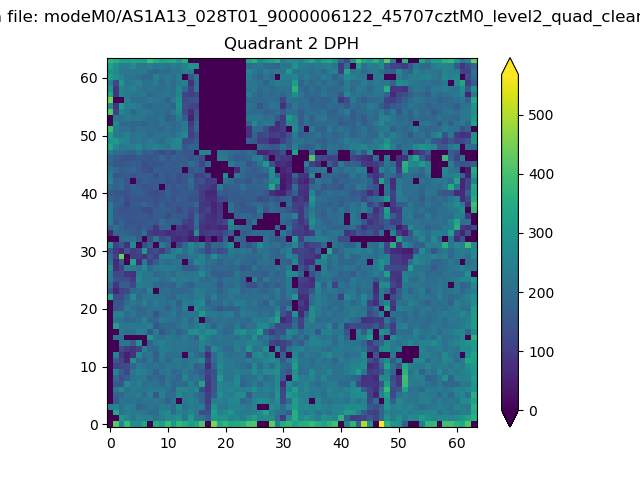 |
Quadrant C |
| Plot type | Count rate plots | Images |
|---|---|---|
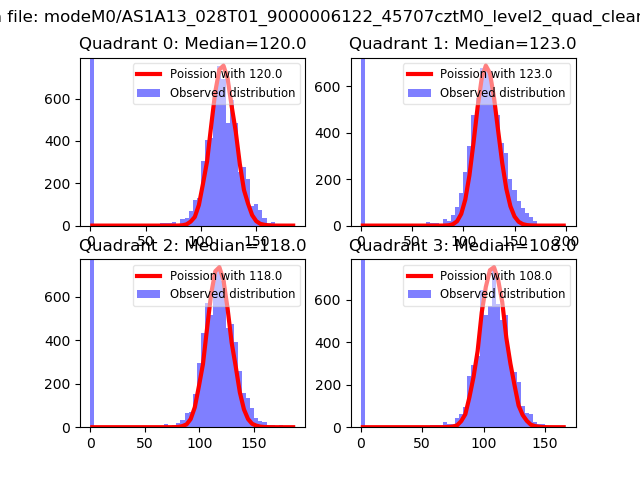
| Comparison with Poisson distribution Blue bars denote a histogram of data divided into 1 sec bins. Red curve is a Poisson curve with rate = median count rate of data. |
 |
 |
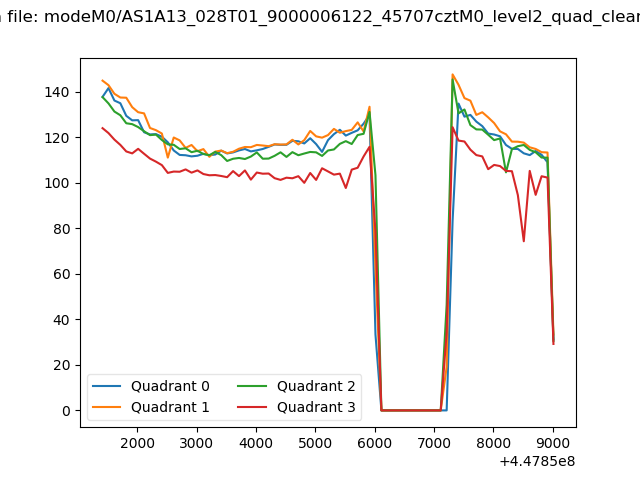
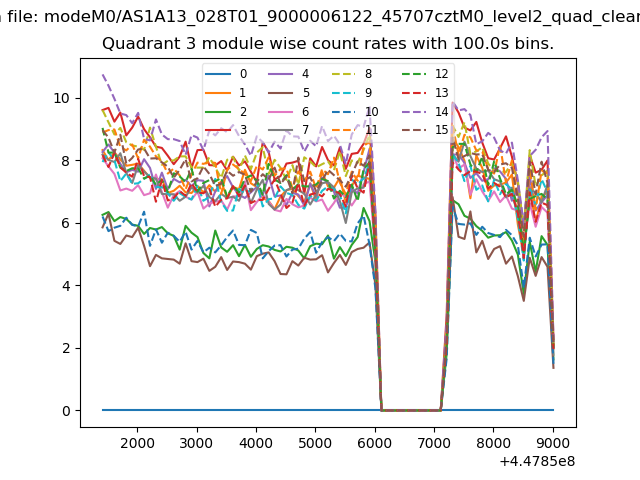
| Quadrant-wise count rates Data is divided into 100 sec bins |
 |
|
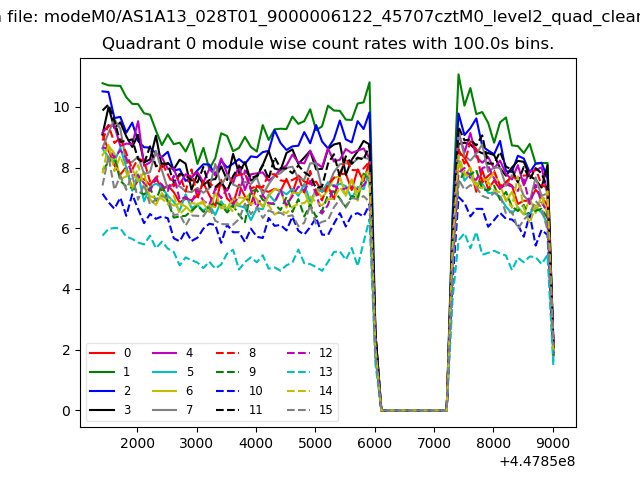
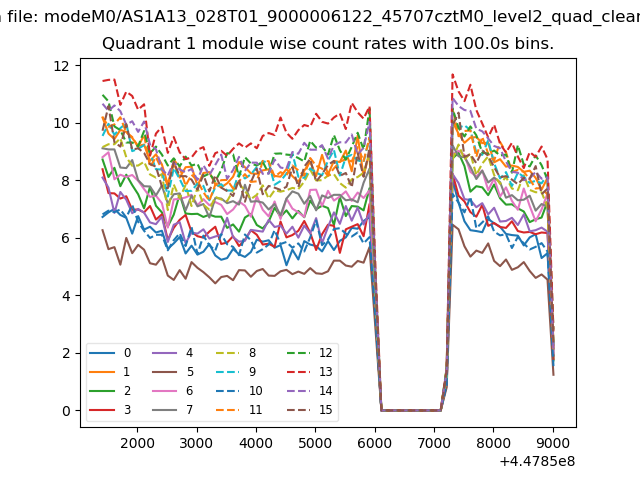
| Module-wise count rates for Quadrant A Data is divided into 100 sec bins |
 |
 |
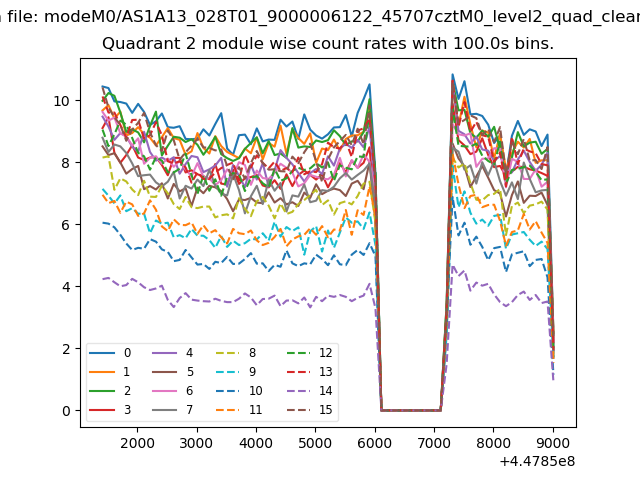
| Module-wise count rates for Quadrant B Data is divided into 100 sec bins |
 |
 |
| Module-wise count rates for Quadrant C Data is divided into 100 sec bins |
 |
 |
| Module-wise count rates for Quadrant D Data is divided into 100 sec bins |
 |
 |
| Parameter | Plot |
|---|---|
| CZT HV Monitor | 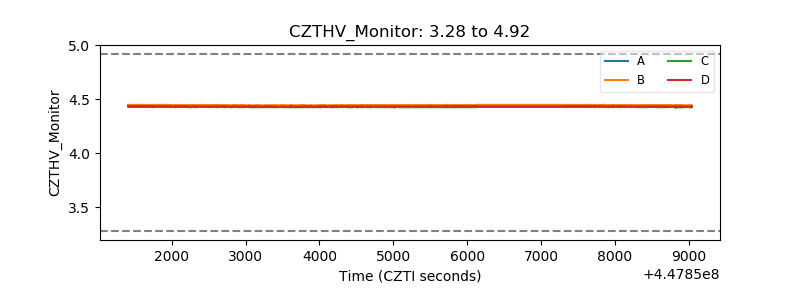 |
| D_VDD | 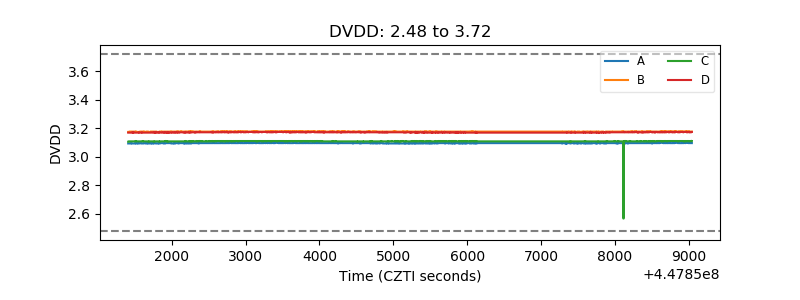 |
| Temperature 1 | 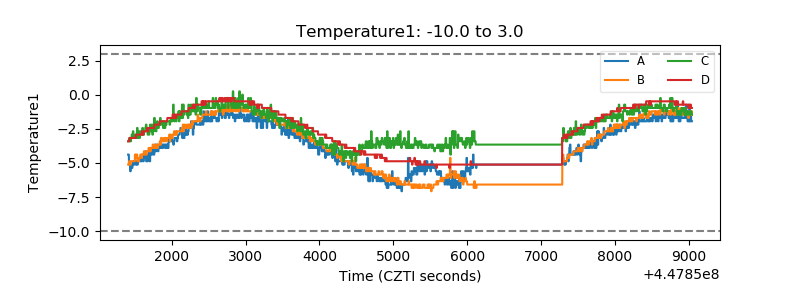 |
| Veto HV Monitor | 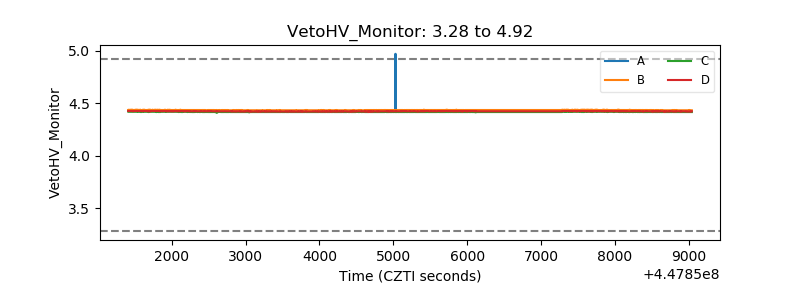 |
| Veto LLD | 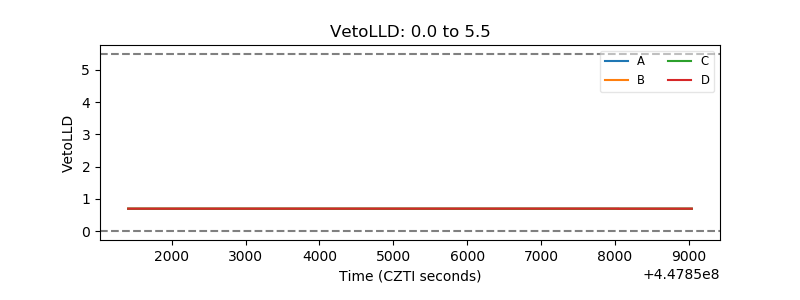 |
| Alpha Counter | 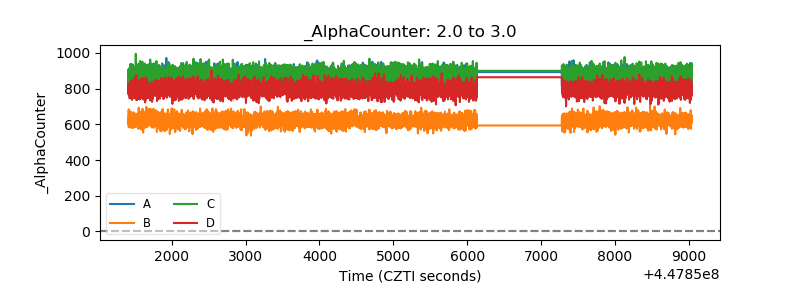 |
| _CPM_Rate | 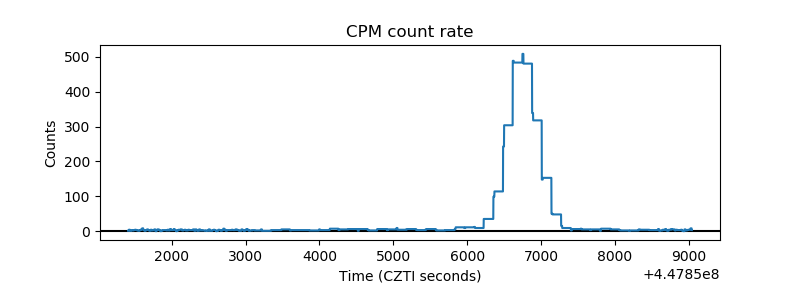 |
| CZT Counter | 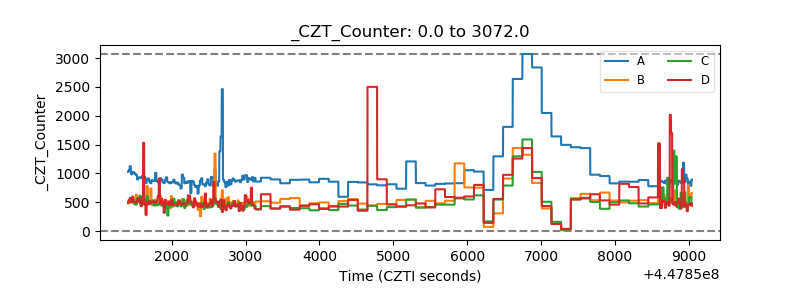 |
| +2.5 Volts monitor |  |
| +5 Volts monitor | 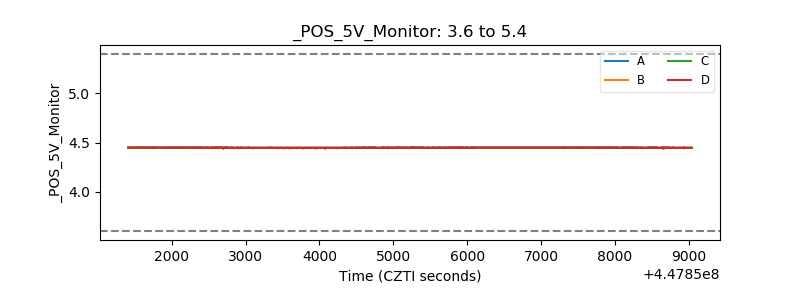 |
| _ROLL_ROT | 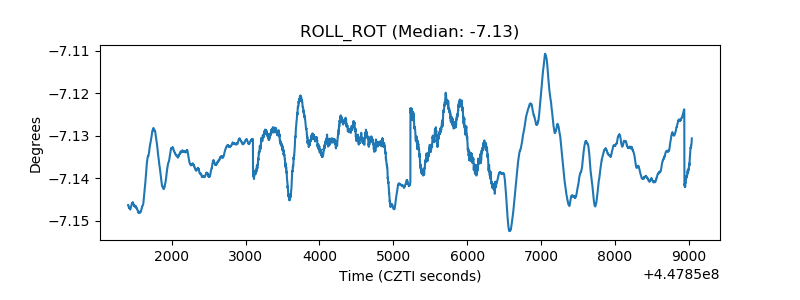 |
| _Roll_DEC |  |
| _Roll_RA | 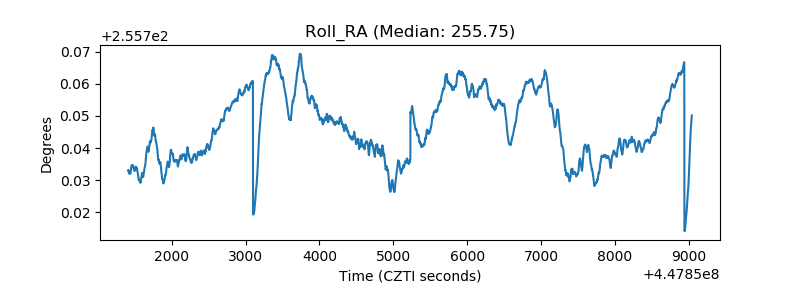 |
| Veto Counter | 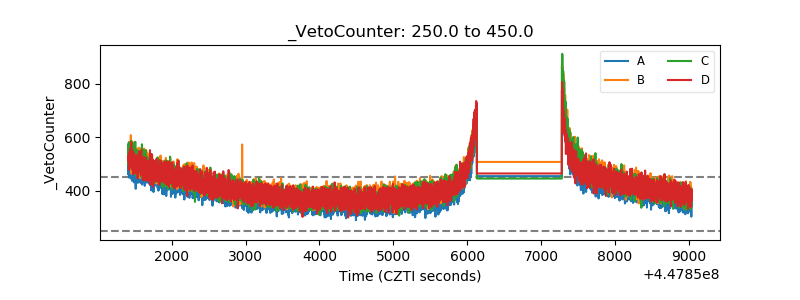 |