| Param | Original file | Final file |
|---|---|---|
| Filename | modeM0/AS1A13_028T01_9000006122_45710cztM0_level2.fits | modeM0/AS1A13_028T01_9000006122_45710cztM0_level2_quad_clean.evt |
| Size (bytes) | 591,419,520 | 127,512,000 |
| Size | 564.0 MB | 121.6 MB |
| Events in quadrant A | 7,054,178 | 826,463 |
| Events in quadrant B | 5,053,031 | 856,739 |
| Events in quadrant C | 4,872,373 | 849,321 |
| Events in quadrant D | 4,300,977 | 779,208 |
| Mode SS | |||
|---|---|---|---|
| Quadrant | BADHDUFLAG | Total packets | Discarded packets |
| A | 0 | 162 | 0 |
| B | 0 | 162 | 0 |
| C | 0 | 162 | 0 |
| D | 0 | 162 | 0 |
| Mode M9 | |||
|---|---|---|---|
| Quadrant | BADHDUFLAG | Total packets | Discarded packets |
| A | 0 | 7 | 0 |
| B | 0 | 7 | 0 |
| C | 0 | 7 | 0 |
| D | 0 | 7 | 0 |
| Mode M0 | |||
|---|---|---|---|
| Quadrant | BADHDUFLAG | Total packets | Discarded packets |
| A | 0 | 26289 | 2 |
| B | 0 | 20279 | 2 |
| C | 0 | 19913 | 2 |
| D | 0 | 18288 | 2 |
| Quadrant | Total seconds | Saturated seconds | Saturation percentage |
|---|---|---|---|
| A | 7896 | 457 | 5.787741% |
| B | 7897 | 396 | 5.014562% |
| C | 7896 | 169 | 2.140324% |
| D | 7896 | 167 | 2.114995% |
Noise dominated data is calculated using 1-second bins in cleaned event files. If a bin has >2000 counts, and if more than 50% of those come from <1% of pixels, then it is considered to be noise-dominated and hence unusable.
| Quadrant | # 1 sec bins | Bins with >0 counts | Bins with >2000 counts | High rate bins dominated by noise | Noise dominated (total time) | Noise dominated (detector-on time) | Marked lightcurve |
|---|---|---|---|---|---|---|---|
| A | 8546 | 7897 | 0 | 0 | 0.00% | 0.00% | 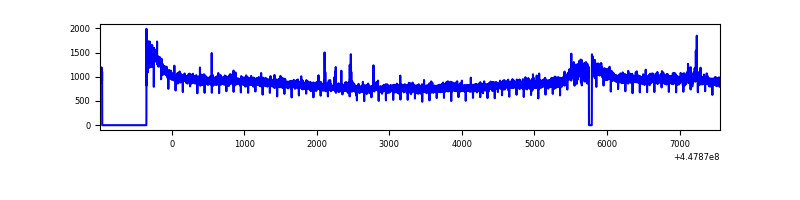 |
| B | 8547 | 7897 | 67 | 67 | 0.78% | 0.85% | 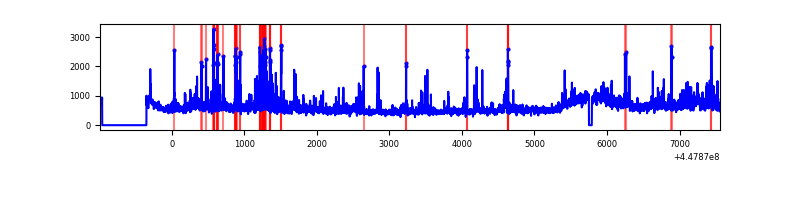 |
| C | 8546 | 7896 | 47 | 47 | 0.55% | 0.60% | 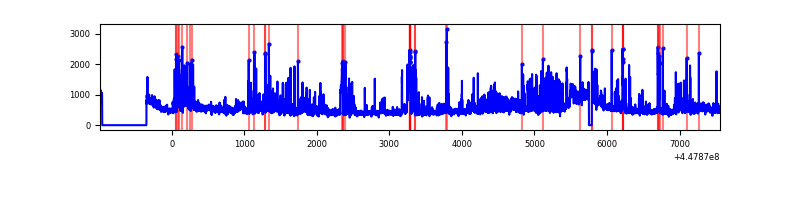 |
| D | 8546 | 7897 | 83 | 83 | 0.97% | 1.05% | 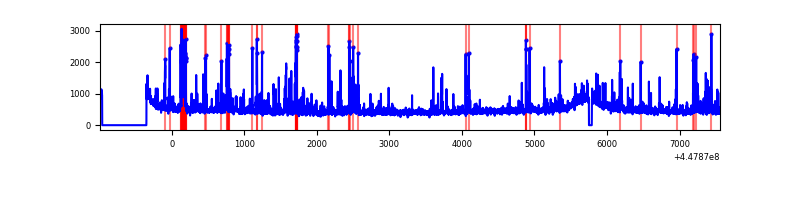 |
Top three noisy pixels from each quadrant. If the there are fewer than three noisy pixels in the level2.evt file, extra rows are filled as -1
| Pixel properties | Quadrant properties | ||||||
|---|---|---|---|---|---|---|---|
| Quadrant | DetID | PixID | Counts | Sigma | Mean | Median | Sigma |
| A | 10 | 83 | 3410051 | 17428.1 | 928 | 906 | 195.6 |
| A | 14 | 235 | 17891 | 86.83 | 928 | 906 | 195.6 |
| A | 0 | 243 | 12602 | 59.79 | 928 | 906 | 195.6 |
| B | 3 | 112 | 799964 | 4340.38 | 924 | 894 | 184.1 |
| B | 5 | 172 | 257854 | 1395.75 | 924 | 894 | 184.1 |
| B | 0 | 183 | 72852 | 390.86 | 924 | 894 | 184.1 |
| C | 9 | 54 | 939070 | 4356.27 | 909 | 913 | 215.4 |
| C | 14 | 254 | 147553 | 680.91 | 909 | 913 | 215.4 |
| C | 12 | 2 | 89314 | 410.48 | 909 | 913 | 215.4 |
| D | 2 | 249 | 212134 | 922.57 | 912 | 881 | 229.0 |
| D | 13 | 249 | 201378 | 875.6 | 912 | 881 | 229.0 |
| D | 5 | 171 | 140728 | 610.73 | 912 | 881 | 229.0 |
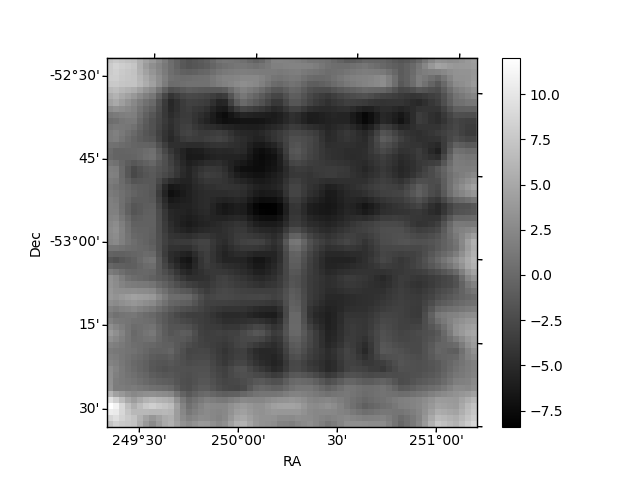
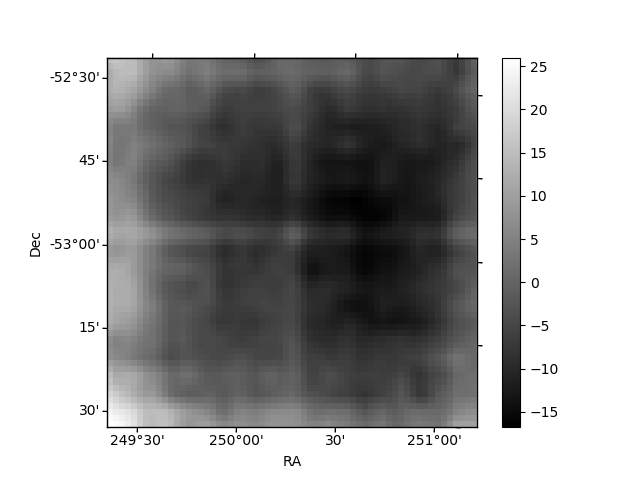
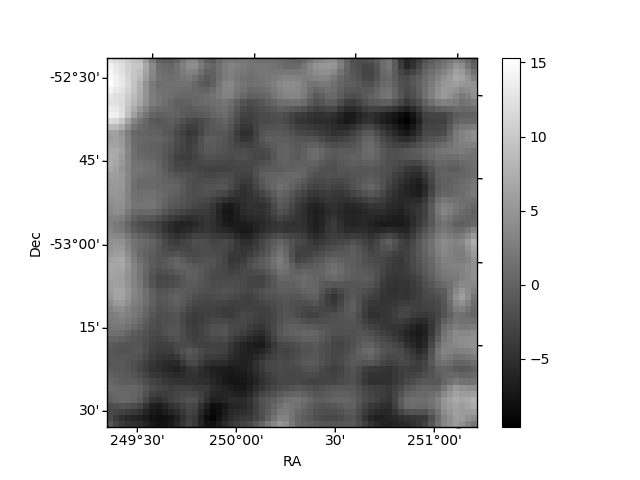
Histogram calculated using DETX and DETY for each event in the final _common_clean file
| Quadrant A | 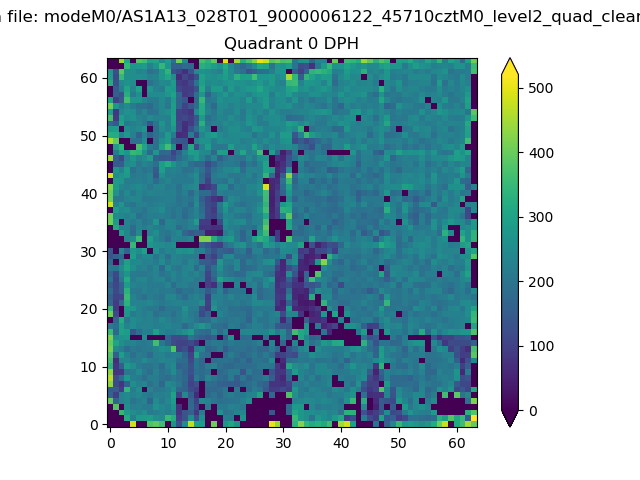 |
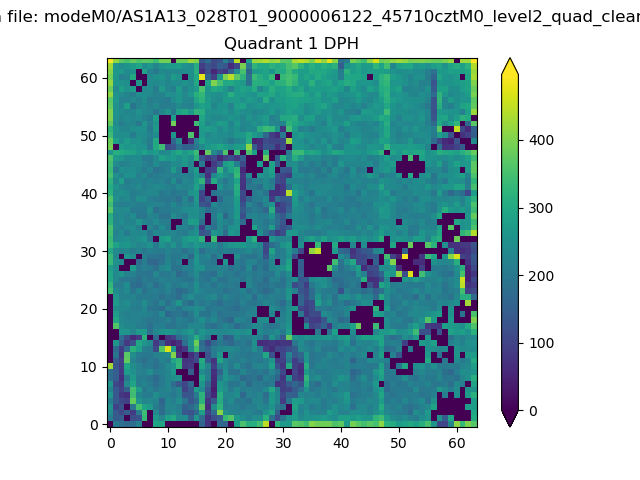 |
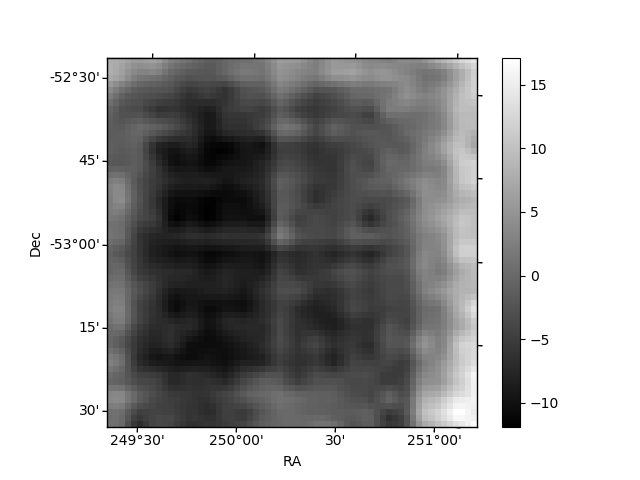
Quadrant B |
|---|---|---|---|
| Quadrant D | 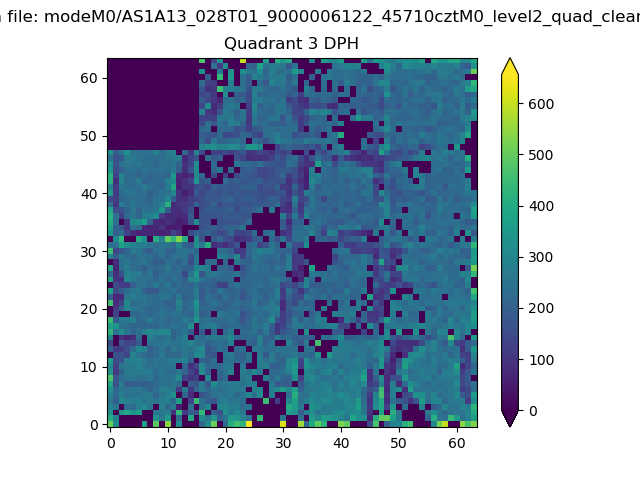 |
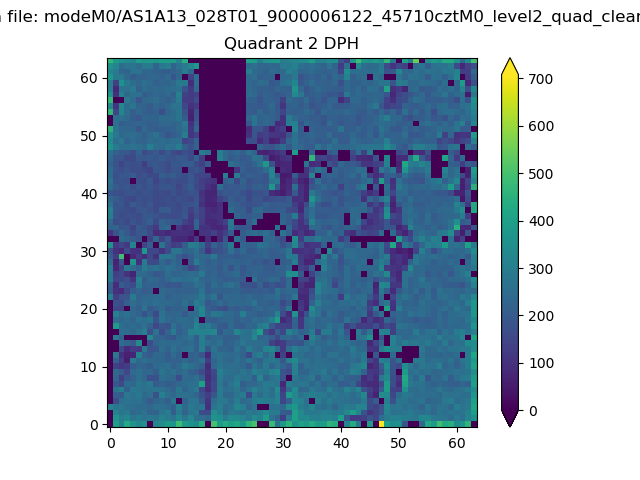 |
Quadrant C |
| Plot type | Count rate plots | Images |
|---|---|---|
| Comparison with Poisson distribution Blue bars denote a histogram of data divided into 1 sec bins. Red curve is a Poisson curve with rate = median count rate of data. |
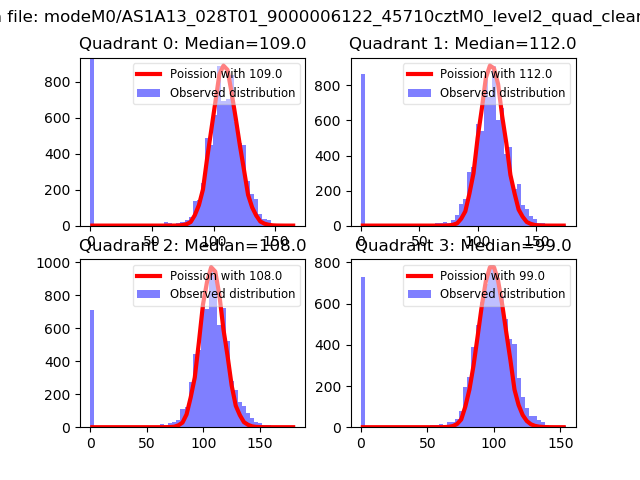 |
 |
| Quadrant-wise count rates Data is divided into 100 sec bins |
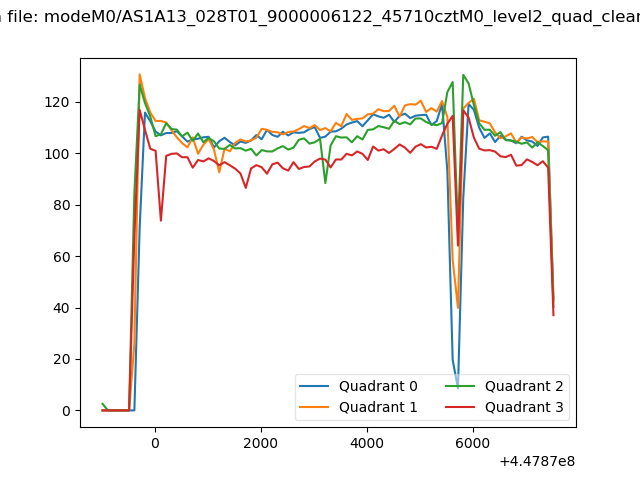 |
|
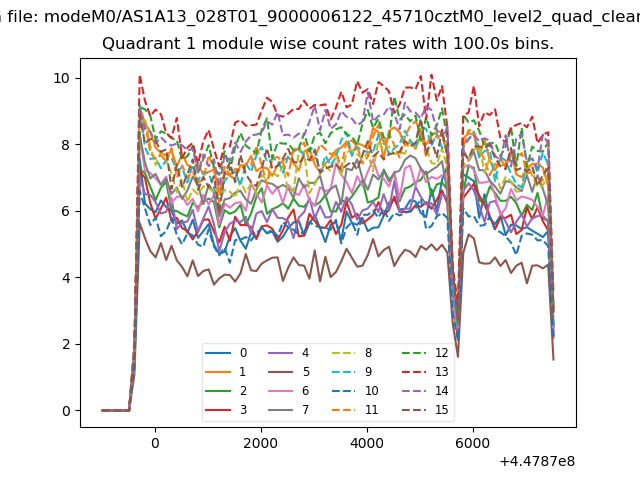
| Module-wise count rates for Quadrant A Data is divided into 100 sec bins |
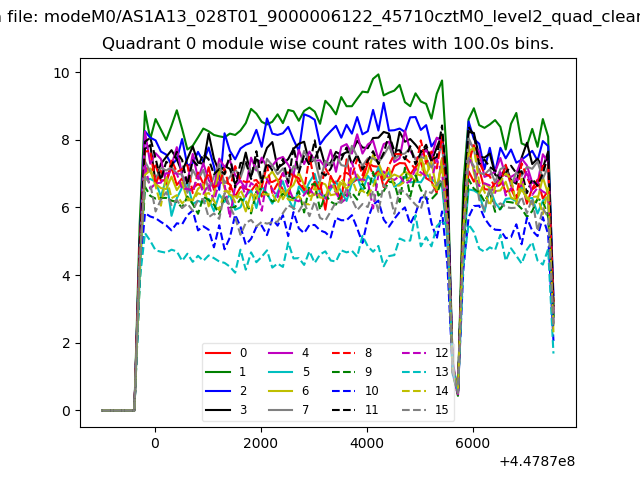 |
 |
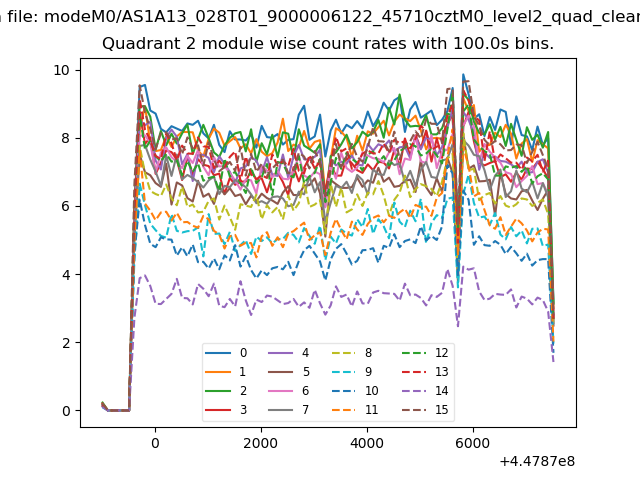
| Module-wise count rates for Quadrant B Data is divided into 100 sec bins |
 |
 |
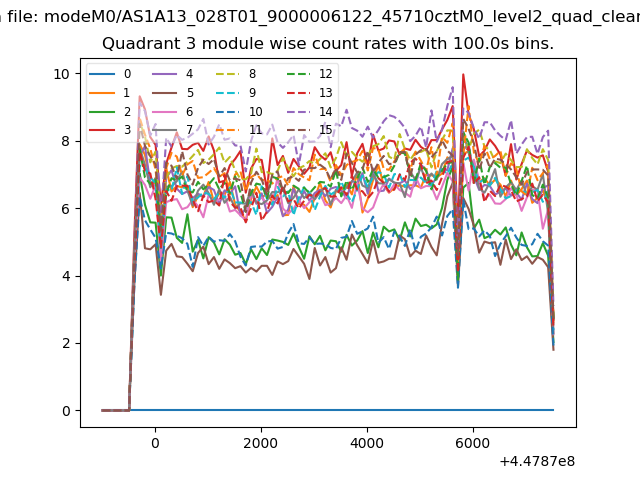
| Module-wise count rates for Quadrant C Data is divided into 100 sec bins |
 |
 |
| Module-wise count rates for Quadrant D Data is divided into 100 sec bins |
 |
 |
| Parameter | Plot |
|---|---|
| CZT HV Monitor | 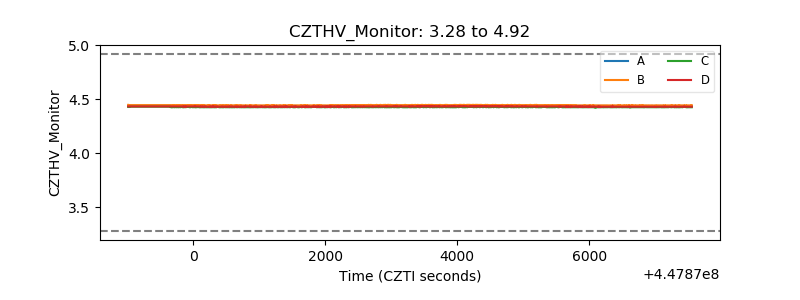 |
| D_VDD | 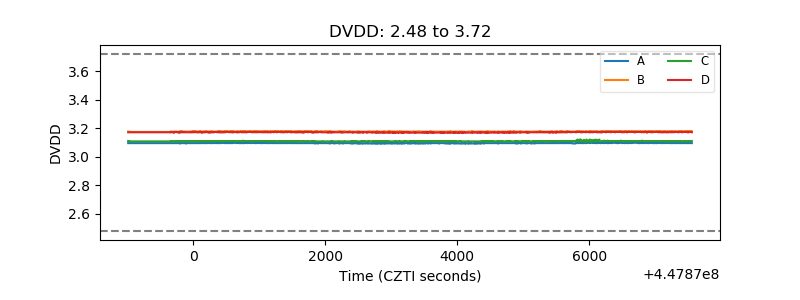 |
| Temperature 1 | 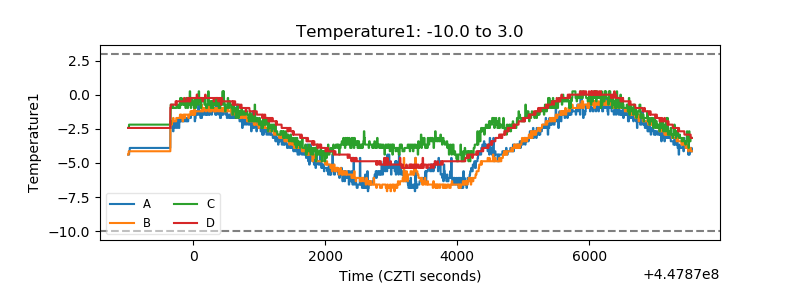 |
| Veto HV Monitor | 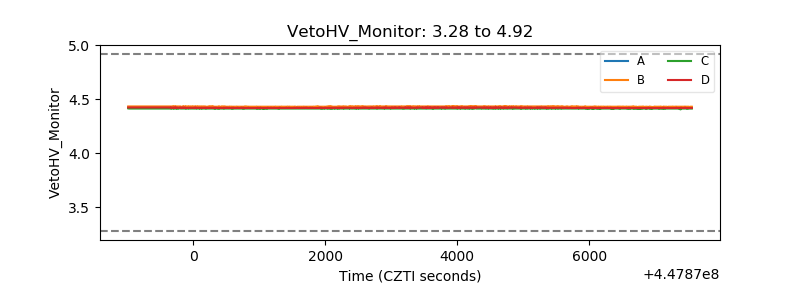 |
| Veto LLD | 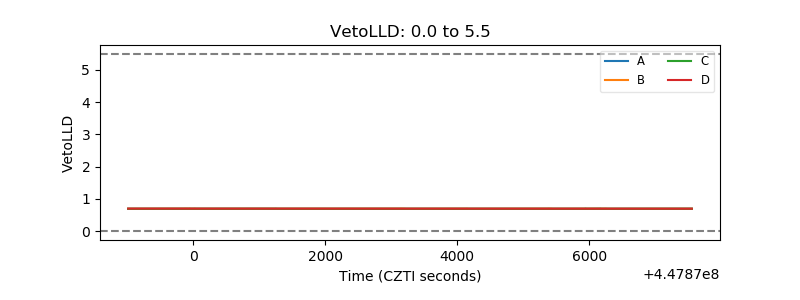 |
| Alpha Counter | 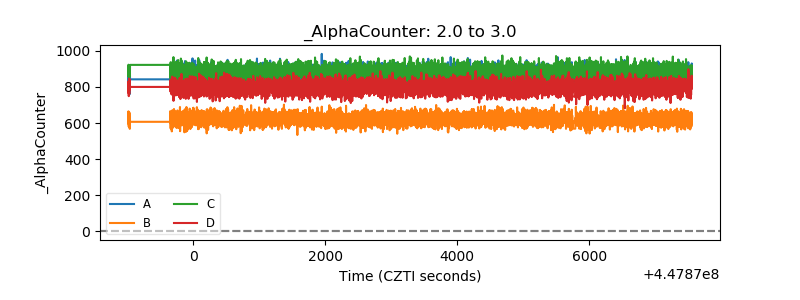 |
| _CPM_Rate | 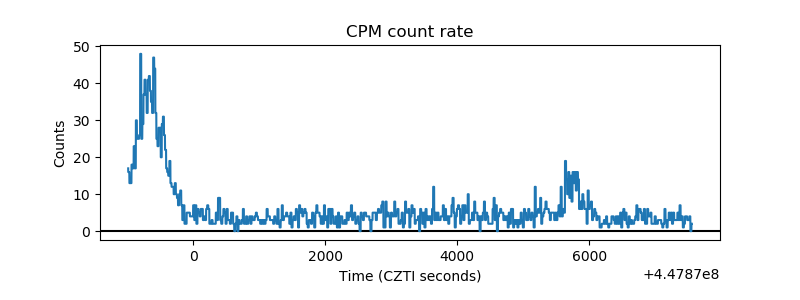 |
| CZT Counter | 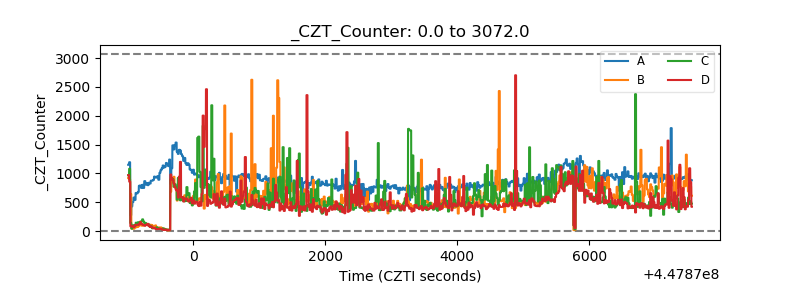 |
| +2.5 Volts monitor | 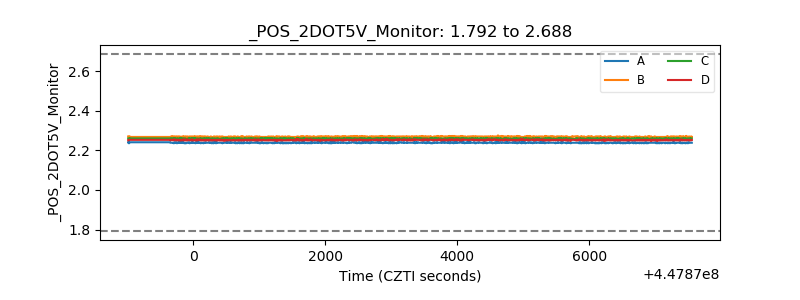 |
| +5 Volts monitor | 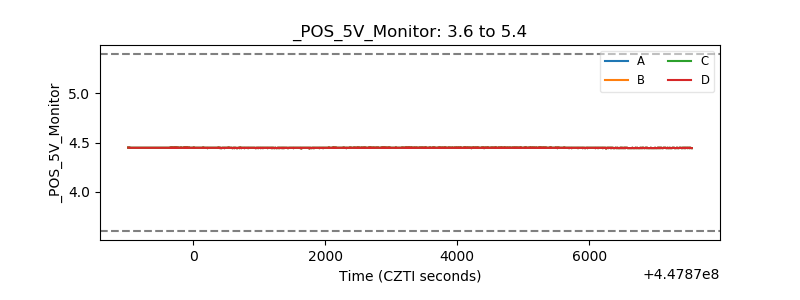 |
| _ROLL_ROT | 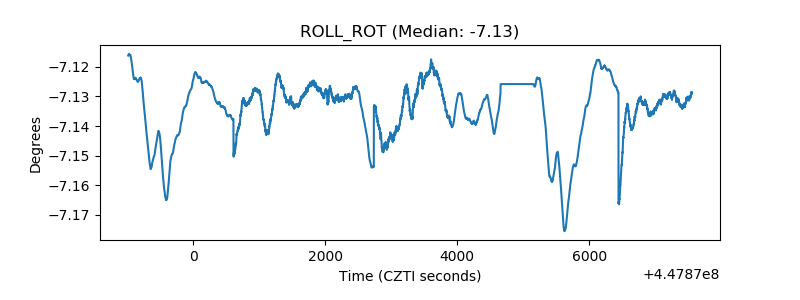 |
| _Roll_DEC | 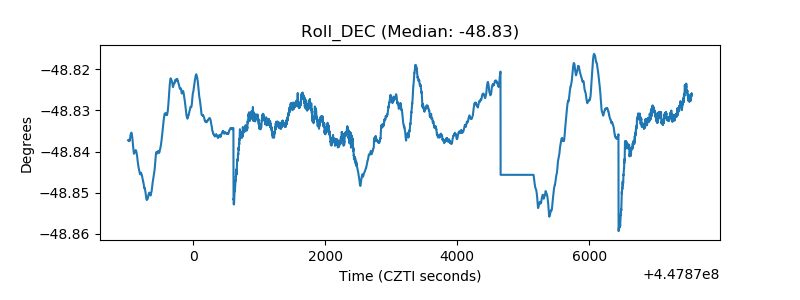 |
| _Roll_RA |  |
| Veto Counter | 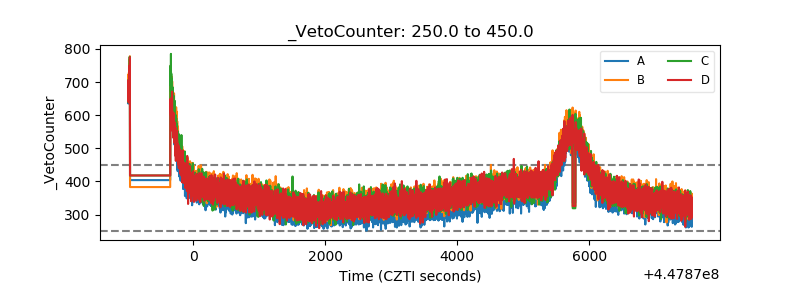 |