| Param | Original file | Final file |
|---|---|---|
| Filename | modeM0/AS1A13_028T01_9000006122_45711cztM0_level2.fits | modeM0/AS1A13_028T01_9000006122_45711cztM0_level2_quad_clean.evt |
| Size (bytes) | 669,121,920 | 139,867,200 |
| Size | 638.1 MB | 133.4 MB |
| Events in quadrant A | 7,809,892 | 919,887 |
| Events in quadrant B | 5,745,190 | 943,932 |
| Events in quadrant C | 5,336,028 | 929,376 |
| Events in quadrant D | 5,207,054 | 840,293 |
| Mode SS | |||
|---|---|---|---|
| Quadrant | BADHDUFLAG | Total packets | Discarded packets |
| A | 0 | 174 | 0 |
| B | 0 | 174 | 0 |
| C | 0 | 174 | 0 |
| D | 0 | 174 | 0 |
| Mode M9 | |||
|---|---|---|---|
| Quadrant | BADHDUFLAG | Total packets | Discarded packets |
| A | 0 | 1 | 0 |
| B | 0 | 1 | 0 |
| C | 0 | 1 | 0 |
| D | 0 | 1 | 0 |
| Mode M0 | |||
|---|---|---|---|
| Quadrant | BADHDUFLAG | Total packets | Discarded packets |
| A | 0 | 29117 | 1 |
| B | 0 | 22972 | 1 |
| C | 0 | 21667 | 3 |
| D | 0 | 21592 | 1 |
| Quadrant | Total seconds | Saturated seconds | Saturation percentage |
|---|---|---|---|
| A | 8662 | 401 | 4.629416% |
| B | 8663 | 365 | 4.213321% |
| C | 8662 | 94 | 1.085200% |
| D | 8662 | 277 | 3.197876% |
Noise dominated data is calculated using 1-second bins in cleaned event files. If a bin has >2000 counts, and if more than 50% of those come from <1% of pixels, then it is considered to be noise-dominated and hence unusable.
| Quadrant | # 1 sec bins | Bins with >0 counts | Bins with >2000 counts | High rate bins dominated by noise | Noise dominated (total time) | Noise dominated (detector-on time) | Marked lightcurve |
|---|---|---|---|---|---|---|---|
| A | 8702 | 8663 | 28 | 28 | 0.32% | 0.32% | 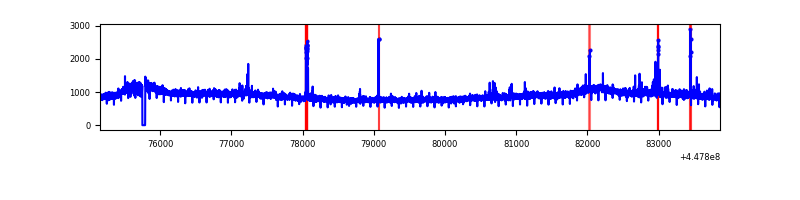 |
| B | 8703 | 8663 | 35 | 35 | 0.40% | 0.40% | 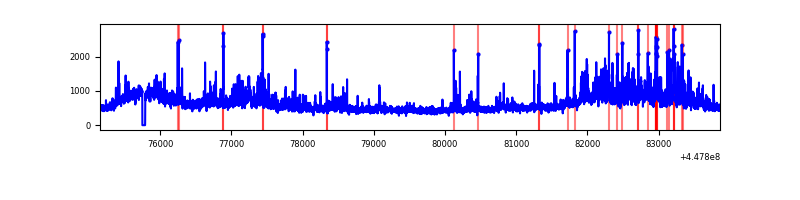 |
| C | 8702 | 8662 | 23 | 23 | 0.26% | 0.27% | 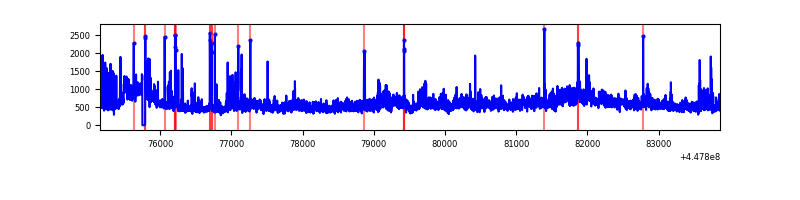 |
| D | 8702 | 8663 | 207 | 207 | 2.38% | 2.39% | 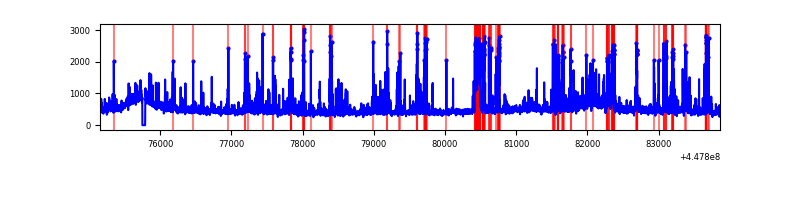 |
Top three noisy pixels from each quadrant. If the there are fewer than three noisy pixels in the level2.evt file, extra rows are filled as -1
| Pixel properties | Quadrant properties | ||||||
|---|---|---|---|---|---|---|---|
| Quadrant | DetID | PixID | Counts | Sigma | Mean | Median | Sigma |
| A | 10 | 83 | 3703143 | 17289.55 | 1017 | 993 | 214.1 |
| A | 15 | 174 | 43883 | 200.3 | 1017 | 993 | 214.1 |
| A | 2 | 79 | 38705 | 176.12 | 1017 | 993 | 214.1 |
| B | 3 | 112 | 1408543 | 7008.98 | 1012 | 979 | 200.8 |
| B | 12 | 18 | 80511 | 396.03 | 1012 | 979 | 200.8 |
| B | 5 | 172 | 68744 | 337.44 | 1012 | 979 | 200.8 |
| C | 9 | 54 | 1276944 | 5460.02 | 990 | 993 | 233.7 |
| C | 14 | 254 | 117912 | 500.32 | 990 | 993 | 233.7 |
| C | 3 | 233 | 30812 | 127.6 | 990 | 993 | 233.7 |
| D | 13 | 249 | 615093 | 2437.84 | 990 | 956 | 251.9 |
| D | 2 | 249 | 268094 | 1060.42 | 990 | 956 | 251.9 |
| D | 5 | 171 | 166432 | 656.86 | 990 | 956 | 251.9 |
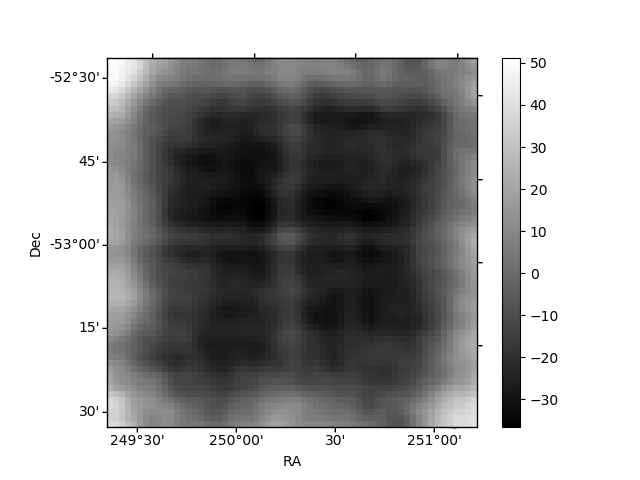
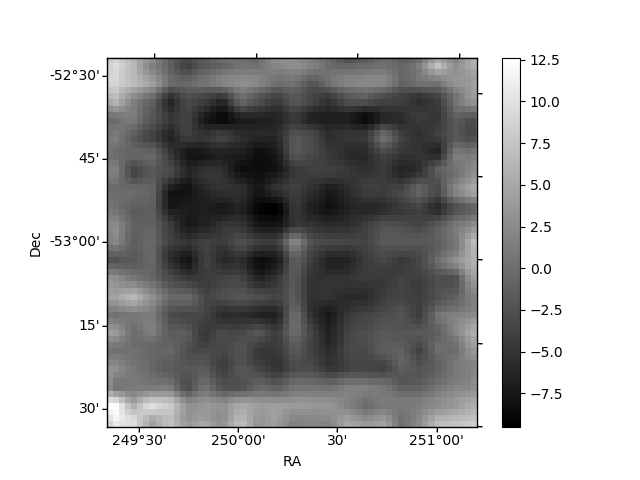
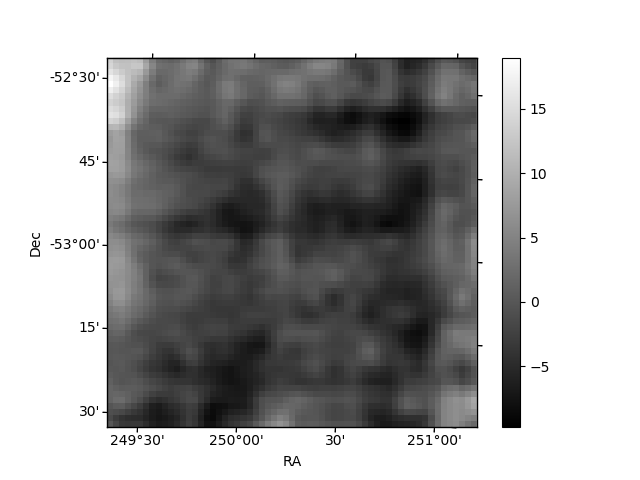
Histogram calculated using DETX and DETY for each event in the final _common_clean file
| Quadrant A | 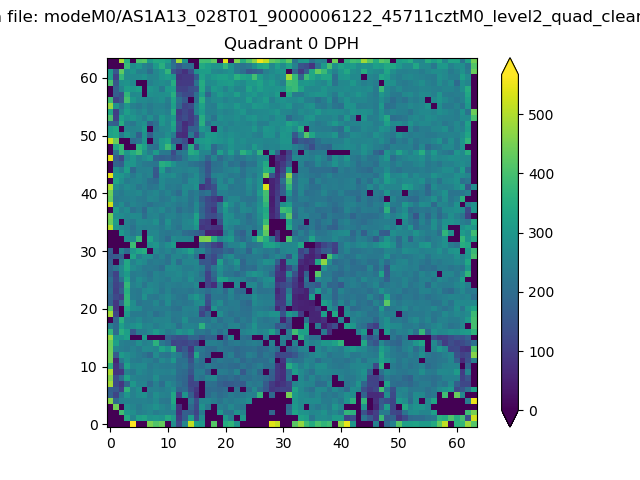 |
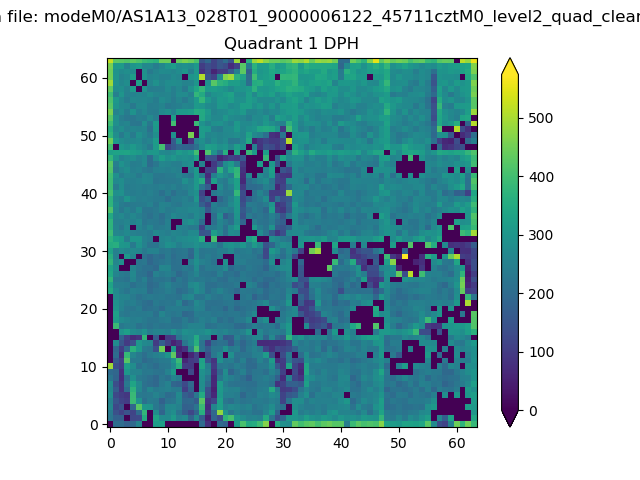 |
Quadrant B |
|---|---|---|---|
| Quadrant D | 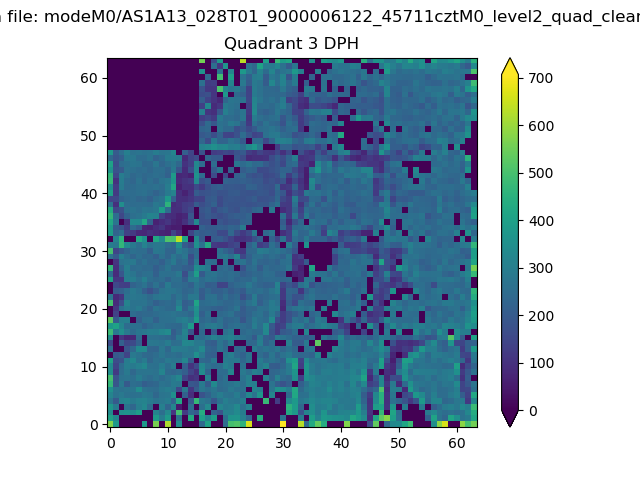 |
 |
Quadrant C |
| Plot type | Count rate plots | Images |
|---|---|---|
| Comparison with Poisson distribution Blue bars denote a histogram of data divided into 1 sec bins. Red curve is a Poisson curve with rate = median count rate of data. |
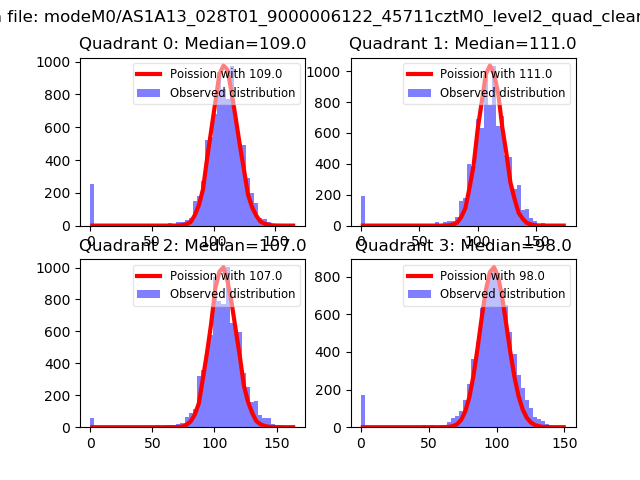 |
 |
| Quadrant-wise count rates Data is divided into 100 sec bins |
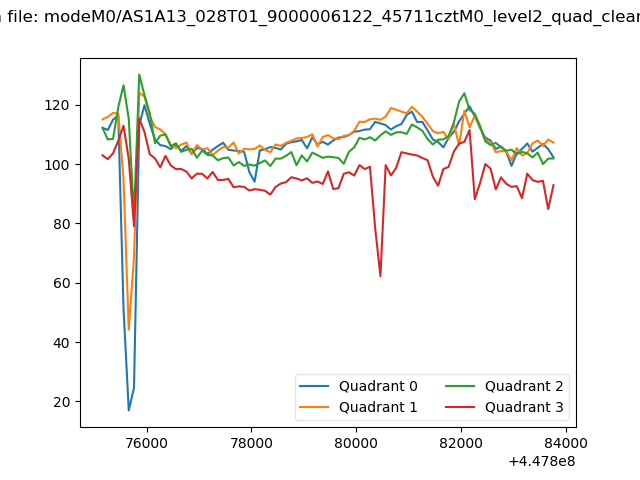 |
|
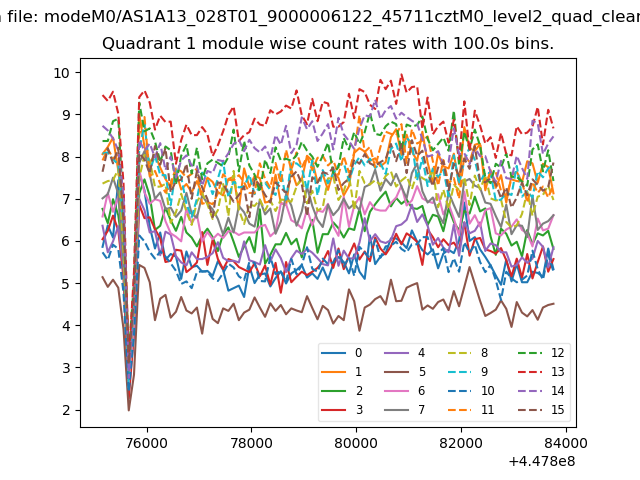
| Module-wise count rates for Quadrant A Data is divided into 100 sec bins |
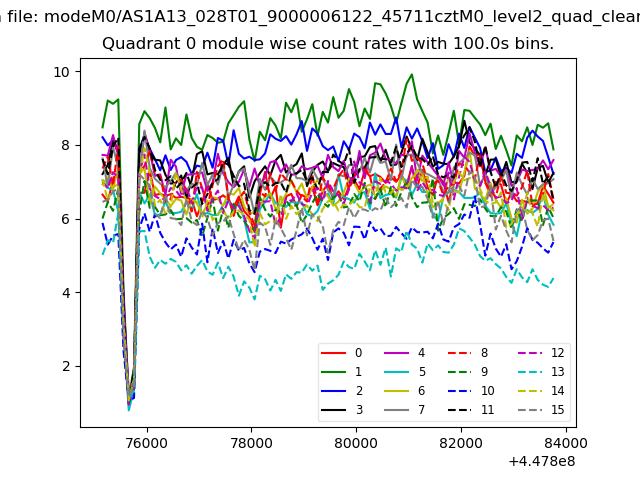 |
 |
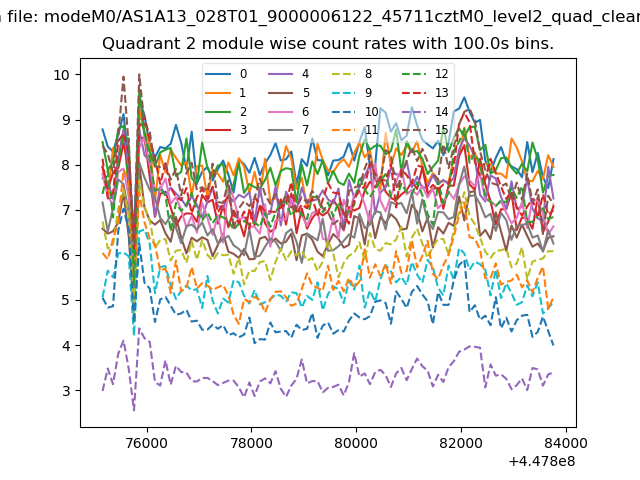
| Module-wise count rates for Quadrant B Data is divided into 100 sec bins |
 |
 |
| Module-wise count rates for Quadrant C Data is divided into 100 sec bins |
 |
 |
| Module-wise count rates for Quadrant D Data is divided into 100 sec bins |
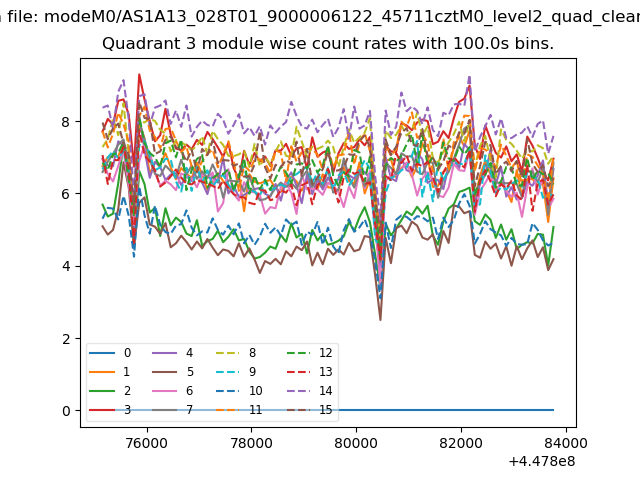 |
 |
| Parameter | Plot |
|---|---|
| CZT HV Monitor | 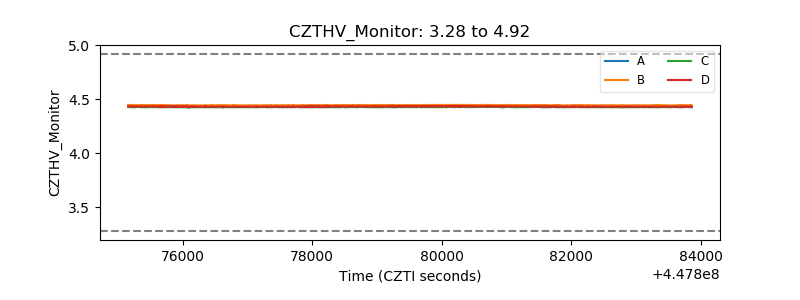 |
| D_VDD | 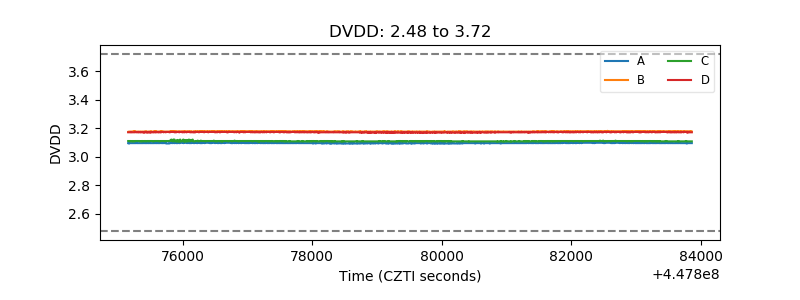 |
| Temperature 1 | 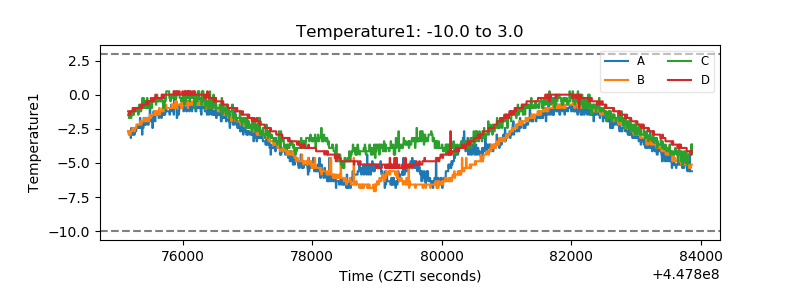 |
| Veto HV Monitor | 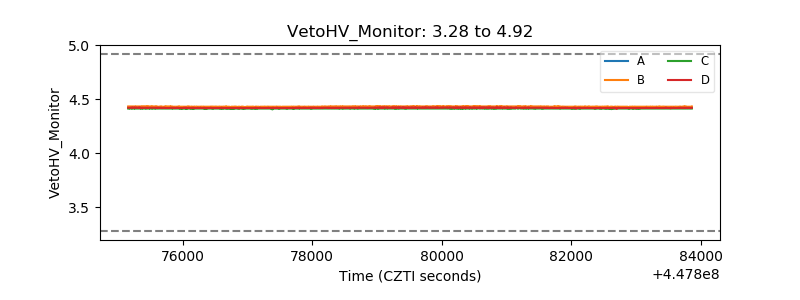 |
| Veto LLD | 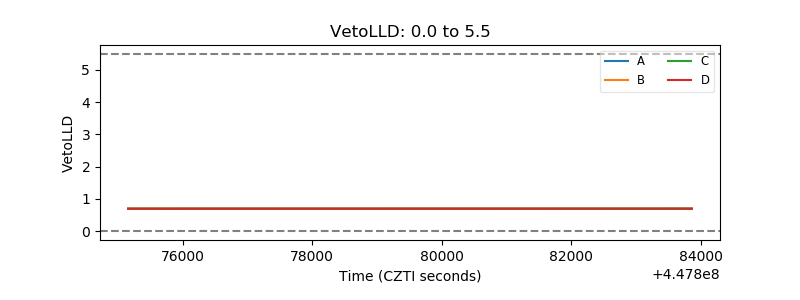 |
| Alpha Counter | 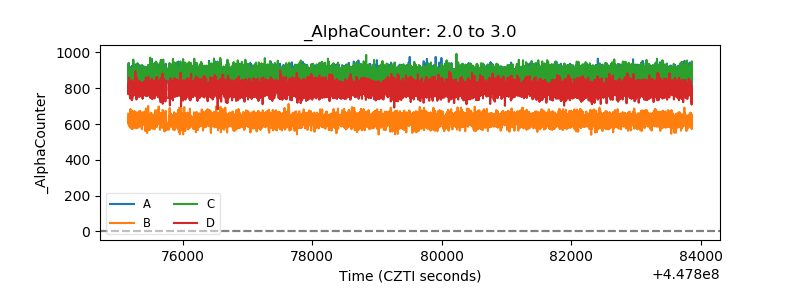 |
| _CPM_Rate | 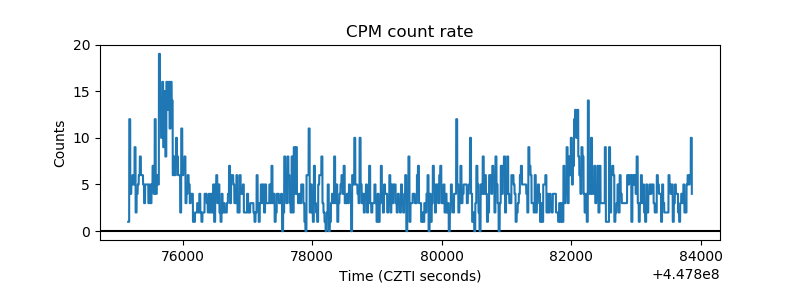 |
| CZT Counter |  |
| +2.5 Volts monitor | 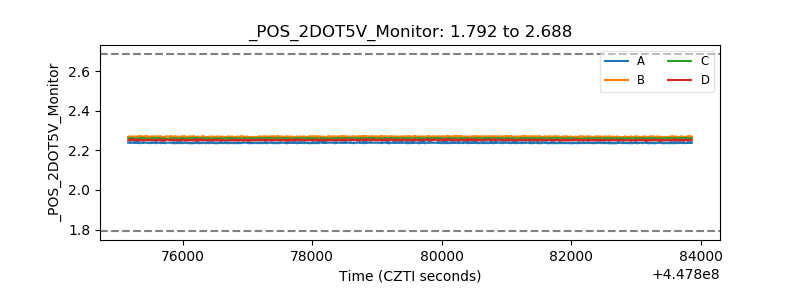 |
| +5 Volts monitor | 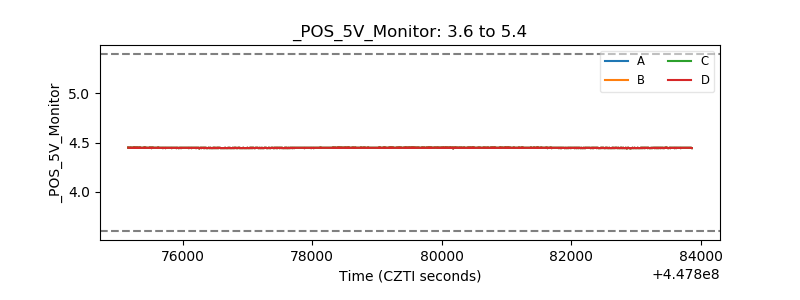 |
| _ROLL_ROT | 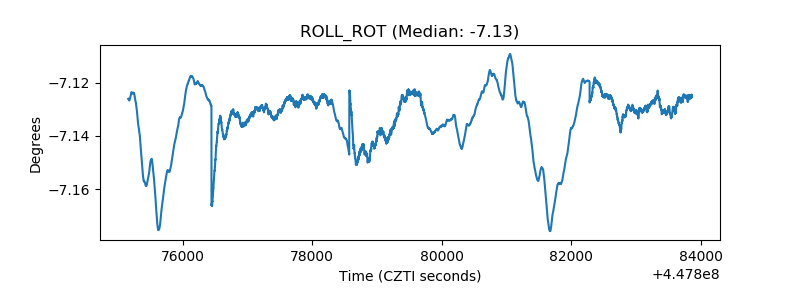 |
| _Roll_DEC | 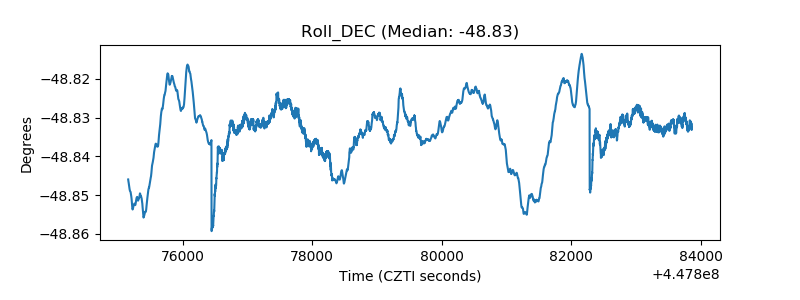 |
| _Roll_RA | 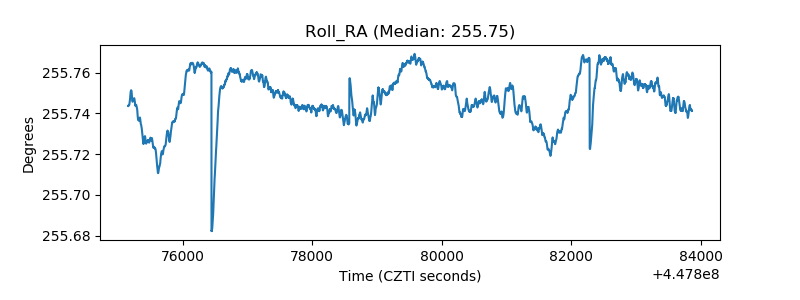 |
| Veto Counter | 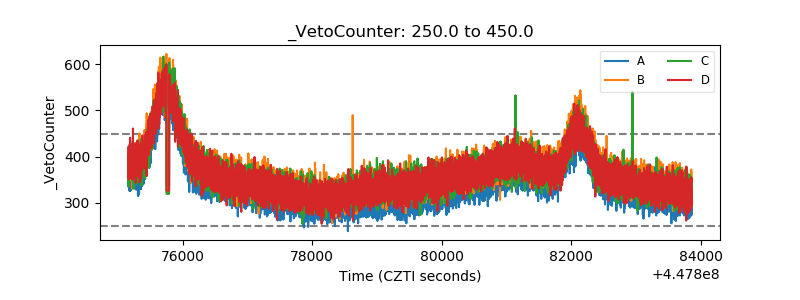 |