| Param | Original file | Final file |
|---|---|---|
| Filename | modeM0/AS1A13_028T01_9000006122_45712cztM0_level2.fits | modeM0/AS1A13_028T01_9000006122_45712cztM0_level2_quad_clean.evt |
| Size (bytes) | 617,241,600 | 125,159,040 |
| Size | 588.6 MB | 119.4 MB |
| Events in quadrant A | 6,766,138 | 844,743 |
| Events in quadrant B | 5,318,316 | 843,062 |
| Events in quadrant C | 5,351,707 | 826,264 |
| Events in quadrant D | 4,804,642 | 729,583 |
| Mode SS | |||
|---|---|---|---|
| Quadrant | BADHDUFLAG | Total packets | Discarded packets |
| A | 0 | 158 | 0 |
| B | 0 | 158 | 0 |
| C | 0 | 158 | 0 |
| D | 0 | 158 | 0 |
| Mode M0 | |||
|---|---|---|---|
| Quadrant | BADHDUFLAG | Total packets | Discarded packets |
| A | 0 | 25454 | 0 |
| B | 0 | 21092 | 0 |
| C | 0 | 21558 | 0 |
| D | 0 | 19897 | 0 |
| Quadrant | Total seconds | Saturated seconds | Saturation percentage |
|---|---|---|---|
| A | 7845 | 169 | 2.154238% |
| B | 7845 | 356 | 4.537922% |
| C | 7845 | 106 | 1.351179% |
| D | 7845 | 382 | 4.869344% |
Noise dominated data is calculated using 1-second bins in cleaned event files. If a bin has >2000 counts, and if more than 50% of those come from <1% of pixels, then it is considered to be noise-dominated and hence unusable.
| Quadrant | # 1 sec bins | Bins with >0 counts | Bins with >2000 counts | High rate bins dominated by noise | Noise dominated (total time) | Noise dominated (detector-on time) | Marked lightcurve |
|---|---|---|---|---|---|---|---|
| A | 7845 | 7845 | 9 | 9 | 0.11% | 0.11% | 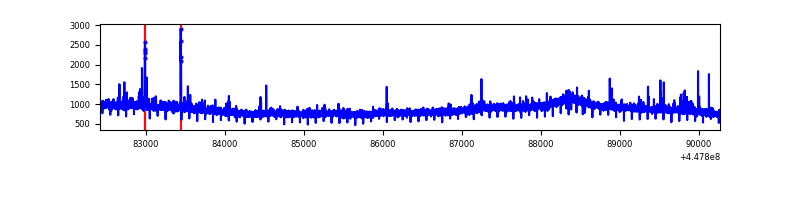 |
| B | 7845 | 7845 | 131 | 131 | 1.67% | 1.67% | 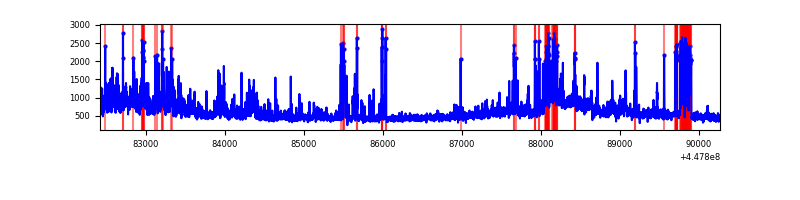 |
| C | 7845 | 7845 | 57 | 57 | 0.73% | 0.73% | 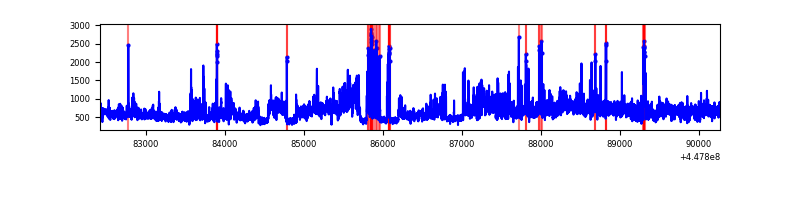 |
| D | 7845 | 7845 | 305 | 305 | 3.89% | 3.89% | 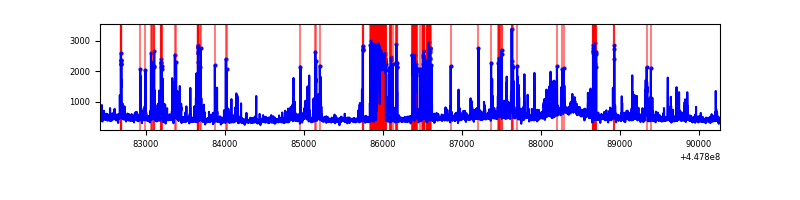 |
Top three noisy pixels from each quadrant. If the there are fewer than three noisy pixels in the level2.evt file, extra rows are filled as -1
| Pixel properties | Quadrant properties | ||||||
|---|---|---|---|---|---|---|---|
| Quadrant | DetID | PixID | Counts | Sigma | Mean | Median | Sigma |
| A | 10 | 83 | 3221339 | 17365.14 | 881 | 860 | 185.5 |
| A | 2 | 79 | 69754 | 371.48 | 881 | 860 | 185.5 |
| A | 13 | 248 | 29261 | 153.14 | 881 | 860 | 185.5 |
| B | 3 | 112 | 1194607 | 7013.94 | 871 | 846 | 170.2 |
| B | 5 | 172 | 213567 | 1249.84 | 871 | 846 | 170.2 |
| B | 15 | 201 | 201118 | 1176.69 | 871 | 846 | 170.2 |
| C | 9 | 54 | 1636006 | 8153.7 | 857 | 863 | 200.5 |
| C | 1 | 241 | 194593 | 966.04 | 857 | 863 | 200.5 |
| C | 14 | 254 | 87356 | 431.3 | 857 | 863 | 200.5 |
| D | 13 | 249 | 863339 | 4041.47 | 837 | 811 | 213.4 |
| D | 1 | 52 | 180105 | 840.1 | 837 | 811 | 213.4 |
| D | 2 | 249 | 130154 | 606.05 | 837 | 811 | 213.4 |
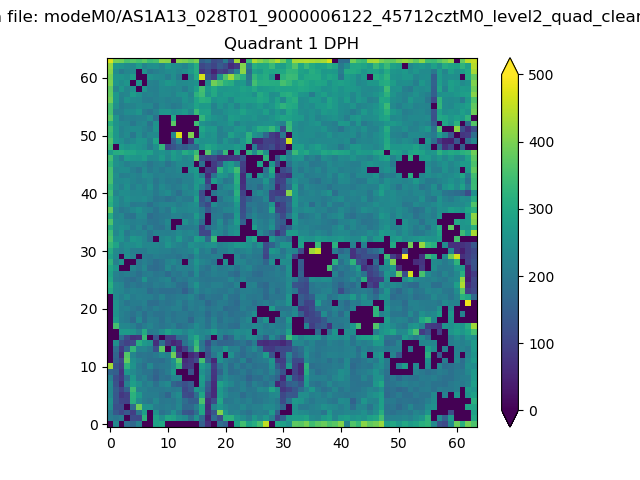
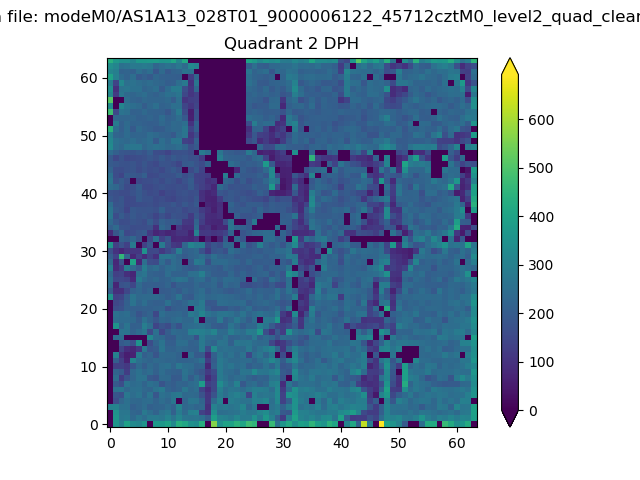
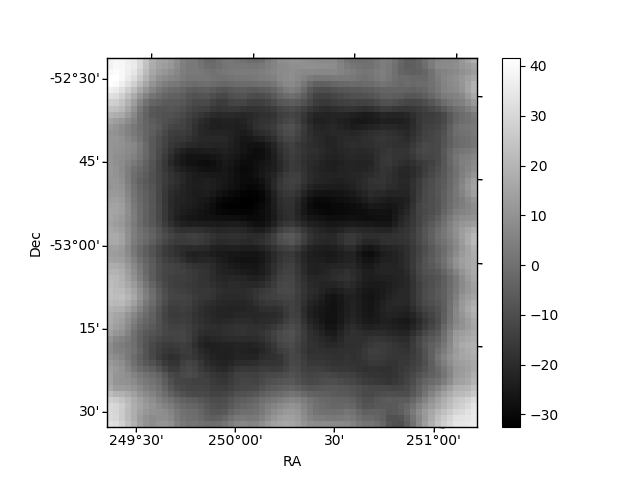
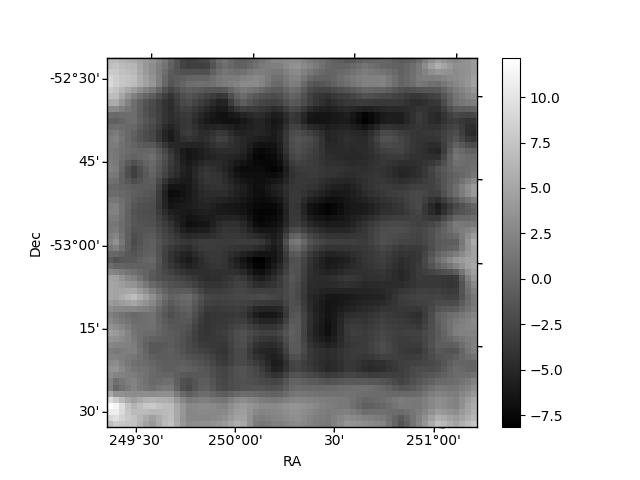
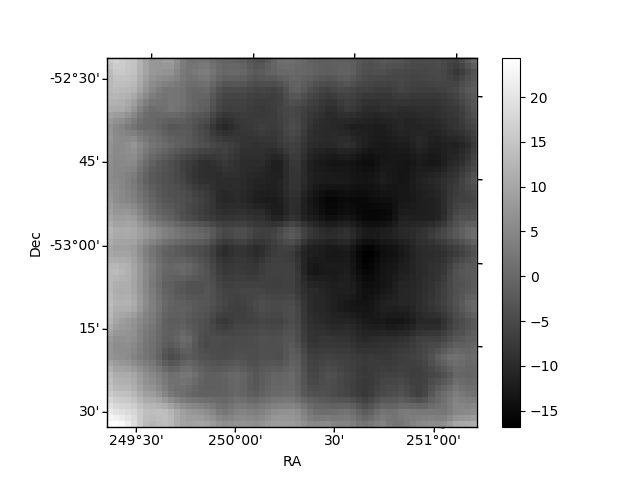
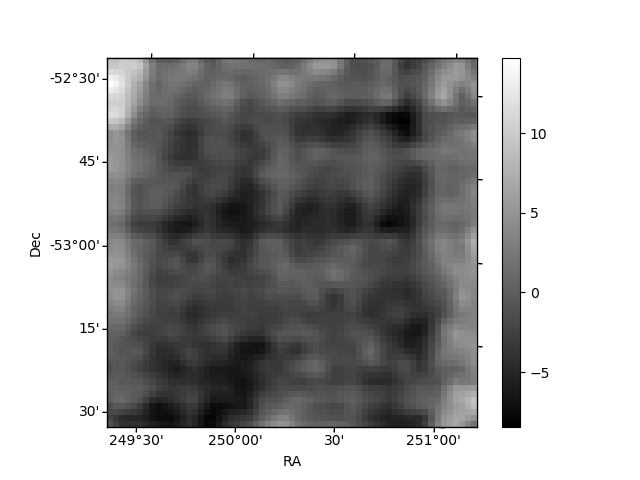
Histogram calculated using DETX and DETY for each event in the final _common_clean file
| Quadrant A |  |
 |
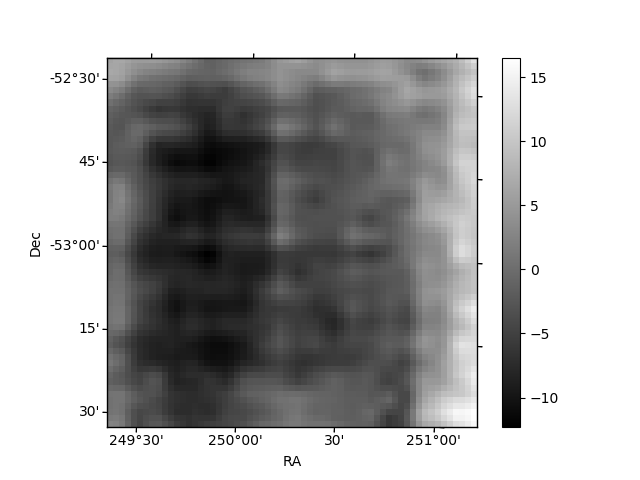
Quadrant B |
|---|---|---|---|
| Quadrant D | 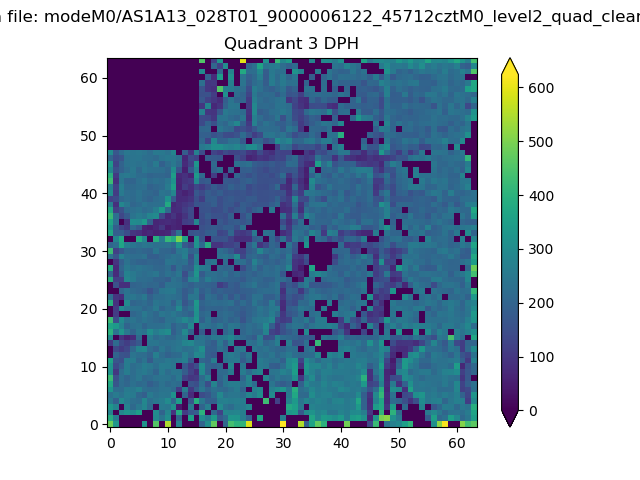 |
 |
Quadrant C |
| Plot type | Count rate plots | Images |
|---|---|---|
| Comparison with Poisson distribution Blue bars denote a histogram of data divided into 1 sec bins. Red curve is a Poisson curve with rate = median count rate of data. |
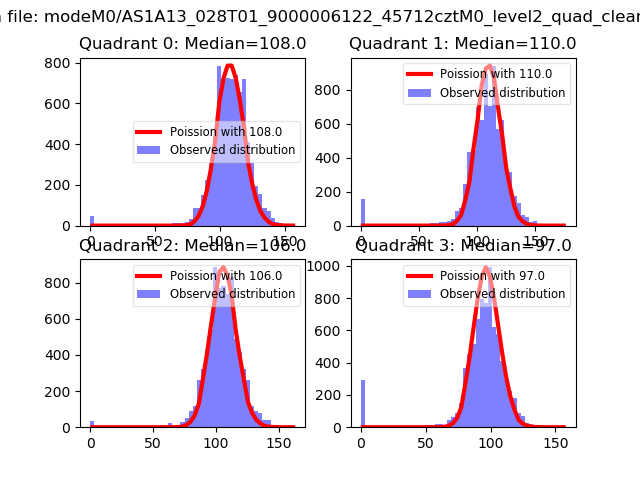 |
 |
| Quadrant-wise count rates Data is divided into 100 sec bins |
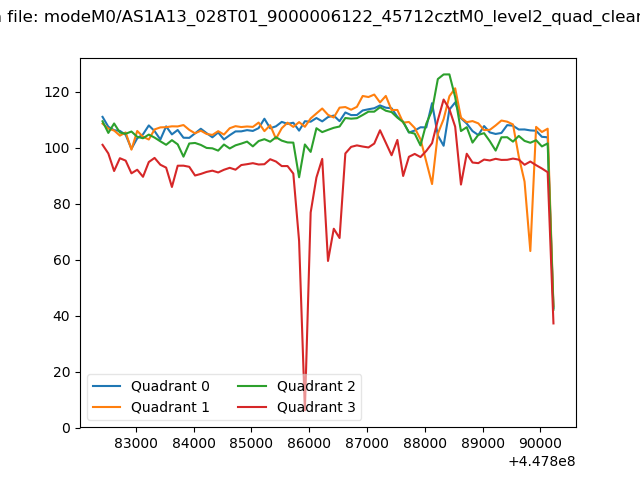 |
|
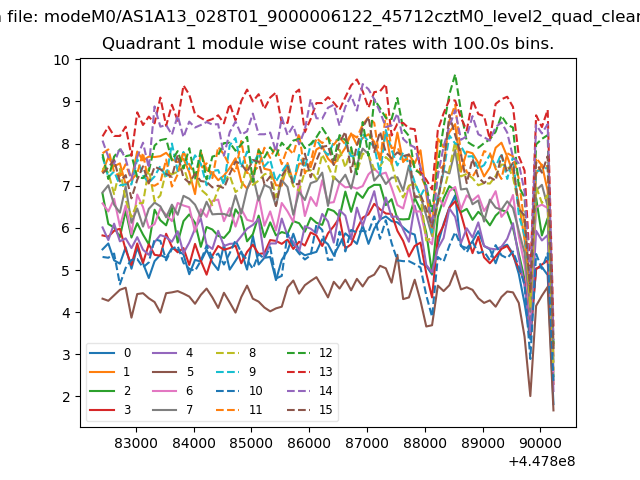
| Module-wise count rates for Quadrant A Data is divided into 100 sec bins |
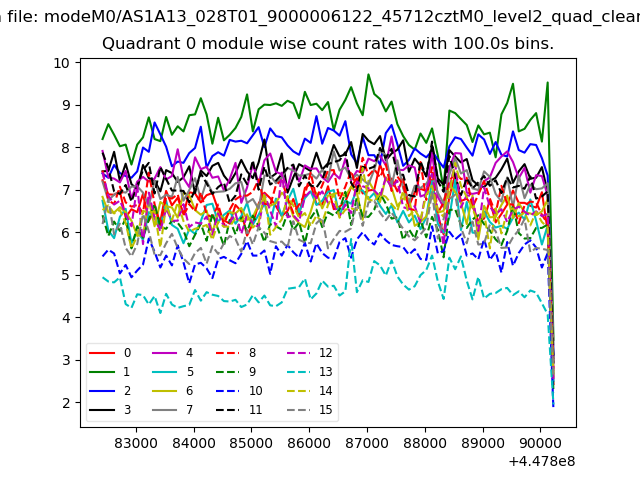 |
 |
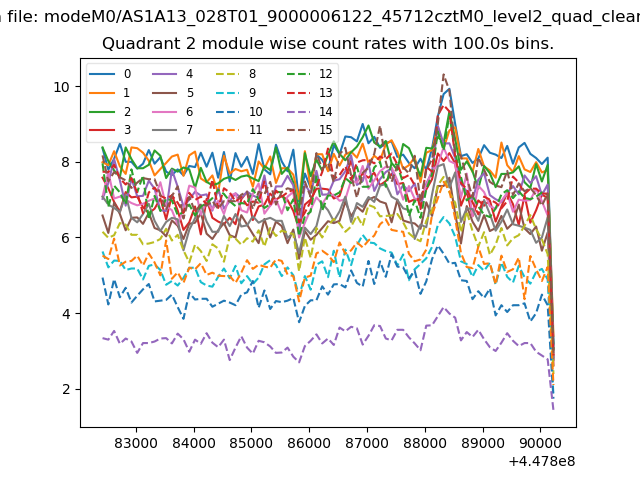
| Module-wise count rates for Quadrant B Data is divided into 100 sec bins |
 |
 |
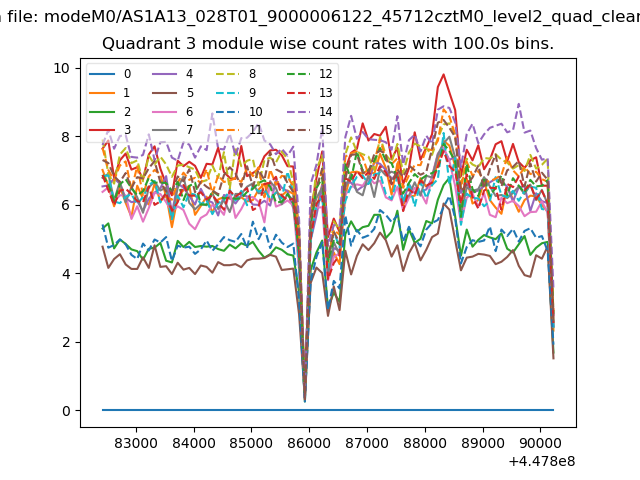
| Module-wise count rates for Quadrant C Data is divided into 100 sec bins |
 |
 |
| Module-wise count rates for Quadrant D Data is divided into 100 sec bins |
 |
 |
| Parameter | Plot |
|---|---|
| CZT HV Monitor |  |
| D_VDD | 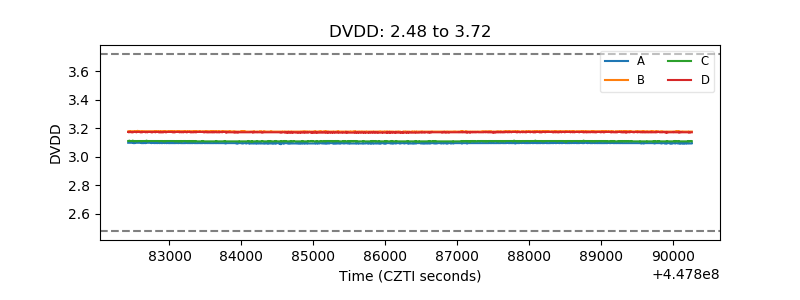 |
| Temperature 1 | 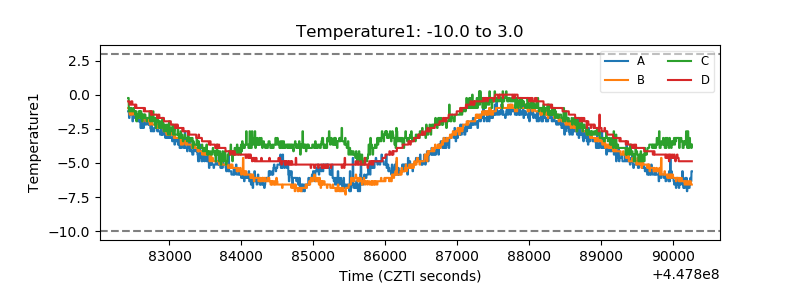 |
| Veto HV Monitor | 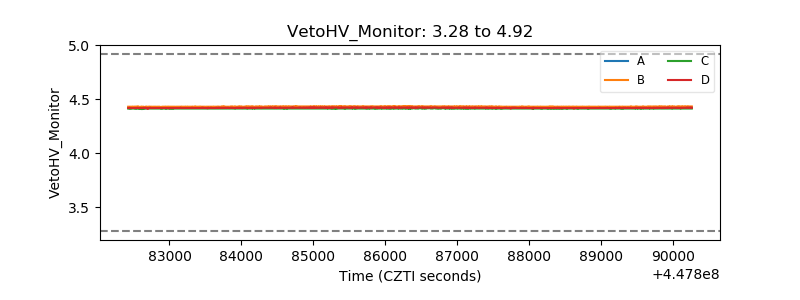 |
| Veto LLD | 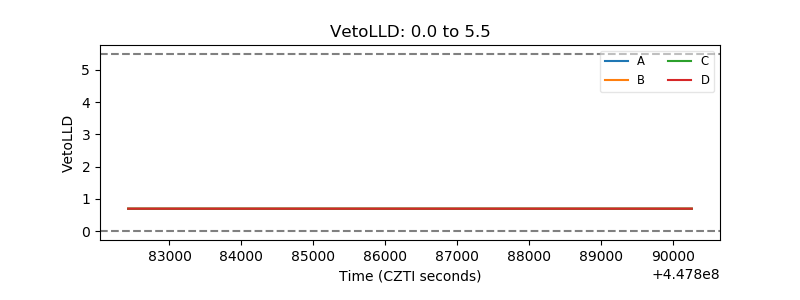 |
| Alpha Counter | 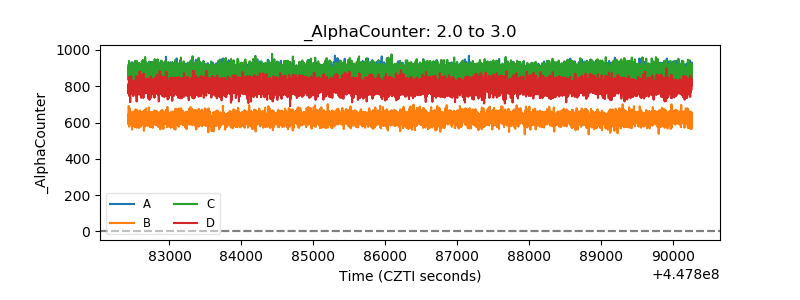 |
| _CPM_Rate | 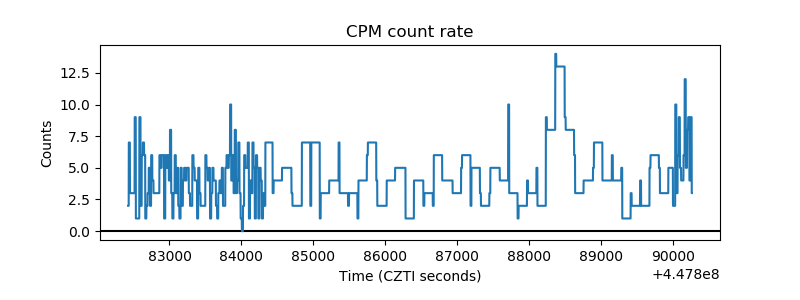 |
| CZT Counter | 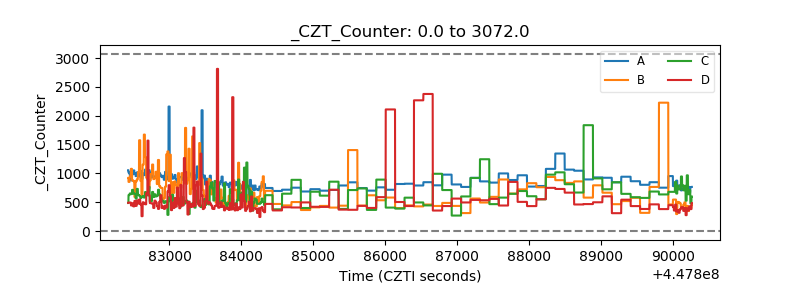 |
| +2.5 Volts monitor | 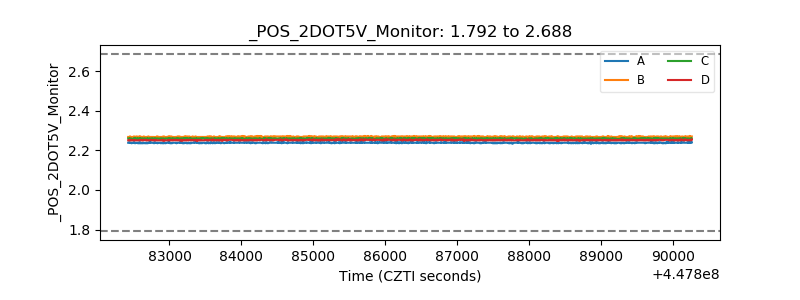 |
| +5 Volts monitor | 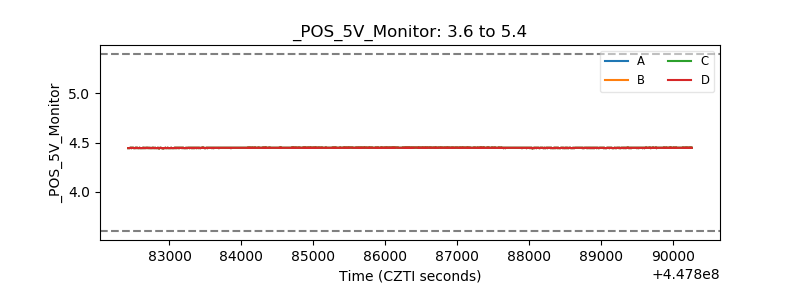 |
| _ROLL_ROT | 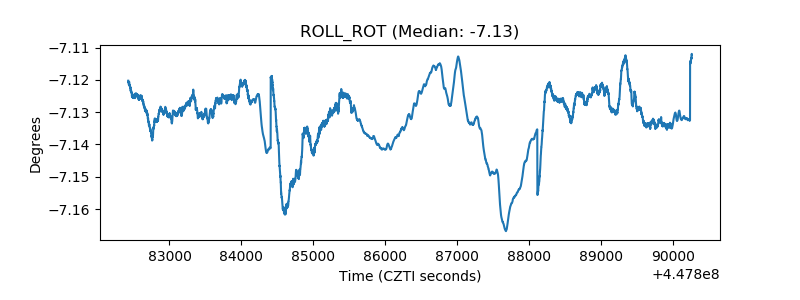 |
| _Roll_DEC | 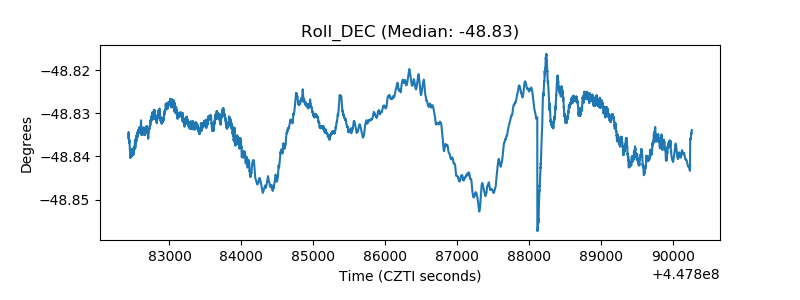 |
| _Roll_RA | 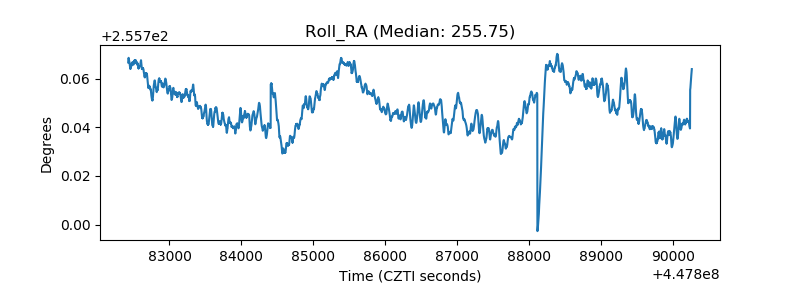 |
| Veto Counter | 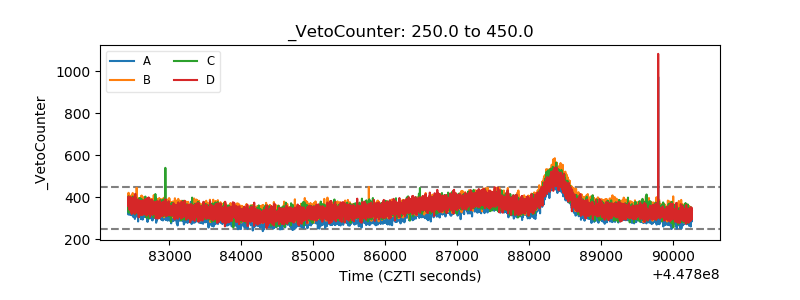 |