| Param | Original file | Final file |
|---|---|---|
| Filename | modeM0/AS1A13_028T01_9000006122_45718cztM0_level2.fits | modeM0/AS1A13_028T01_9000006122_45718cztM0_level2_quad_clean.evt |
| Size (bytes) | 1,002,340,800 | 193,380,480 |
| Size | 955.9 MB | 184.4 MB |
| Events in quadrant A | 10,640,474 | 1,314,274 |
| Events in quadrant B | 8,489,386 | 1,297,923 |
| Events in quadrant C | 8,028,816 | 1,304,696 |
| Events in quadrant D | 8,986,195 | 1,080,498 |
| Mode SS | |||
|---|---|---|---|
| Quadrant | BADHDUFLAG | Total packets | Discarded packets |
| A | 0 | 250 | 0 |
| B | 0 | 250 | 0 |
| C | 0 | 250 | 0 |
| D | 0 | 250 | 0 |
| Mode M9 | |||
|---|---|---|---|
| Quadrant | BADHDUFLAG | Total packets | Discarded packets |
| A | 0 | 10 | 0 |
| B | 0 | 10 | 0 |
| C | 0 | 10 | 0 |
| D | 0 | 10 | 0 |
| Mode M0 | |||
|---|---|---|---|
| Quadrant | BADHDUFLAG | Total packets | Discarded packets |
| A | 0 | 40435 | 2 |
| B | 0 | 33660 | 3 |
| C | 0 | 32783 | 2 |
| D | 0 | 35462 | 2 |
| Quadrant | Total seconds | Saturated seconds | Saturation percentage |
|---|---|---|---|
| A | 12406 | 373 | 3.006610% |
| B | 12406 | 775 | 6.246977% |
| C | 12406 | 170 | 1.370305% |
| D | 12406 | 1143 | 9.213284% |
Noise dominated data is calculated using 1-second bins in cleaned event files. If a bin has >2000 counts, and if more than 50% of those come from <1% of pixels, then it is considered to be noise-dominated and hence unusable.
| Quadrant | # 1 sec bins | Bins with >0 counts | Bins with >2000 counts | High rate bins dominated by noise | Noise dominated (total time) | Noise dominated (detector-on time) | Marked lightcurve |
|---|---|---|---|---|---|---|---|
| A | 13346 | 12407 | 19 | 19 | 0.14% | 0.15% | 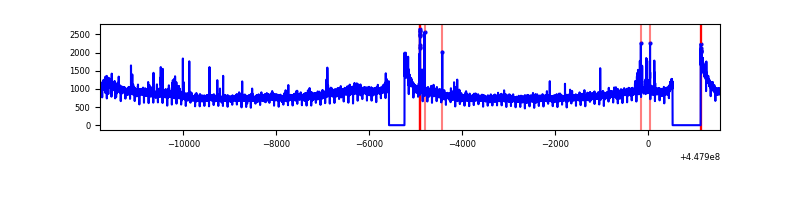 |
| B | 13346 | 12406 | 311 | 311 | 2.33% | 2.51% | 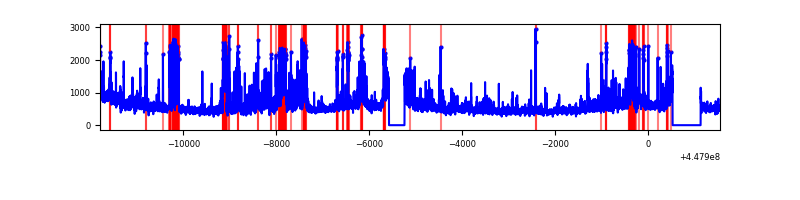 |
| C | 13346 | 12406 | 57 | 57 | 0.43% | 0.46% | 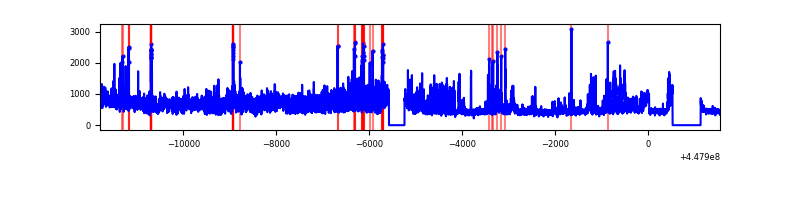 |
| D | 13346 | 12406 | 887 | 887 | 6.65% | 7.15% | 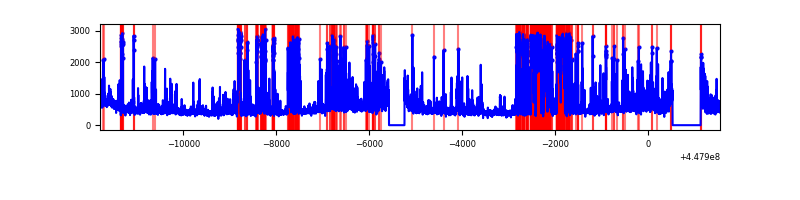 |
Top three noisy pixels from each quadrant. If the there are fewer than three noisy pixels in the level2.evt file, extra rows are filled as -1
| Pixel properties | Quadrant properties | ||||||
|---|---|---|---|---|---|---|---|
| Quadrant | DetID | PixID | Counts | Sigma | Mean | Median | Sigma |
| A | 10 | 83 | 5050760 | 17414.06 | 1400 | 1366 | 290.0 |
| A | 13 | 248 | 66207 | 223.62 | 1400 | 1366 | 290.0 |
| A | 2 | 79 | 35249 | 116.85 | 1400 | 1366 | 290.0 |
| B | 15 | 201 | 1802584 | 6640.79 | 1381 | 1337 | 271.2 |
| B | 3 | 112 | 854047 | 3143.75 | 1381 | 1337 | 271.2 |
| B | 0 | 186 | 94738 | 344.35 | 1381 | 1337 | 271.2 |
| C | 9 | 54 | 2247361 | 6910.61 | 1377 | 1385 | 325.0 |
| C | 14 | 254 | 157886 | 481.54 | 1377 | 1385 | 325.0 |
| C | 3 | 233 | 120106 | 365.29 | 1377 | 1385 | 325.0 |
| D | 13 | 249 | 2265800 | 6890.3 | 1303 | 1263 | 328.7 |
| D | 1 | 52 | 864744 | 2627.31 | 1303 | 1263 | 328.7 |
| D | 2 | 249 | 211015 | 638.21 | 1303 | 1263 | 328.7 |
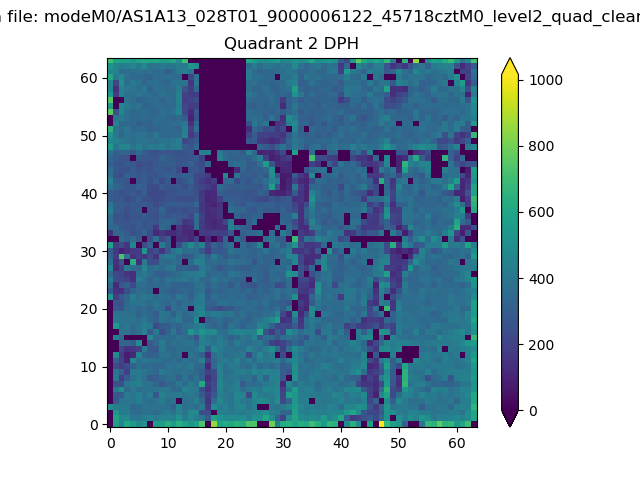
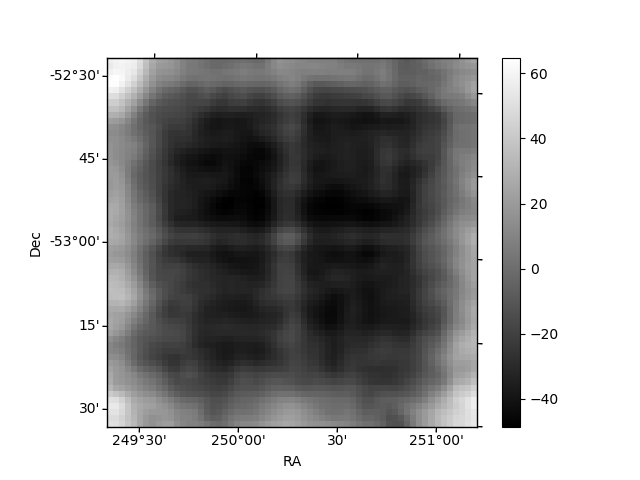
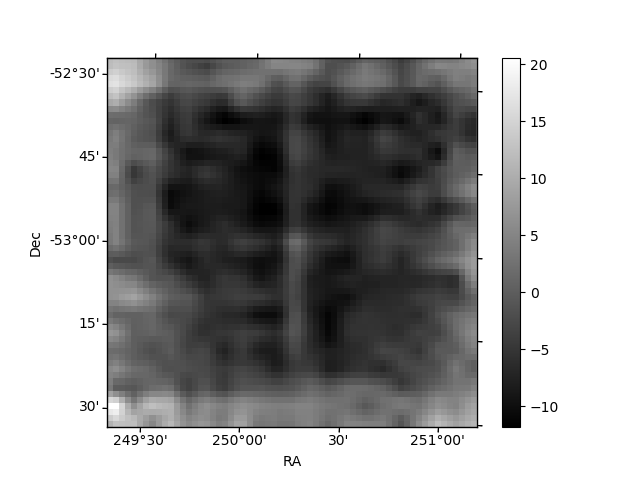
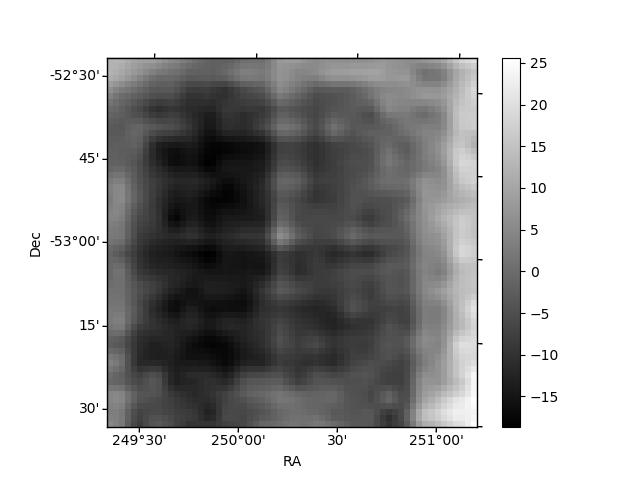
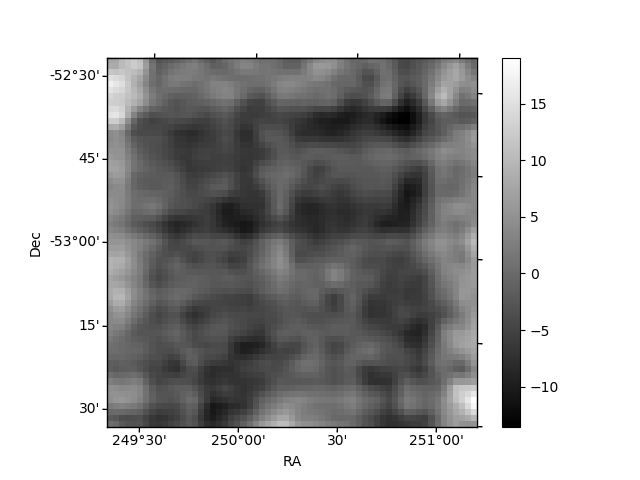
Histogram calculated using DETX and DETY for each event in the final _common_clean file
| Quadrant A | 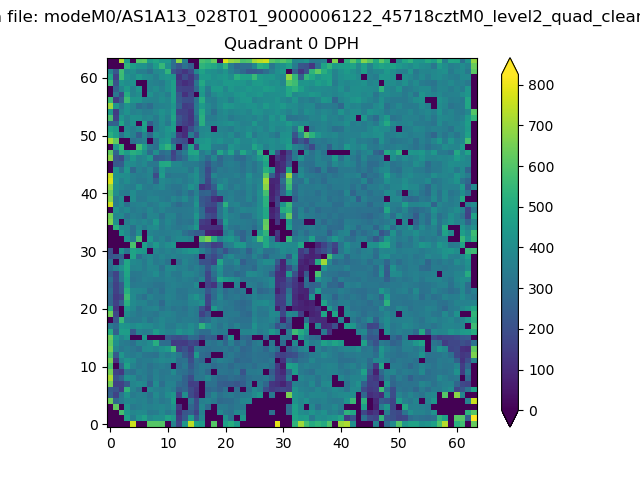 |
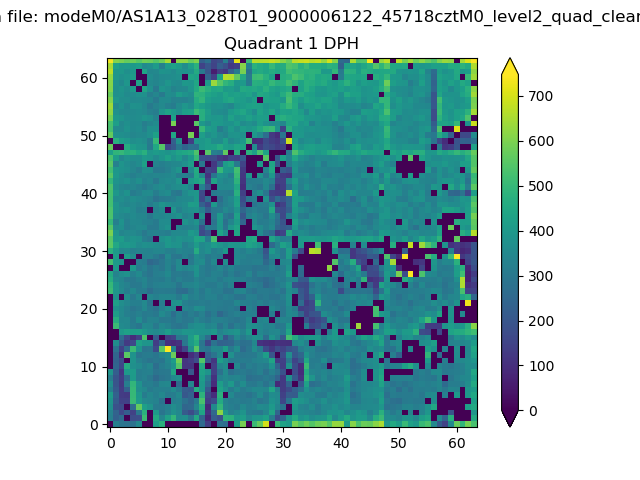 |
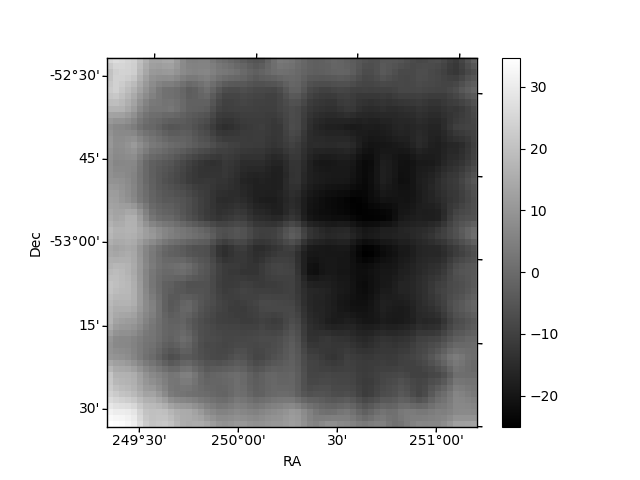
Quadrant B |
|---|---|---|---|
| Quadrant D | 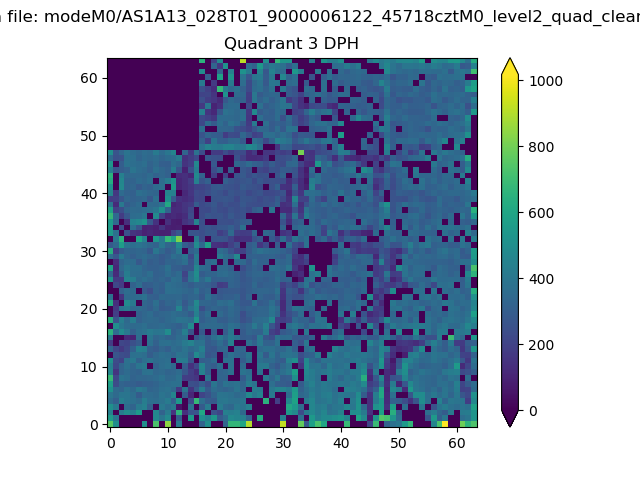 |
 |
Quadrant C |
| Plot type | Count rate plots | Images |
|---|---|---|
| Comparison with Poisson distribution Blue bars denote a histogram of data divided into 1 sec bins. Red curve is a Poisson curve with rate = median count rate of data. |
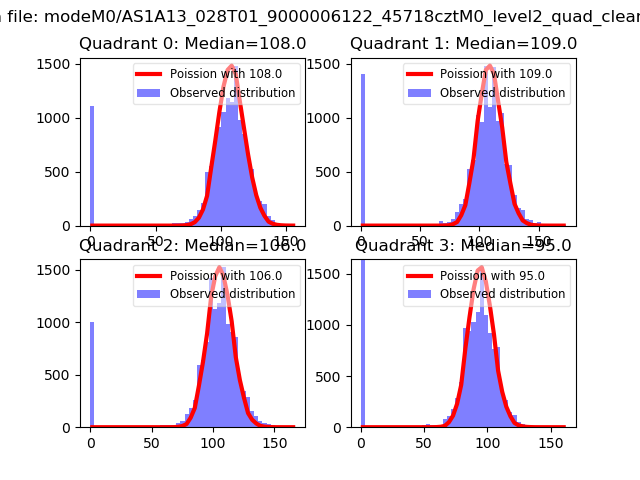 |
 |
| Quadrant-wise count rates Data is divided into 100 sec bins |
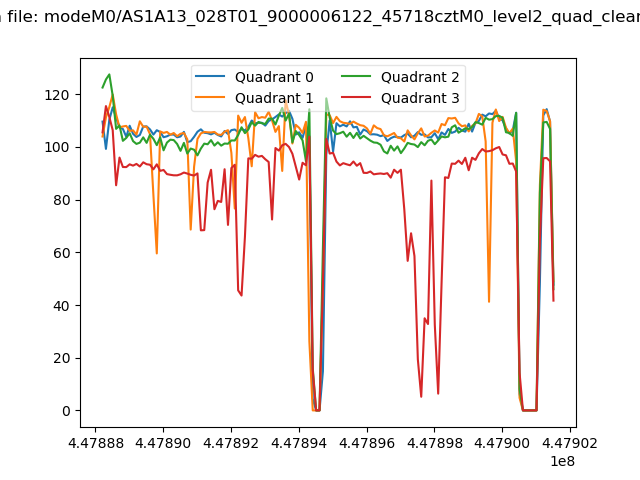 |
|
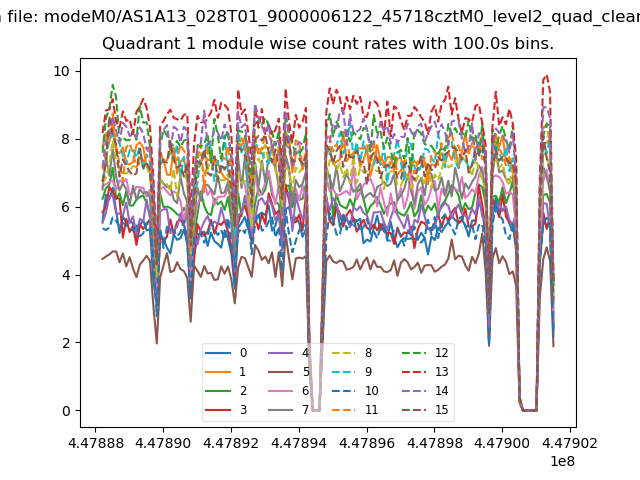
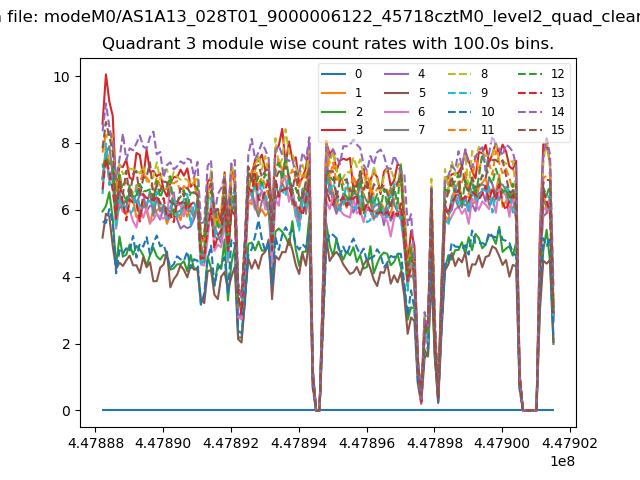
| Module-wise count rates for Quadrant A Data is divided into 100 sec bins |
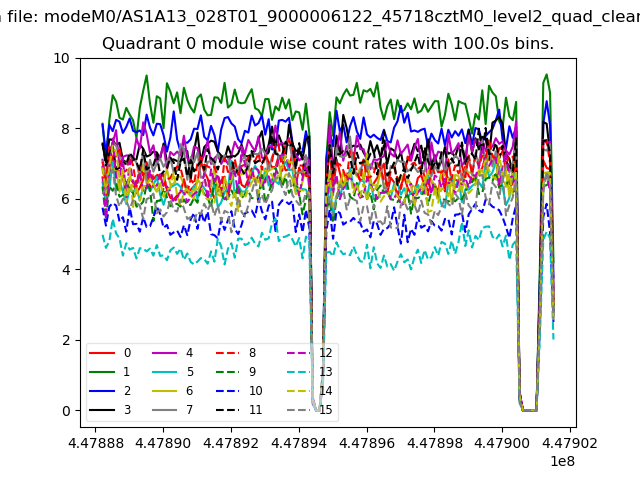 |
 |
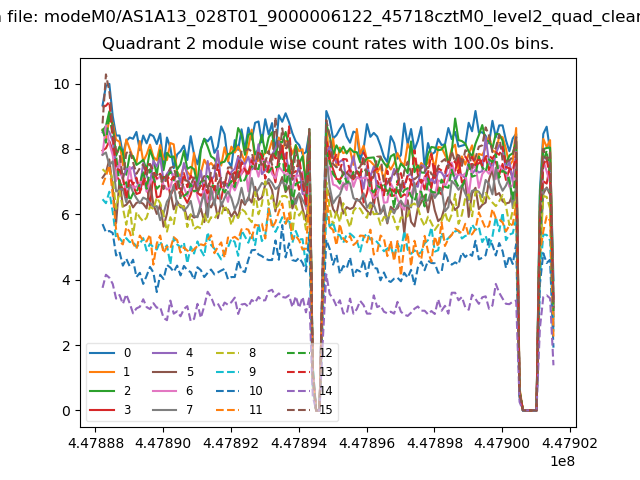
| Module-wise count rates for Quadrant B Data is divided into 100 sec bins |
 |
 |
| Module-wise count rates for Quadrant C Data is divided into 100 sec bins |
 |
 |
| Module-wise count rates for Quadrant D Data is divided into 100 sec bins |
 |
 |
| Parameter | Plot |
|---|---|
| CZT HV Monitor | 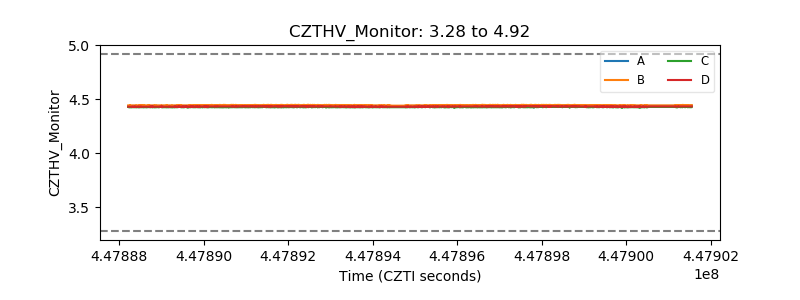 |
| D_VDD | 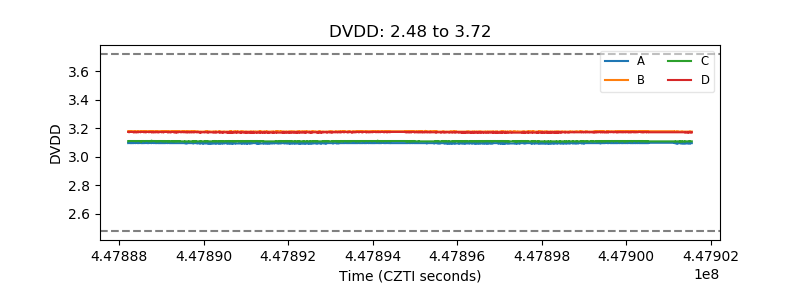 |
| Temperature 1 | 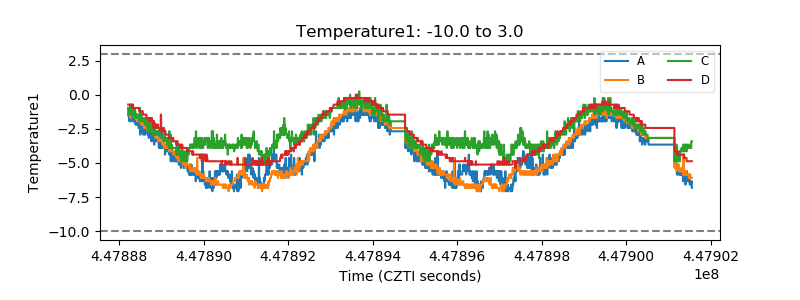 |
| Veto HV Monitor | 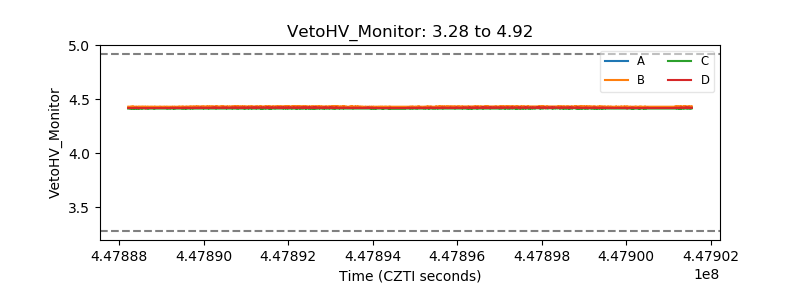 |
| Veto LLD | 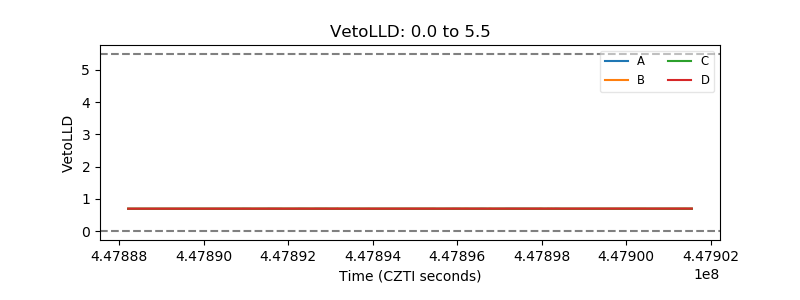 |
| Alpha Counter | 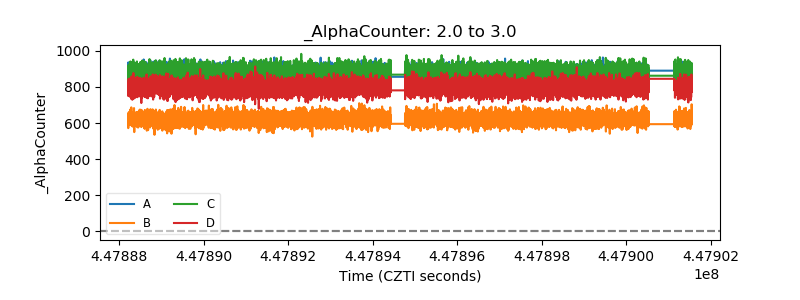 |
| _CPM_Rate | 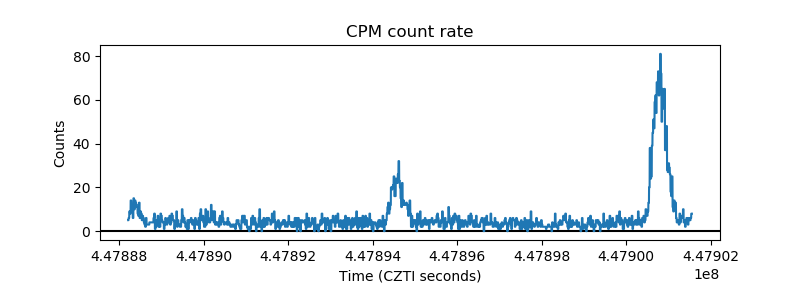 |
| CZT Counter | 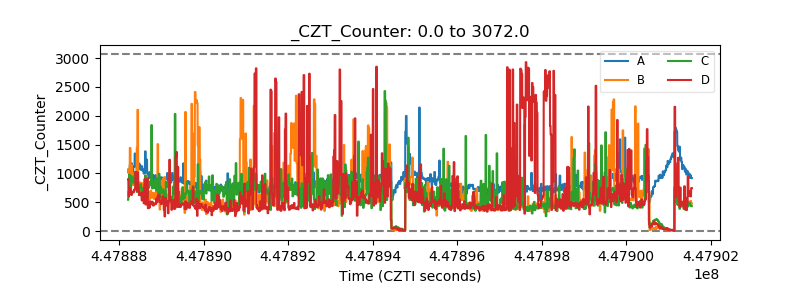 |
| +2.5 Volts monitor | 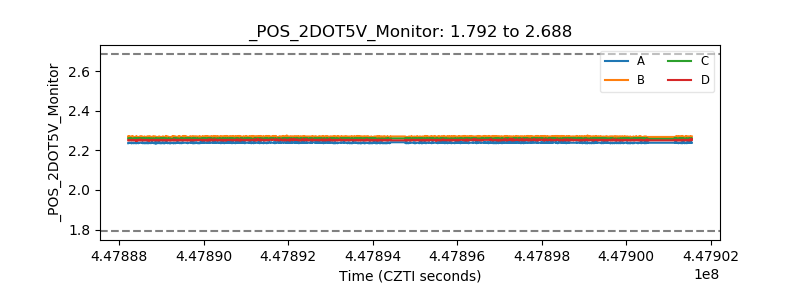 |
| +5 Volts monitor | 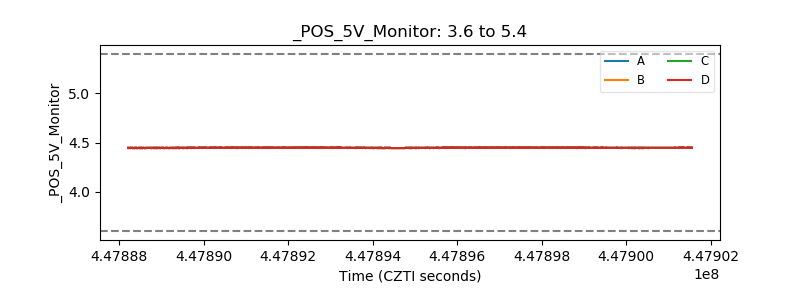 |
| _ROLL_ROT | 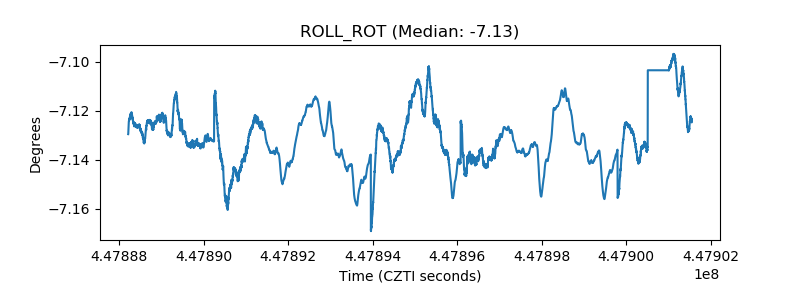 |
| _Roll_DEC | 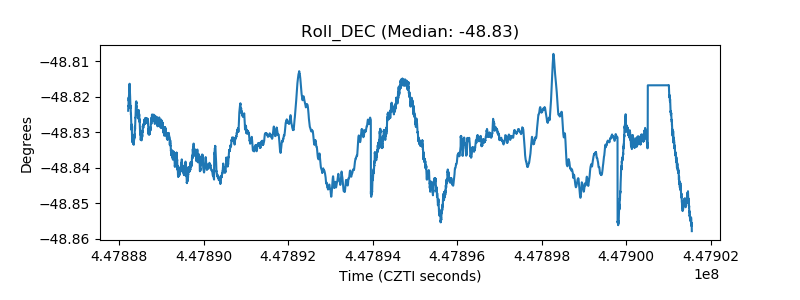 |
| _Roll_RA | 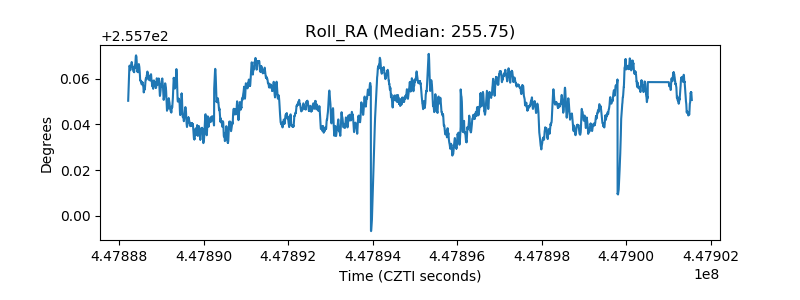 |
| Veto Counter | 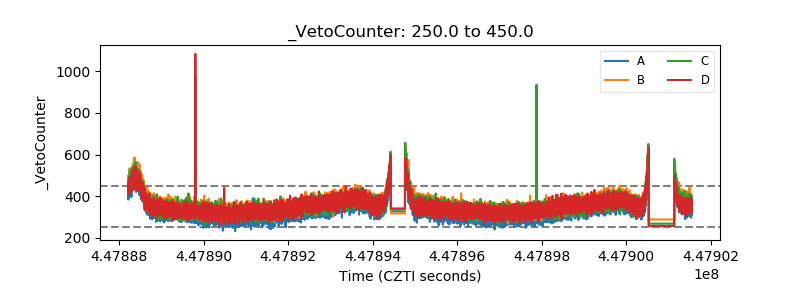 |