| Param | Original file | Final file |
|---|---|---|
| Filename | modeM0/AS1A13_028T01_9000006122_45719cztM0_level2.fits | modeM0/AS1A13_028T01_9000006122_45719cztM0_level2_quad_clean.evt |
| Size (bytes) | 1,269,207,360 | 290,079,360 |
| Size | 1.2 GB | 276.6 MB |
| Events in quadrant A | 15,802,054 | 1,929,864 |
| Events in quadrant B | 9,778,394 | 1,978,409 |
| Events in quadrant C | 8,155,280 | 1,923,243 |
| Events in quadrant D | 11,853,573 | 1,709,283 |
| Mode SS | |||
|---|---|---|---|
| Quadrant | BADHDUFLAG | Total packets | Discarded packets |
| A | 0 | 366 | 0 |
| B | 0 | 366 | 0 |
| C | 0 | 366 | 0 |
| D | 0 | 366 | 0 |
| Mode M9 | |||
|---|---|---|---|
| Quadrant | BADHDUFLAG | Total packets | Discarded packets |
| A | 0 | 27 | 0 |
| B | 0 | 27 | 0 |
| C | 0 | 27 | 0 |
| D | 0 | 27 | 0 |
| Mode M0 | |||
|---|---|---|---|
| Quadrant | BADHDUFLAG | Total packets | Discarded packets |
| A | 0 | 59451 | 3 |
| B | 0 | 41248 | 3 |
| C | 0 | 37150 | 3 |
| D | 0 | 47854 | 3 |
| Quadrant | Total seconds | Saturated seconds | Saturation percentage |
|---|---|---|---|
| A | 18022 | 409 | 2.269448% |
| B | 18022 | 389 | 2.158473% |
| C | 18023 | 132 | 0.732397% |
| D | 18023 | 630 | 3.495533% |
Noise dominated data is calculated using 1-second bins in cleaned event files. If a bin has >2000 counts, and if more than 50% of those come from <1% of pixels, then it is considered to be noise-dominated and hence unusable.
| Quadrant | # 1 sec bins | Bins with >0 counts | Bins with >2000 counts | High rate bins dominated by noise | Noise dominated (total time) | Noise dominated (detector-on time) | Marked lightcurve |
|---|---|---|---|---|---|---|---|
| A | 20772 | 18022 | 56 | 56 | 0.27% | 0.31% | 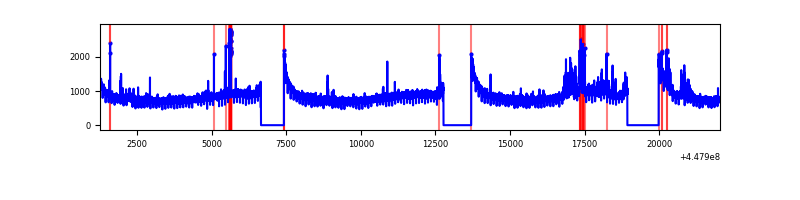 |
| B | 20772 | 18022 | 214 | 214 | 1.03% | 1.19% | 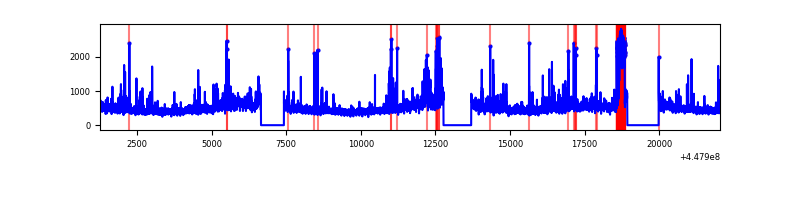 |
| C | 20773 | 18023 | 15 | 15 | 0.07% | 0.08% | 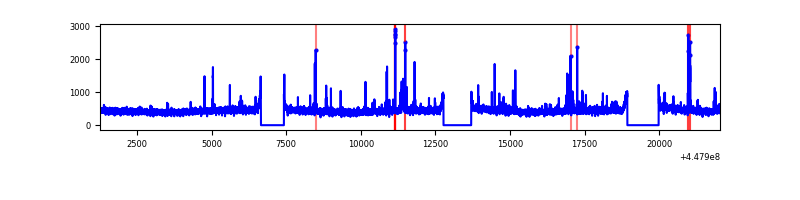 |
| D | 20773 | 18023 | 488 | 488 | 2.35% | 2.71% | 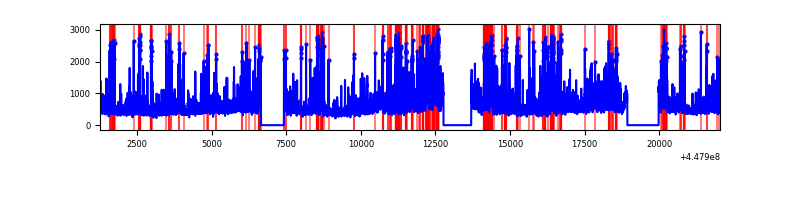 |
Top three noisy pixels from each quadrant. If the there are fewer than three noisy pixels in the level2.evt file, extra rows are filled as -1
| Pixel properties | Quadrant properties | ||||||
|---|---|---|---|---|---|---|---|
| Quadrant | DetID | PixID | Counts | Sigma | Mean | Median | Sigma |
| A | 10 | 83 | 7436543 | 17971.0 | 2013 | 1968 | 413.7 |
| A | 7 | 3 | 375733 | 903.47 | 2013 | 1968 | 413.7 |
| A | 2 | 79 | 117242 | 278.64 | 2013 | 1968 | 413.7 |
| B | 15 | 201 | 967489 | 2490.64 | 2003 | 1943 | 387.7 |
| B | 3 | 112 | 643854 | 1655.82 | 2003 | 1943 | 387.7 |
| B | 0 | 189 | 71899 | 180.45 | 2003 | 1943 | 387.7 |
| C | 0 | 207 | 70875 | 146.21 | 2010 | 2026 | 470.9 |
| C | 12 | 2 | 63528 | 130.61 | 2010 | 2026 | 470.9 |
| C | 12 | 16 | 56765 | 116.25 | 2010 | 2026 | 470.9 |
| D | 1 | 52 | 2167924 | 4420.08 | 1973 | 1915 | 490.0 |
| D | 13 | 249 | 1223534 | 2492.9 | 1973 | 1915 | 490.0 |
| D | 1 | 47 | 365743 | 742.45 | 1973 | 1915 | 490.0 |
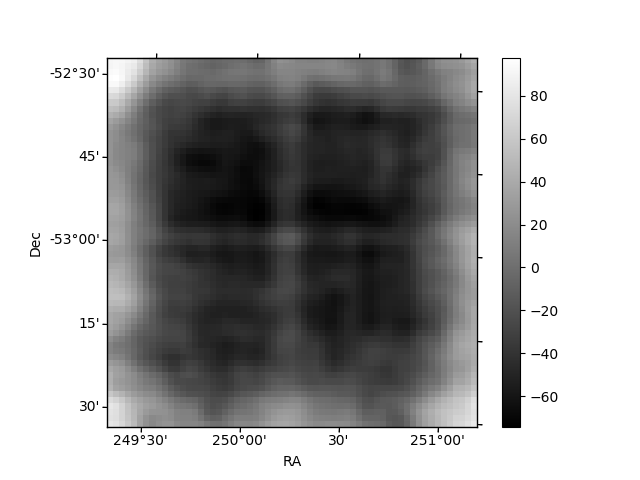
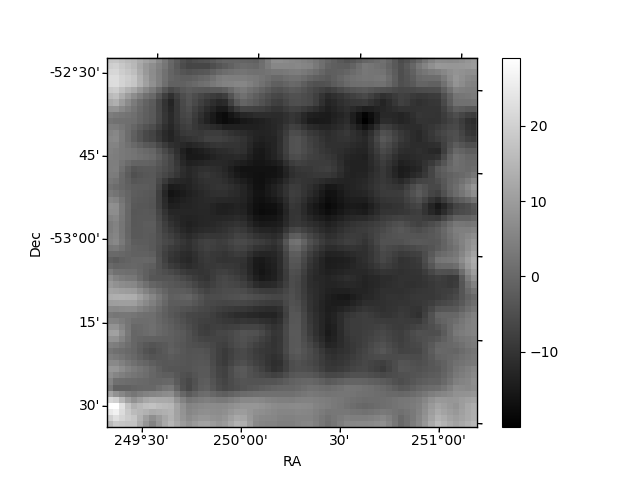
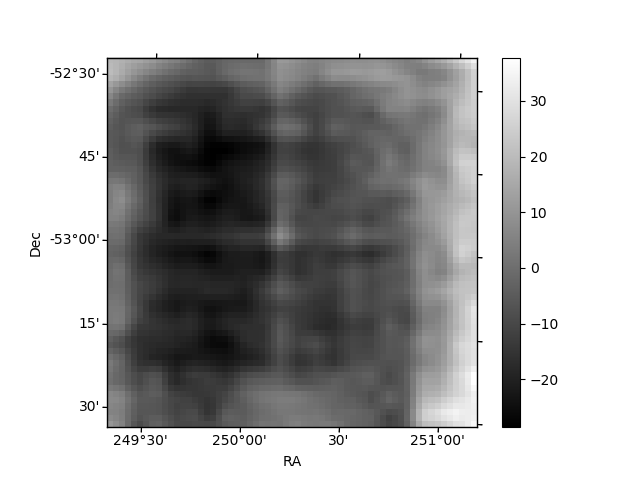
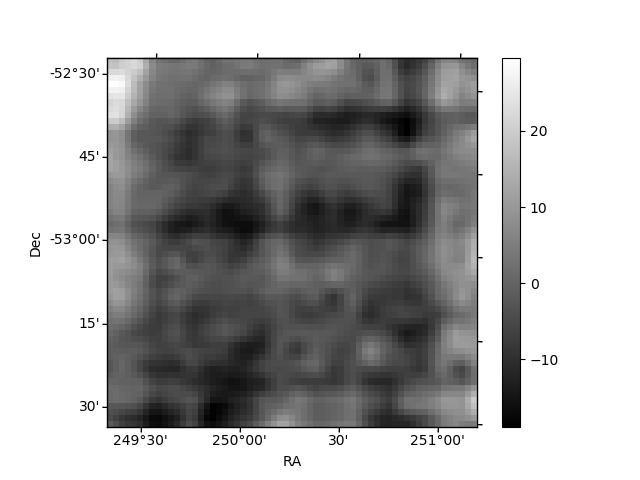
Histogram calculated using DETX and DETY for each event in the final _common_clean file
| Quadrant A | 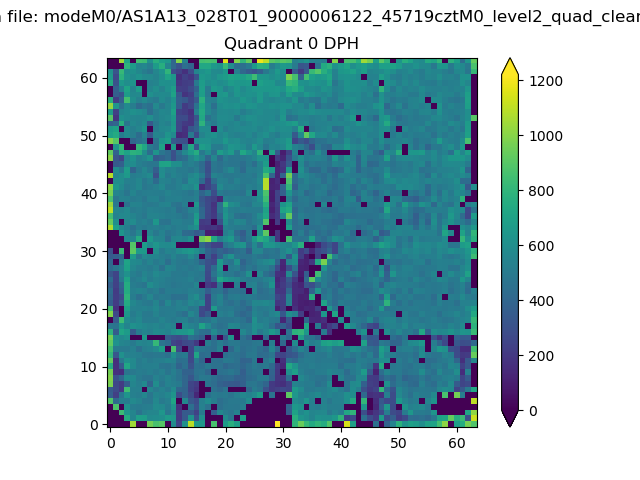 |
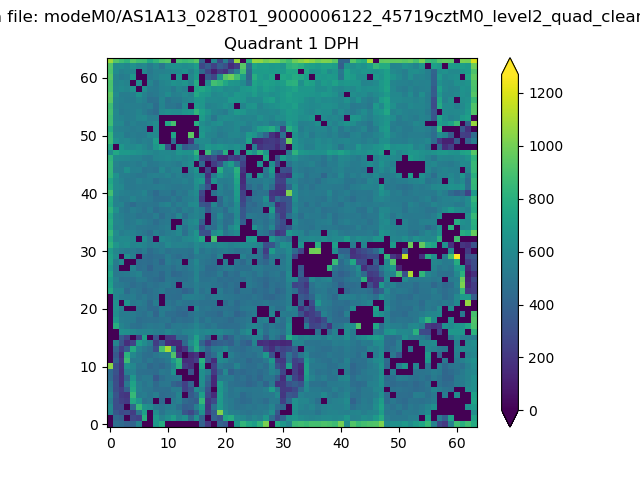 |
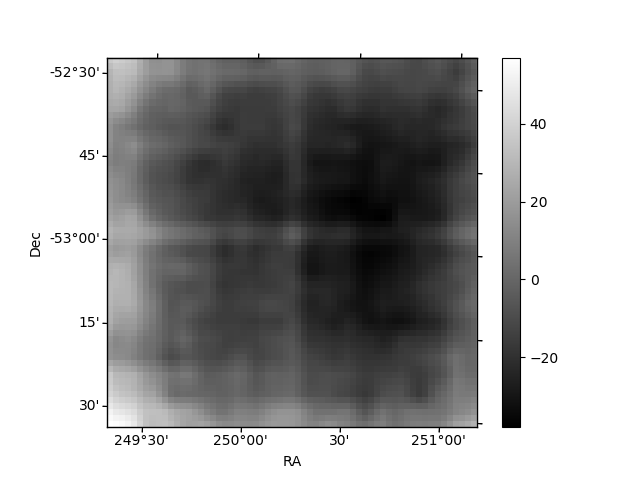
Quadrant B |
|---|---|---|---|
| Quadrant D | 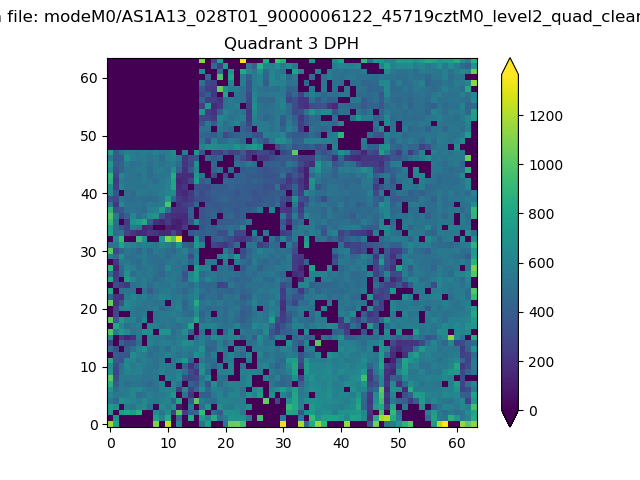 |
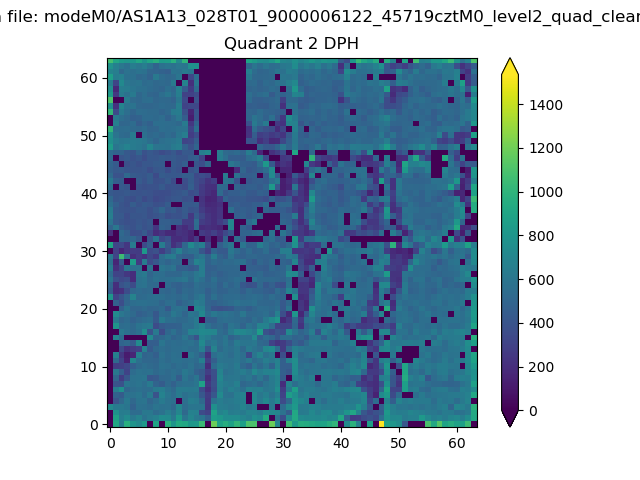 |
Quadrant C |
| Plot type | Count rate plots | Images |
|---|---|---|
| Comparison with Poisson distribution Blue bars denote a histogram of data divided into 1 sec bins. Red curve is a Poisson curve with rate = median count rate of data. |
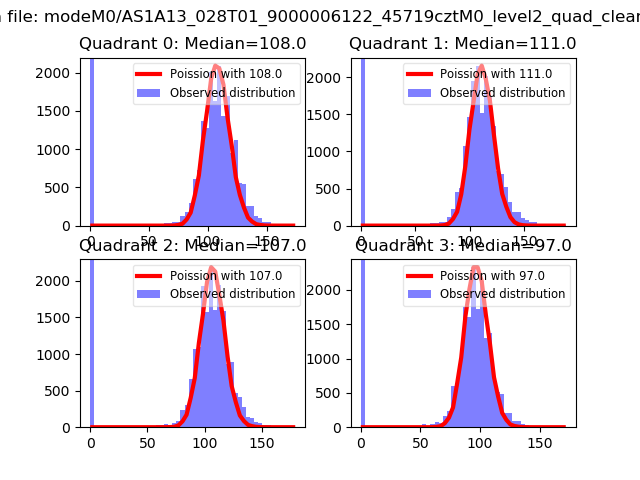 |
 |
| Quadrant-wise count rates Data is divided into 100 sec bins |
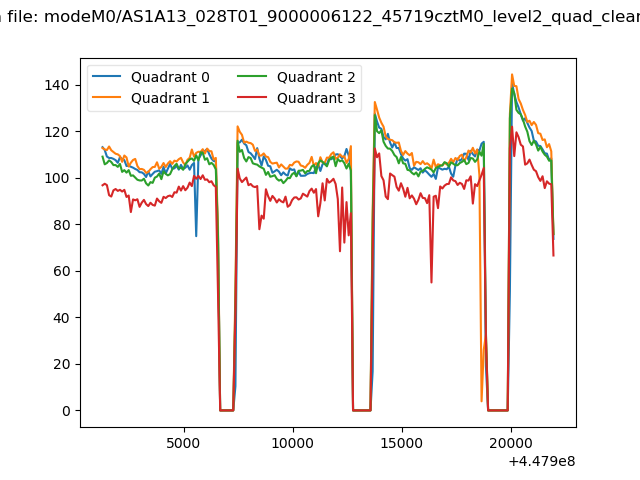 |
|
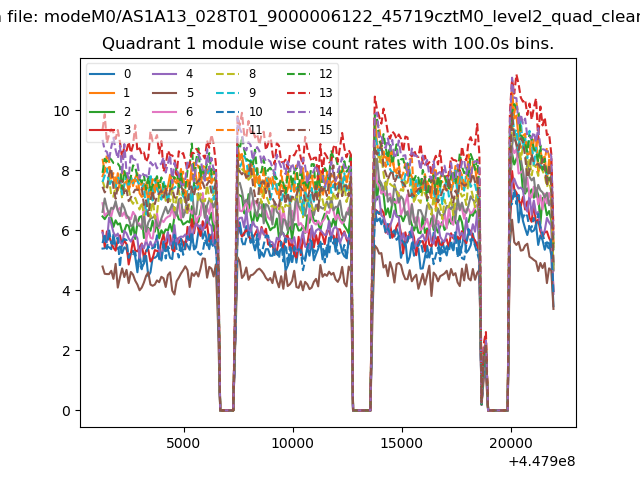
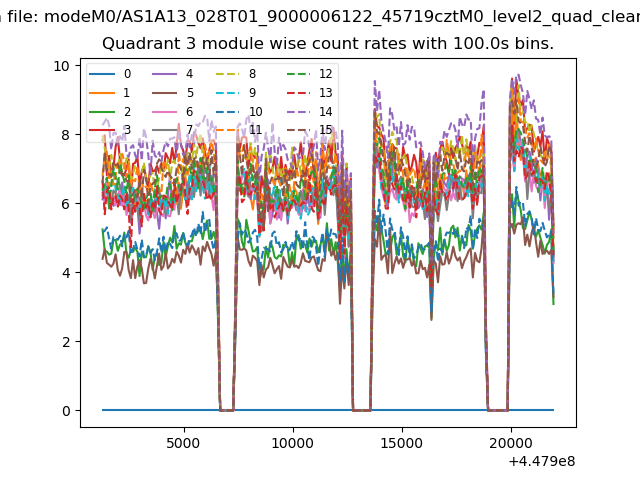
| Module-wise count rates for Quadrant A Data is divided into 100 sec bins |
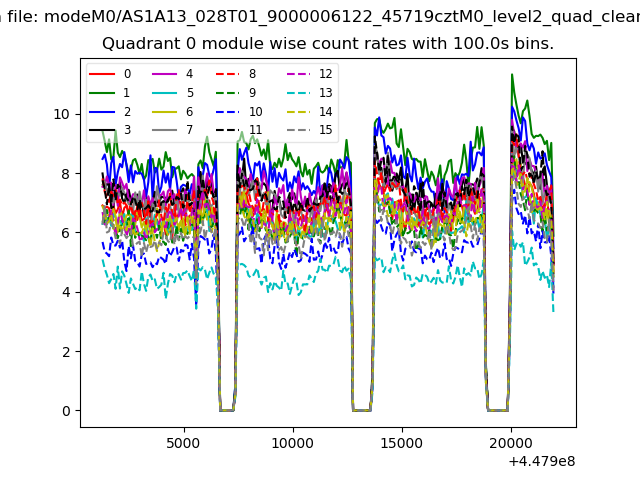 |
 |
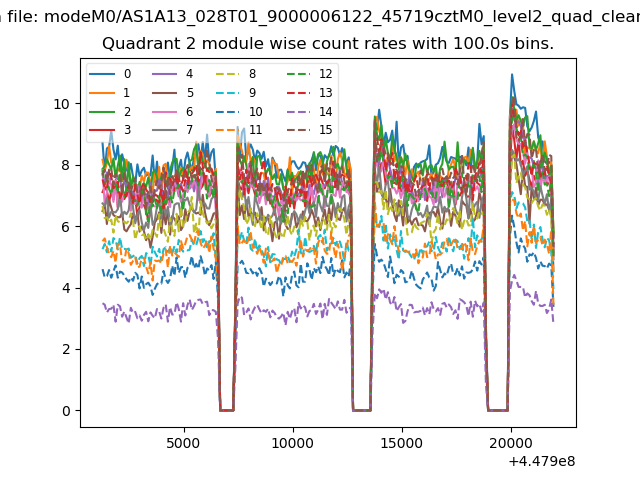
| Module-wise count rates for Quadrant B Data is divided into 100 sec bins |
 |
 |
| Module-wise count rates for Quadrant C Data is divided into 100 sec bins |
 |
 |
| Module-wise count rates for Quadrant D Data is divided into 100 sec bins |
 |
 |
| Parameter | Plot |
|---|---|
| CZT HV Monitor | 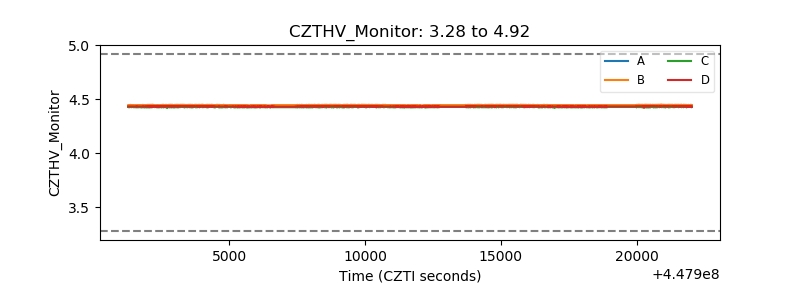 |
| D_VDD | 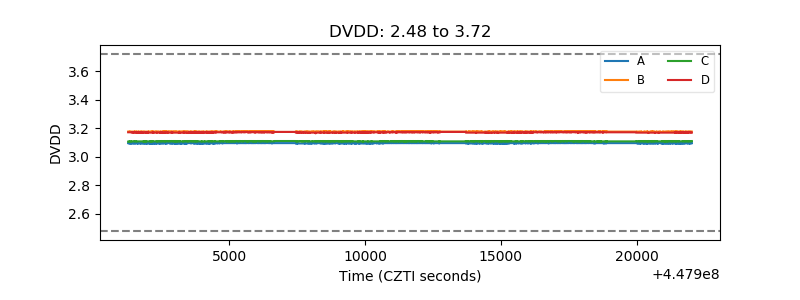 |
| Temperature 1 | 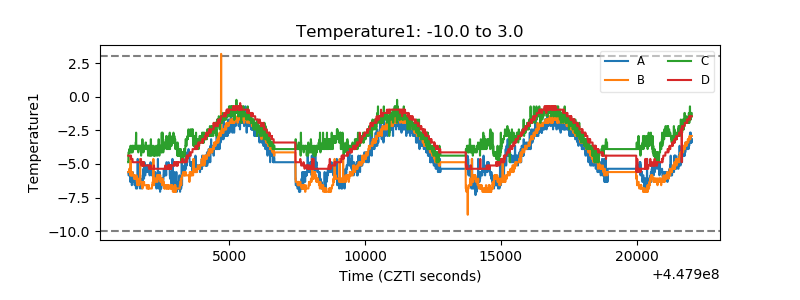 |
| Veto HV Monitor | 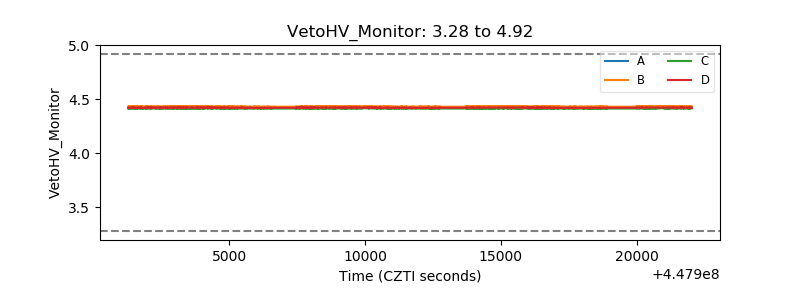 |
| Veto LLD | 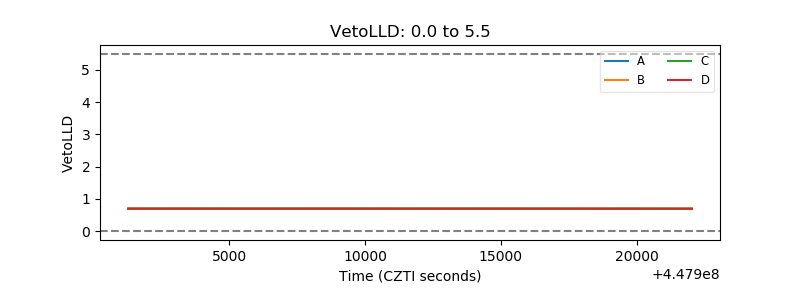 |
| Alpha Counter | 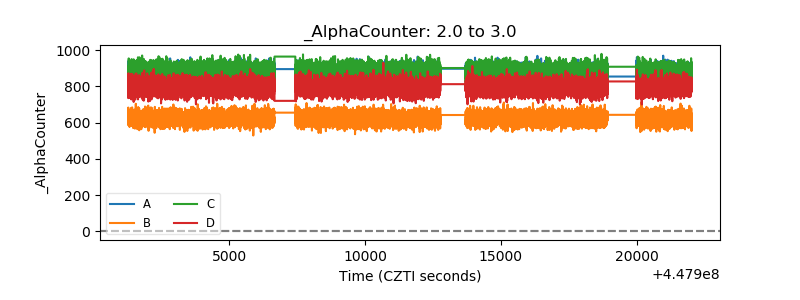 |
| _CPM_Rate | 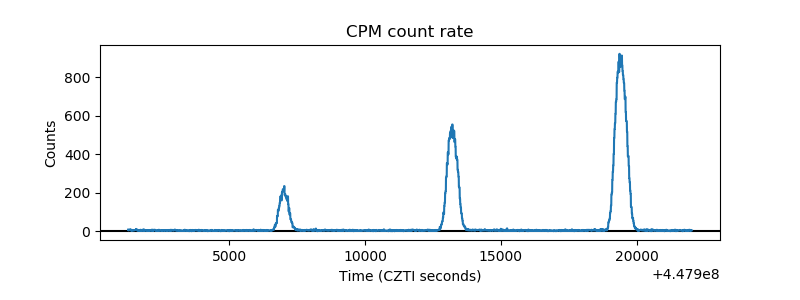 |
| CZT Counter | 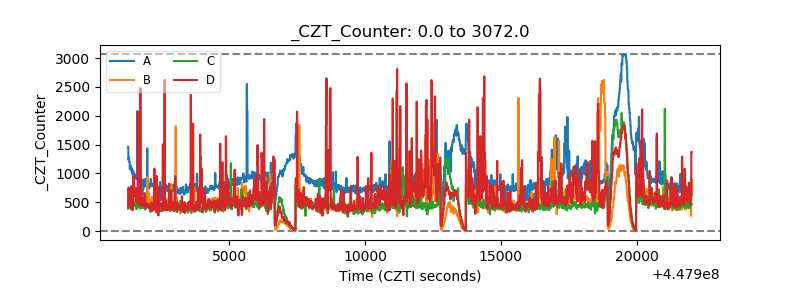 |
| +2.5 Volts monitor | 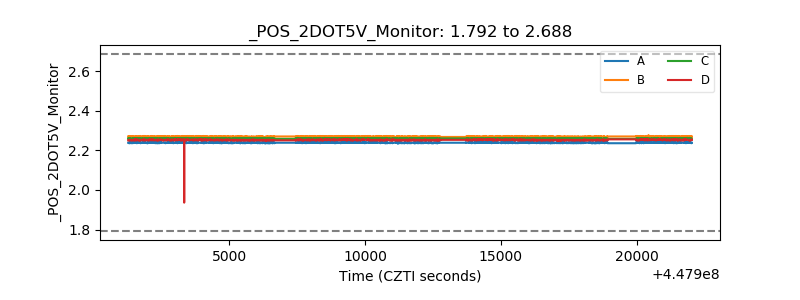 |
| +5 Volts monitor | 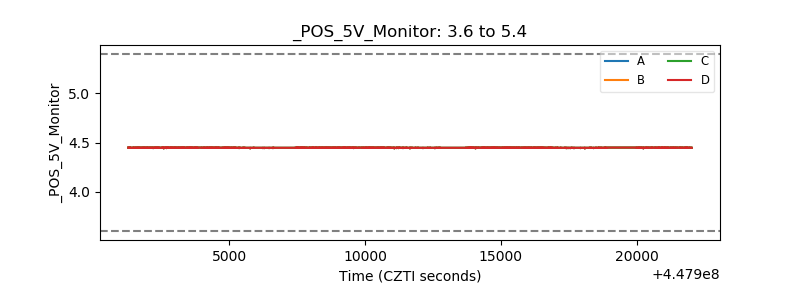 |
| _ROLL_ROT | 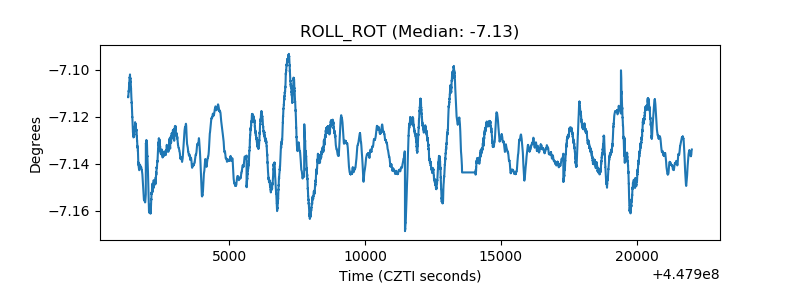 |
| _Roll_DEC | 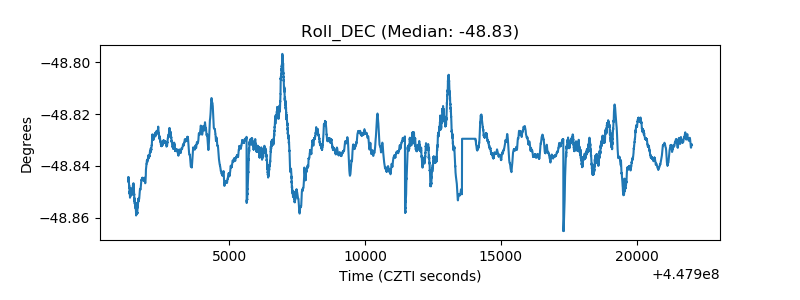 |
| _Roll_RA | 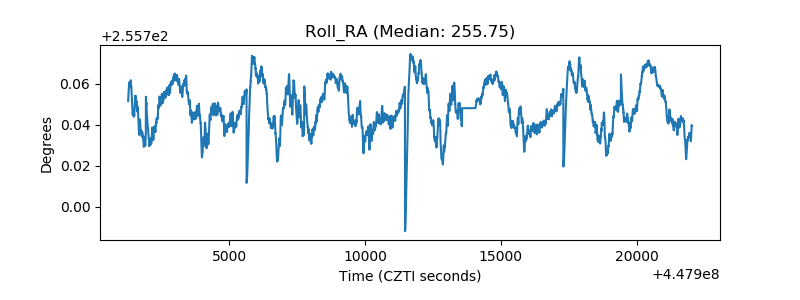 |
| Veto Counter | 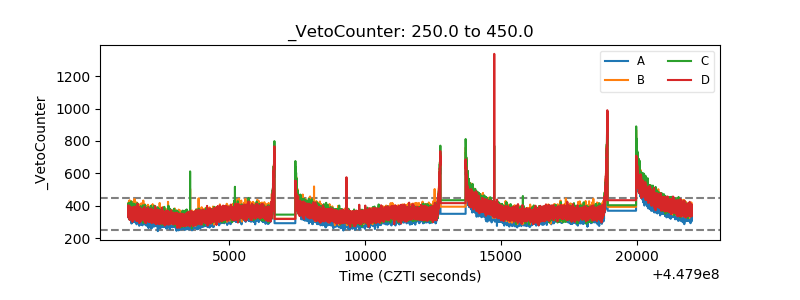 |