| Param | Original file | Final file |
|---|---|---|
| Filename | modeM0/AS1A13_028T01_9000006122_45721cztM0_level2.fits | modeM0/AS1A13_028T01_9000006122_45721cztM0_level2_quad_clean.evt |
| Size (bytes) | 522,504,000 | 120,067,200 |
| Size | 498.3 MB | 114.5 MB |
| Events in quadrant A | 6,263,147 | 809,730 |
| Events in quadrant B | 4,913,463 | 803,289 |
| Events in quadrant C | 3,235,643 | 817,817 |
| Events in quadrant D | 4,405,507 | 734,609 |
| Mode SS | |||
|---|---|---|---|
| Quadrant | BADHDUFLAG | Total packets | Discarded packets |
| A | 0 | 136 | 0 |
| B | 0 | 136 | 0 |
| C | 0 | 136 | 0 |
| D | 0 | 136 | 0 |
| Mode M9 | |||
|---|---|---|---|
| Quadrant | BADHDUFLAG | Total packets | Discarded packets |
| A | 0 | 16 | 0 |
| B | 0 | 17 | 0 |
| C | 0 | 17 | 0 |
| D | 0 | 17 | 0 |
| Mode M0 | |||
|---|---|---|---|
| Quadrant | BADHDUFLAG | Total packets | Discarded packets |
| A | 0 | 22511 | 2 |
| B | 0 | 18803 | 4 |
| C | 0 | 14048 | 2 |
| D | 0 | 17418 | 2 |
| Quadrant | Total seconds | Saturated seconds | Saturation percentage |
|---|---|---|---|
| A | 6752 | 270 | 3.998815% |
| B | 6751 | 577 | 8.546882% |
| C | 6751 | 71 | 1.051696% |
| D | 6751 | 230 | 3.406903% |
Noise dominated data is calculated using 1-second bins in cleaned event files. If a bin has >2000 counts, and if more than 50% of those come from <1% of pixels, then it is considered to be noise-dominated and hence unusable.
| Quadrant | # 1 sec bins | Bins with >0 counts | Bins with >2000 counts | High rate bins dominated by noise | Noise dominated (total time) | Noise dominated (detector-on time) | Marked lightcurve |
|---|---|---|---|---|---|---|---|
| A | 7927 | 6752 | 14 | 14 | 0.18% | 0.21% | 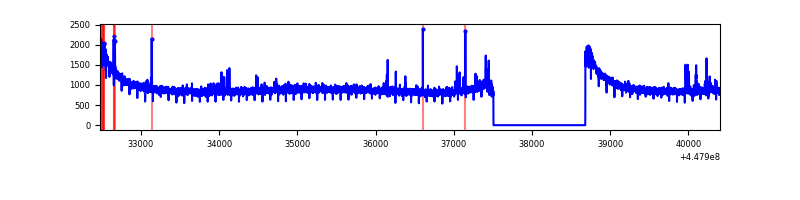 |
| B | 7926 | 6751 | 349 | 349 | 4.40% | 5.17% | 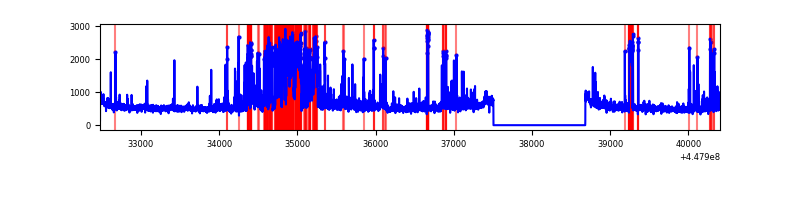 |
| C | 7925 | 6750 | 5 | 5 | 0.06% | 0.07% | 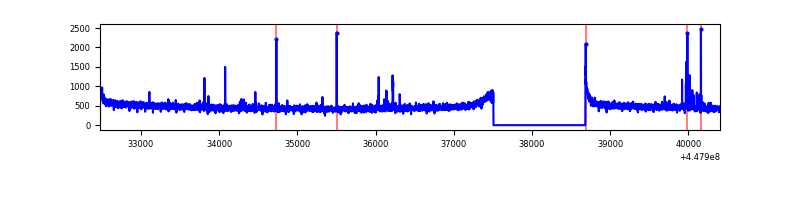 |
| D | 7926 | 6751 | 111 | 111 | 1.40% | 1.64% | 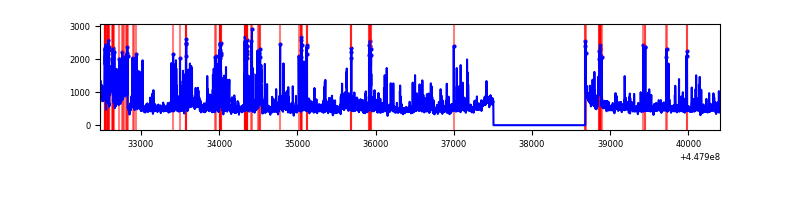 |
Top three noisy pixels from each quadrant. If the there are fewer than three noisy pixels in the level2.evt file, extra rows are filled as -1
| Pixel properties | Quadrant properties | ||||||
|---|---|---|---|---|---|---|---|
| Quadrant | DetID | PixID | Counts | Sigma | Mean | Median | Sigma |
| A | 10 | 83 | 2981831 | 17776.82 | 824 | 808 | 167.7 |
| A | 2 | 79 | 39084 | 228.25 | 824 | 808 | 167.7 |
| A | 7 | 3 | 21062 | 120.78 | 824 | 808 | 167.7 |
| B | 4 | 171 | 457623 | 2987.1 | 798 | 776 | 152.9 |
| B | 5 | 172 | 358056 | 2336.08 | 798 | 776 | 152.9 |
| B | 3 | 112 | 332824 | 2171.1 | 798 | 776 | 152.9 |
| C | 0 | 207 | 32230 | 165.0 | 813 | 818 | 190.4 |
| C | 12 | 2 | 16522 | 82.49 | 813 | 818 | 190.4 |
| C | 2 | 14 | 8621 | 40.99 | 813 | 818 | 190.4 |
| D | 13 | 249 | 521411 | 2585.99 | 812 | 788 | 201.3 |
| D | 1 | 52 | 351391 | 1741.48 | 812 | 788 | 201.3 |
| D | 2 | 249 | 233760 | 1157.19 | 812 | 788 | 201.3 |
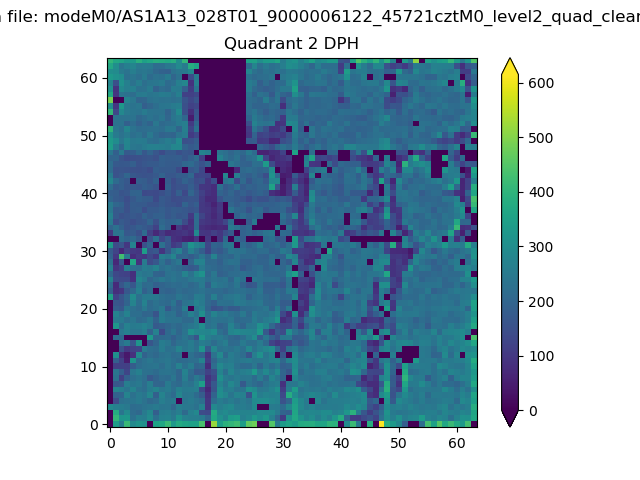
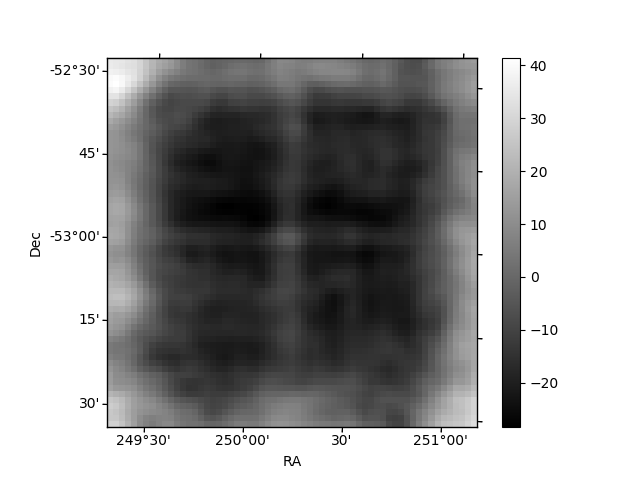
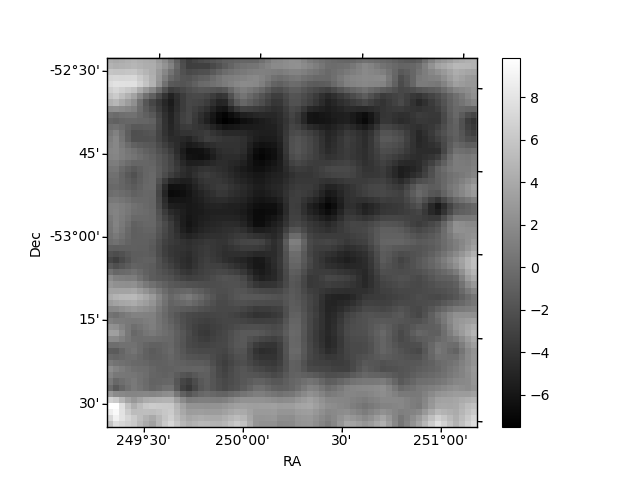
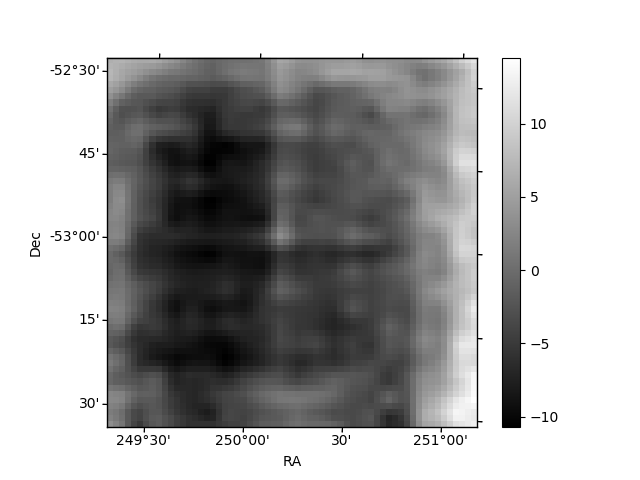
Histogram calculated using DETX and DETY for each event in the final _common_clean file
| Quadrant A | 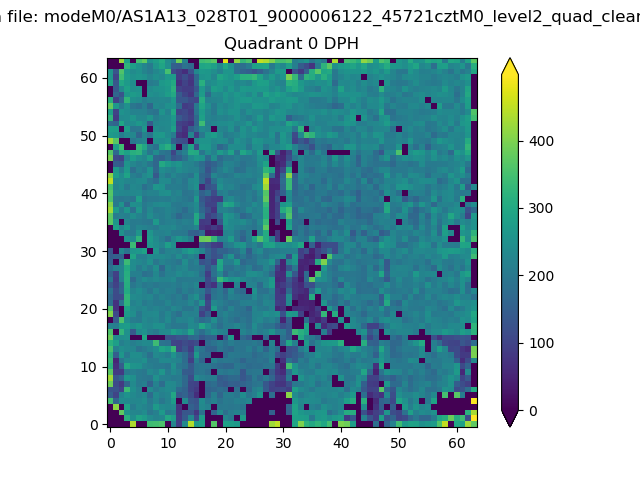 |
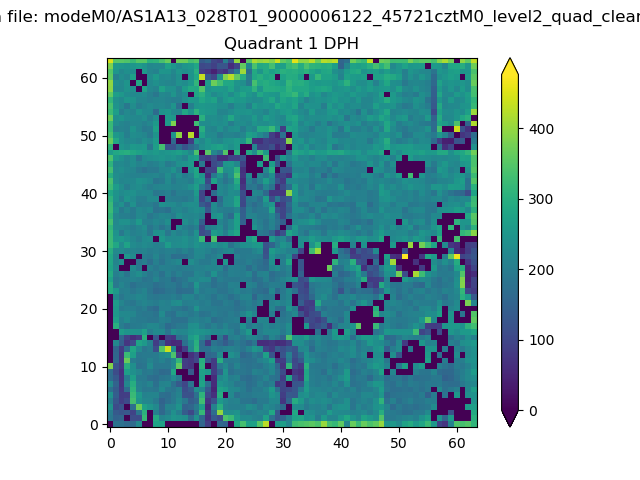 |
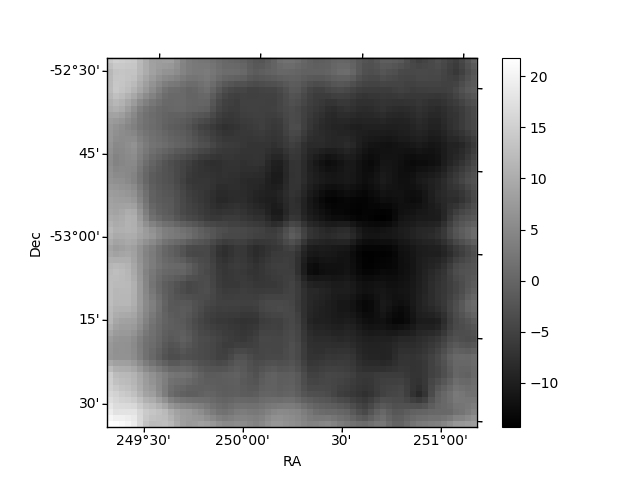
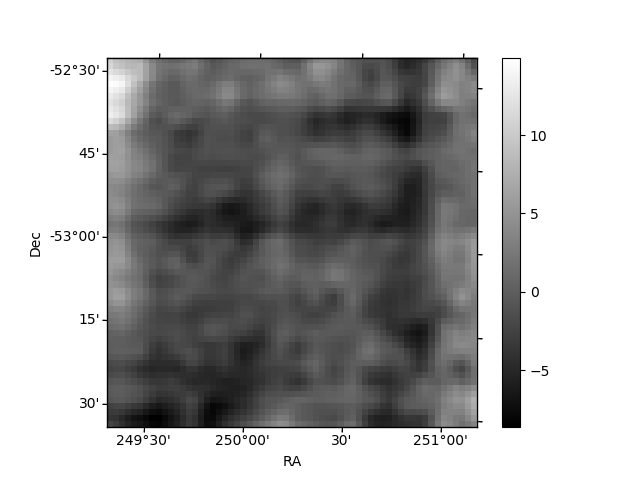
Quadrant B |
|---|---|---|---|
| Quadrant D | 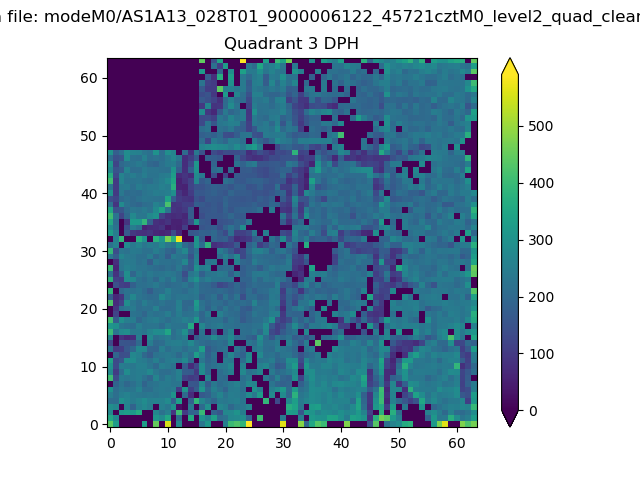 |
 |
Quadrant C |
| Plot type | Count rate plots | Images |
|---|---|---|
| Comparison with Poisson distribution Blue bars denote a histogram of data divided into 1 sec bins. Red curve is a Poisson curve with rate = median count rate of data. |
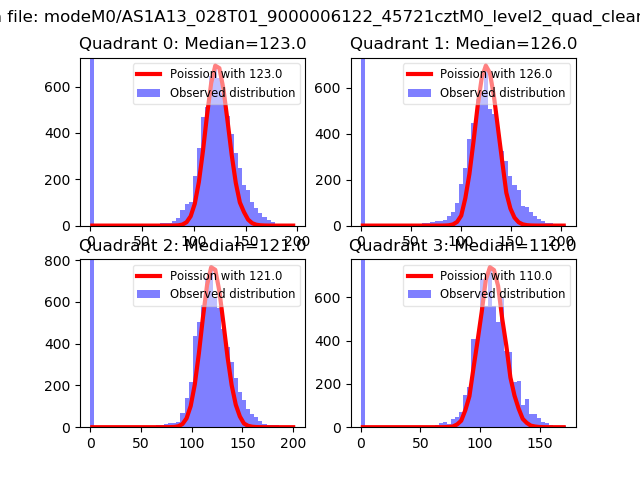 |
 |
| Quadrant-wise count rates Data is divided into 100 sec bins |
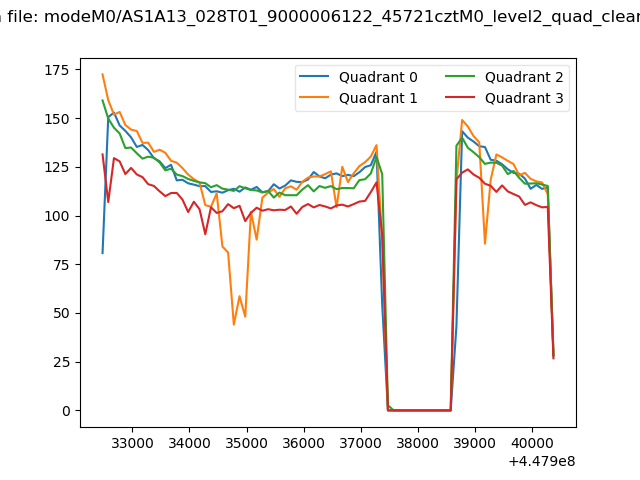 |
|
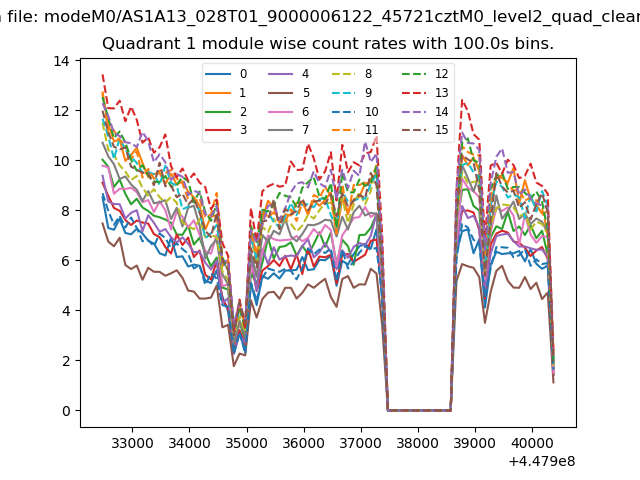
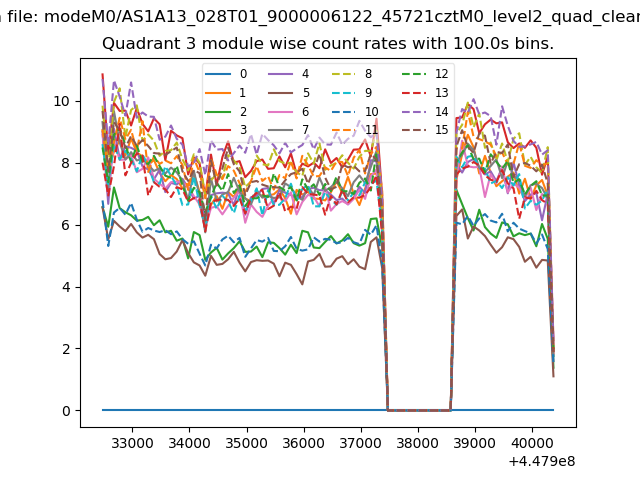
| Module-wise count rates for Quadrant A Data is divided into 100 sec bins |
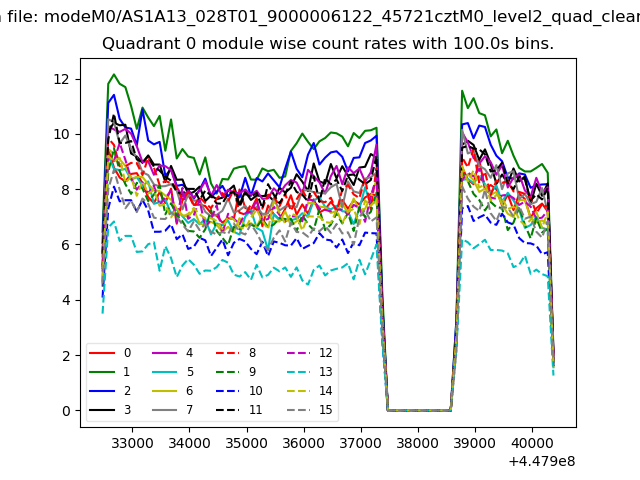 |
 |
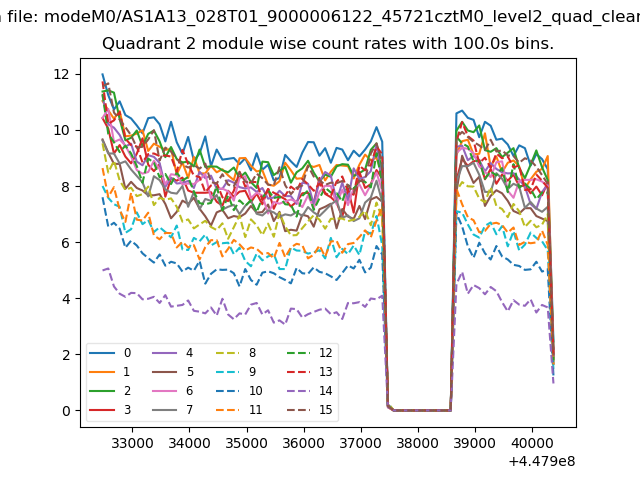
| Module-wise count rates for Quadrant B Data is divided into 100 sec bins |
 |
 |
| Module-wise count rates for Quadrant C Data is divided into 100 sec bins |
 |
 |
| Module-wise count rates for Quadrant D Data is divided into 100 sec bins |
 |
 |
| Parameter | Plot |
|---|---|
| CZT HV Monitor | 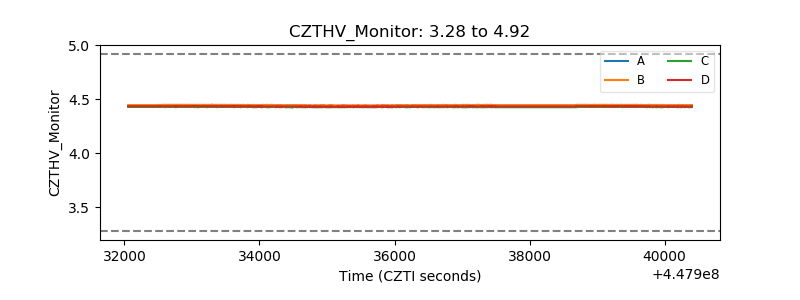 |
| D_VDD | 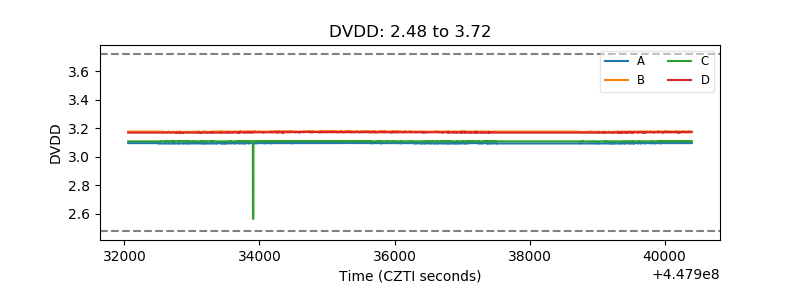 |
| Temperature 1 | 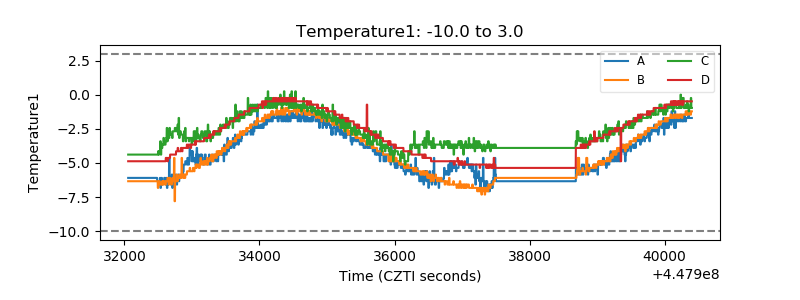 |
| Veto HV Monitor | 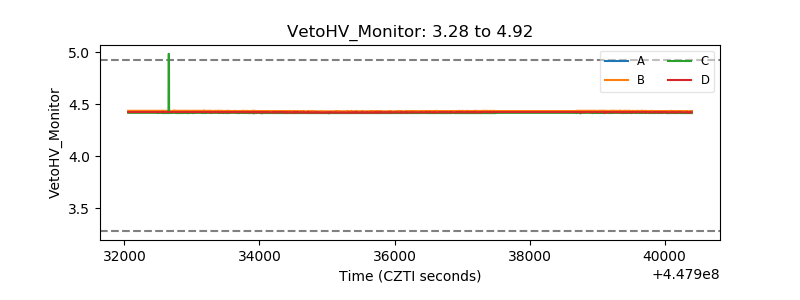 |
| Veto LLD | 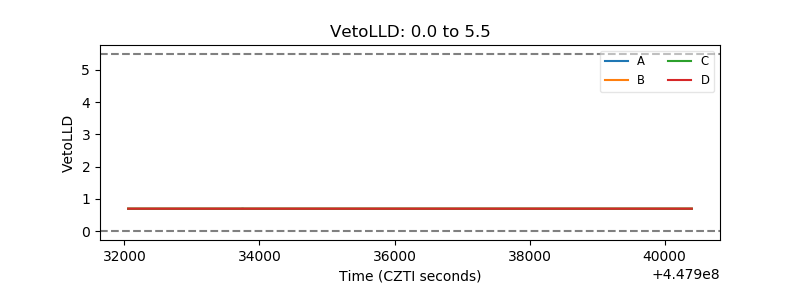 |
| Alpha Counter | 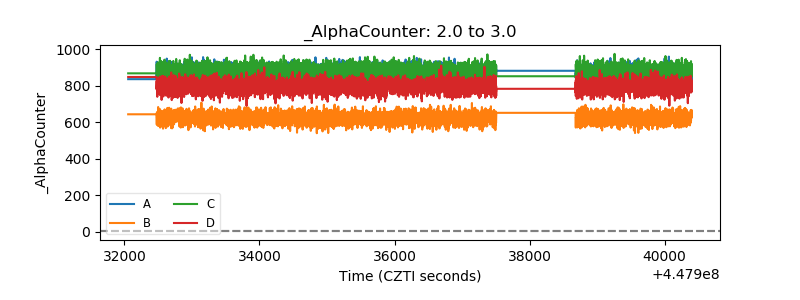 |
| _CPM_Rate | 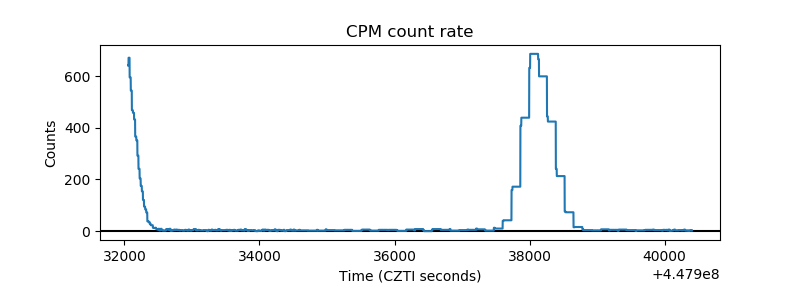 |
| CZT Counter | 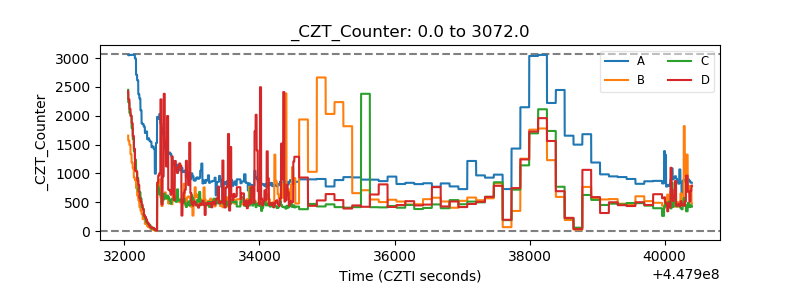 |
| +2.5 Volts monitor | 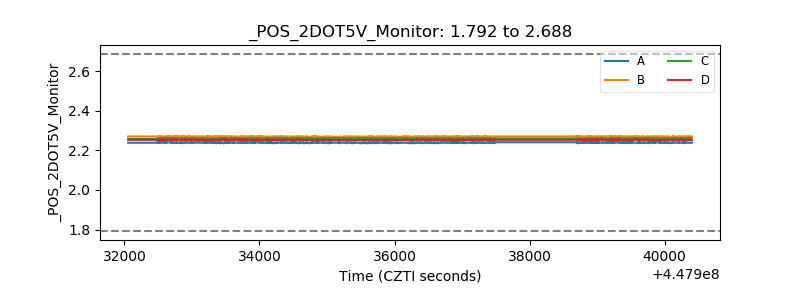 |
| +5 Volts monitor | 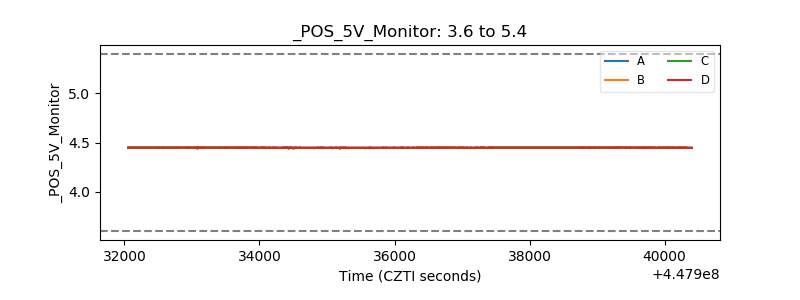 |
| _ROLL_ROT | 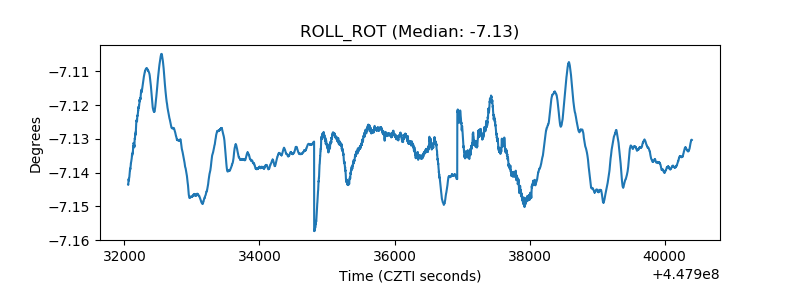 |
| _Roll_DEC | 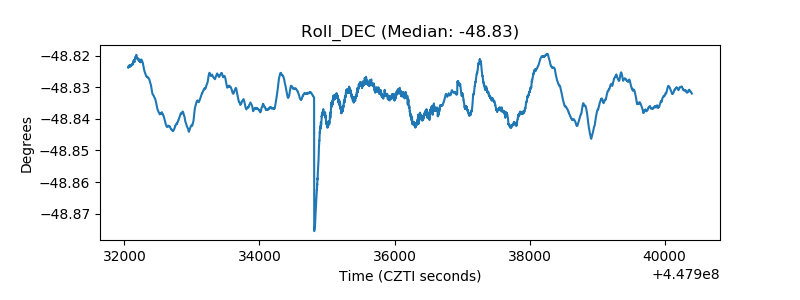 |
| _Roll_RA | 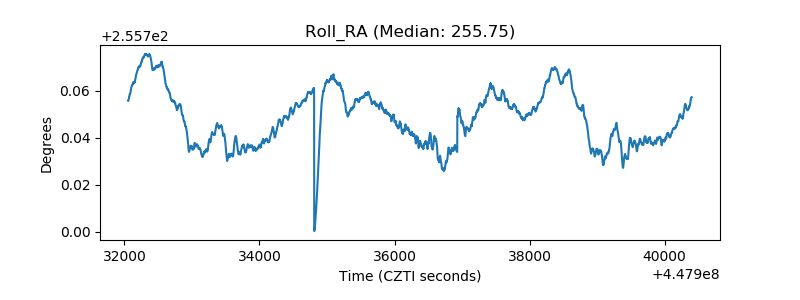 |
| Veto Counter | 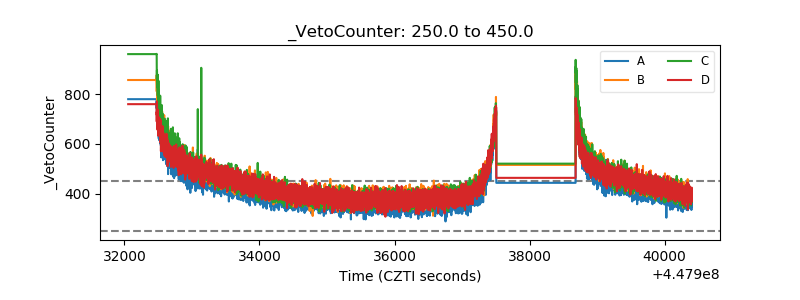 |