| Param | Original file | Final file |
|---|---|---|
| Filename | modeM0/AS1A13_028T01_9000006122_45722cztM0_level2.fits | modeM0/AS1A13_028T01_9000006122_45722cztM0_level2_quad_clean.evt |
| Size (bytes) | 515,142,720 | 117,809,280 |
| Size | 491.3 MB | 112.4 MB |
| Events in quadrant A | 6,289,735 | 781,589 |
| Events in quadrant B | 4,092,341 | 802,570 |
| Events in quadrant C | 3,254,374 | 794,595 |
| Events in quadrant D | 4,900,072 | 710,904 |
| Mode SS | |||
|---|---|---|---|
| Quadrant | BADHDUFLAG | Total packets | Discarded packets |
| A | 0 | 138 | 0 |
| B | 0 | 138 | 0 |
| C | 0 | 138 | 0 |
| D | 0 | 138 | 0 |
| Mode M9 | |||
|---|---|---|---|
| Quadrant | BADHDUFLAG | Total packets | Discarded packets |
| A | 0 | 12 | 0 |
| B | 0 | 13 | 0 |
| C | 0 | 13 | 0 |
| D | 0 | 13 | 0 |
| Mode M0 | |||
|---|---|---|---|
| Quadrant | BADHDUFLAG | Total packets | Discarded packets |
| A | 0 | 22771 | 2 |
| B | 0 | 16434 | 2 |
| C | 0 | 14352 | 2 |
| D | 0 | 19101 | 2 |
| Quadrant | Total seconds | Saturated seconds | Saturation percentage |
|---|---|---|---|
| A | 6860 | 353 | 5.145773% |
| B | 6860 | 346 | 5.043732% |
| C | 6860 | 135 | 1.967930% |
| D | 6860 | 352 | 5.131195% |
Noise dominated data is calculated using 1-second bins in cleaned event files. If a bin has >2000 counts, and if more than 50% of those come from <1% of pixels, then it is considered to be noise-dominated and hence unusable.
| Quadrant | # 1 sec bins | Bins with >0 counts | Bins with >2000 counts | High rate bins dominated by noise | Noise dominated (total time) | Noise dominated (detector-on time) | Marked lightcurve |
|---|---|---|---|---|---|---|---|
| A | 7894 | 6859 | 3 | 3 | 0.04% | 0.04% | 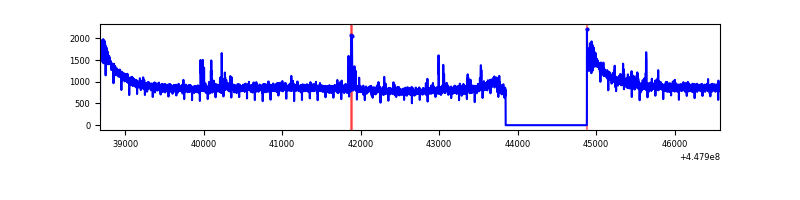 |
| B | 7894 | 6859 | 98 | 98 | 1.24% | 1.43% | 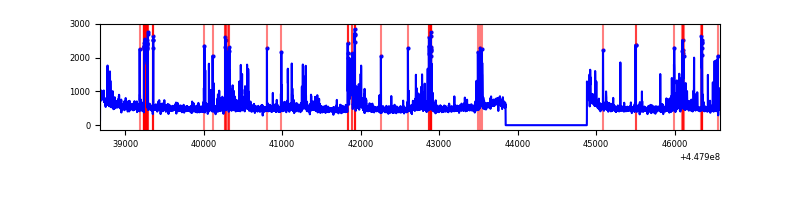 |
| C | 7894 | 6859 | 8 | 8 | 0.10% | 0.12% | 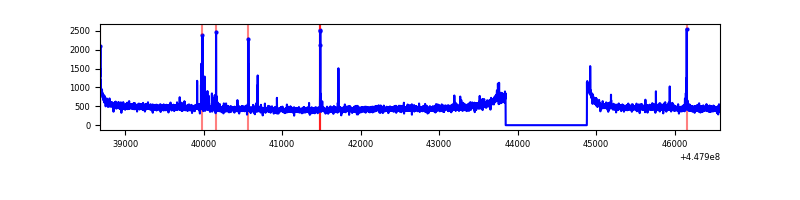 |
| D | 7894 | 6859 | 164 | 164 | 2.08% | 2.39% | 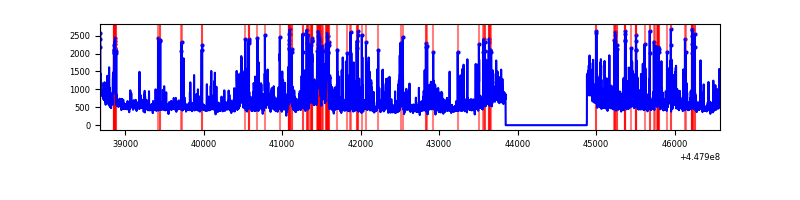 |
Top three noisy pixels from each quadrant. If the there are fewer than three noisy pixels in the level2.evt file, extra rows are filled as -1
| Pixel properties | Quadrant properties | ||||||
|---|---|---|---|---|---|---|---|
| Quadrant | DetID | PixID | Counts | Sigma | Mean | Median | Sigma |
| A | 10 | 83 | 2994394 | 17638.82 | 821 | 803 | 169.7 |
| A | 2 | 79 | 44510 | 257.53 | 821 | 803 | 169.7 |
| A | 7 | 3 | 39574 | 228.45 | 821 | 803 | 169.7 |
| B | 3 | 112 | 390881 | 2444.42 | 814 | 788 | 159.6 |
| B | 15 | 201 | 137695 | 857.89 | 814 | 788 | 159.6 |
| B | 5 | 172 | 135202 | 842.27 | 814 | 788 | 159.6 |
| C | 0 | 207 | 39997 | 207.49 | 813 | 816 | 188.8 |
| C | 12 | 2 | 20053 | 101.87 | 813 | 816 | 188.8 |
| C | 2 | 14 | 13488 | 67.1 | 813 | 816 | 188.8 |
| D | 1 | 52 | 1160192 | 5728.44 | 809 | 783 | 202.4 |
| D | 13 | 249 | 315623 | 1555.57 | 809 | 783 | 202.4 |
| D | 2 | 249 | 91132 | 446.4 | 809 | 783 | 202.4 |
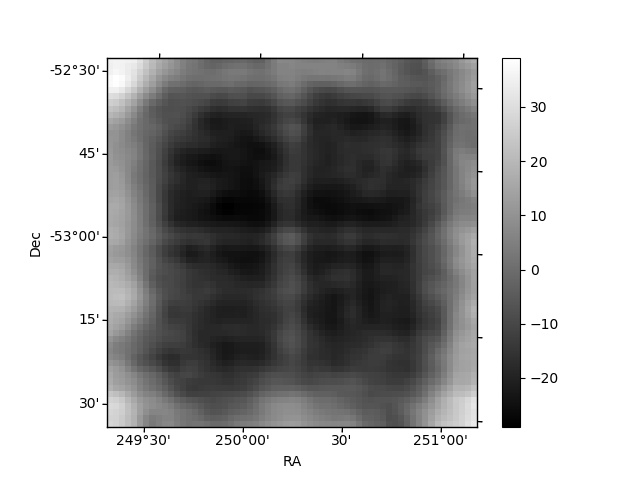
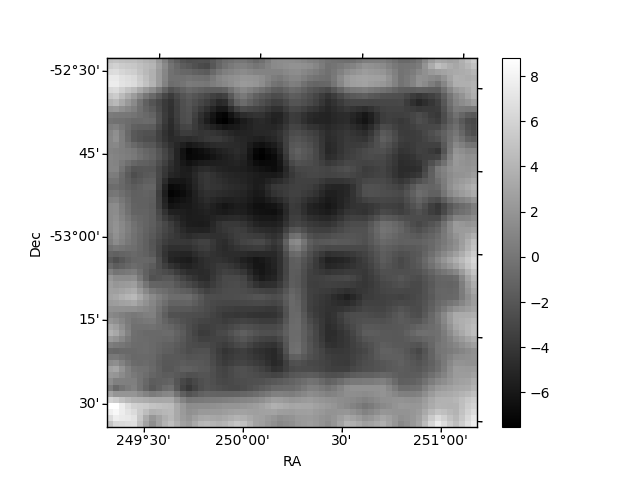
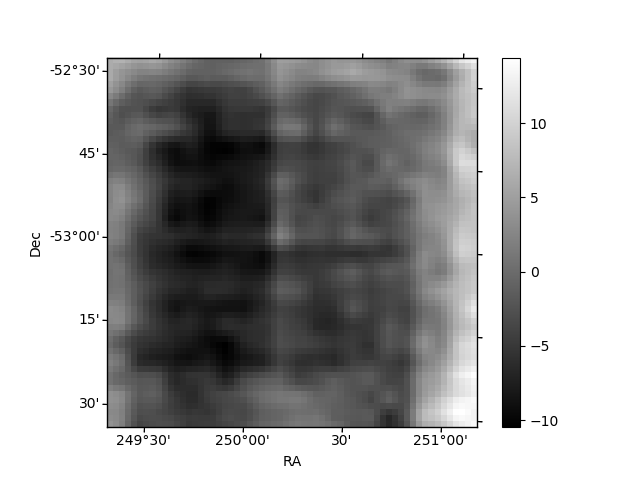
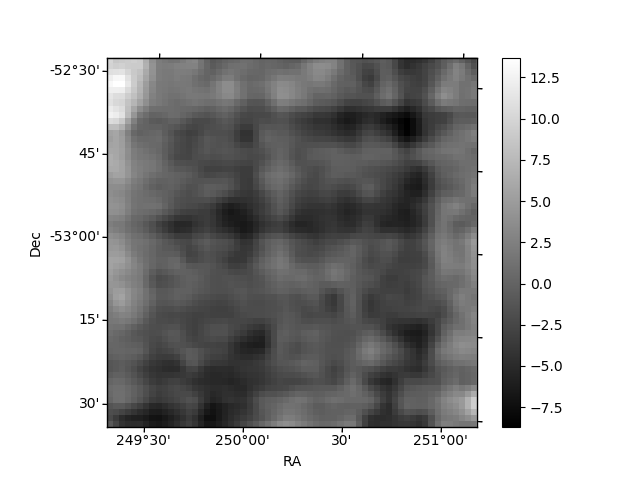
Histogram calculated using DETX and DETY for each event in the final _common_clean file
| Quadrant A | 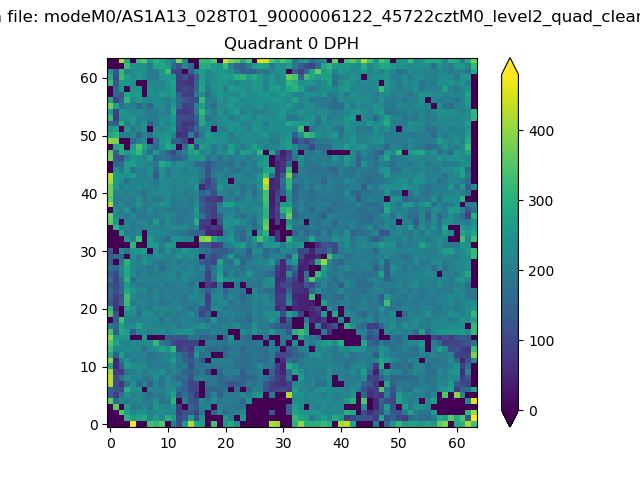 |
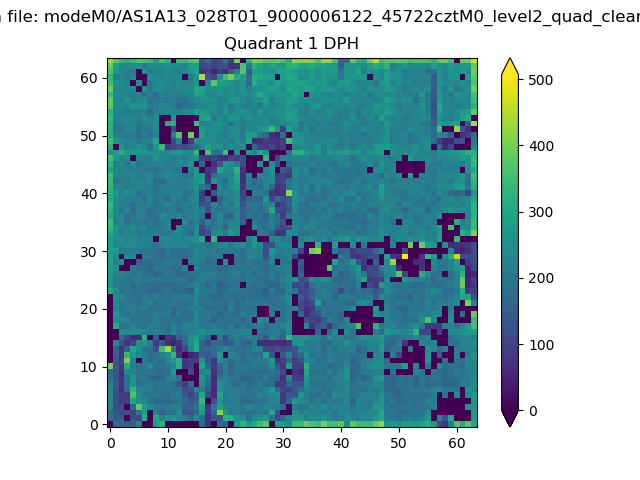 |
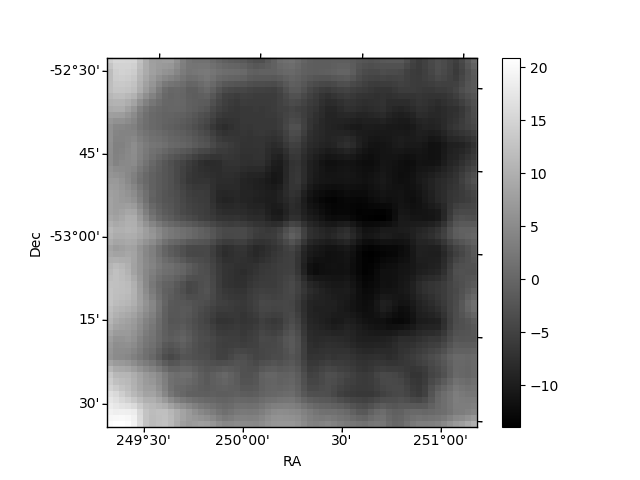
Quadrant B |
|---|---|---|---|
| Quadrant D | 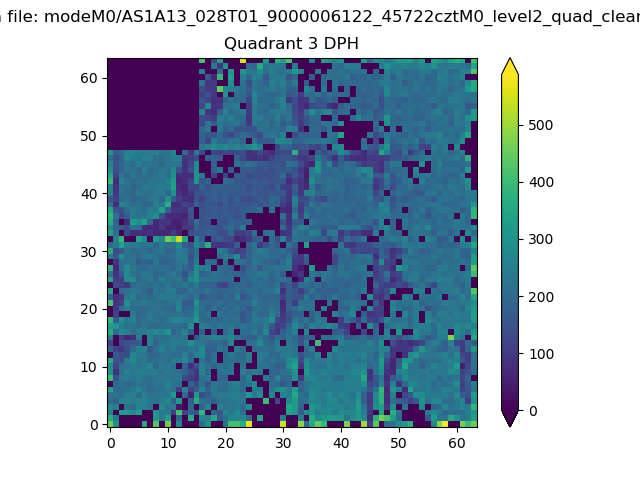 |
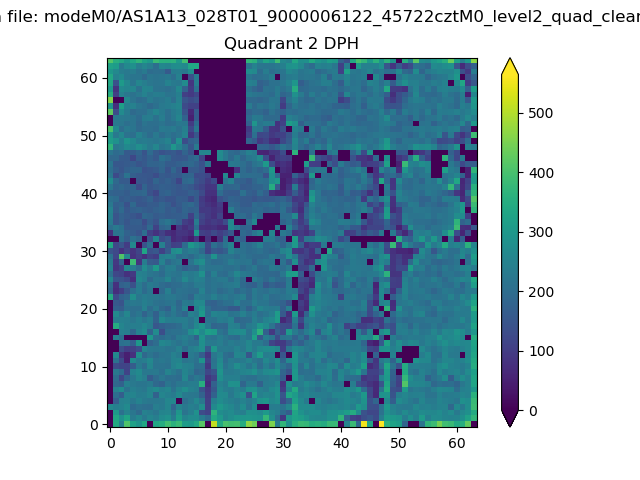 |
Quadrant C |
| Plot type | Count rate plots | Images |
|---|---|---|
| Comparison with Poisson distribution Blue bars denote a histogram of data divided into 1 sec bins. Red curve is a Poisson curve with rate = median count rate of data. |
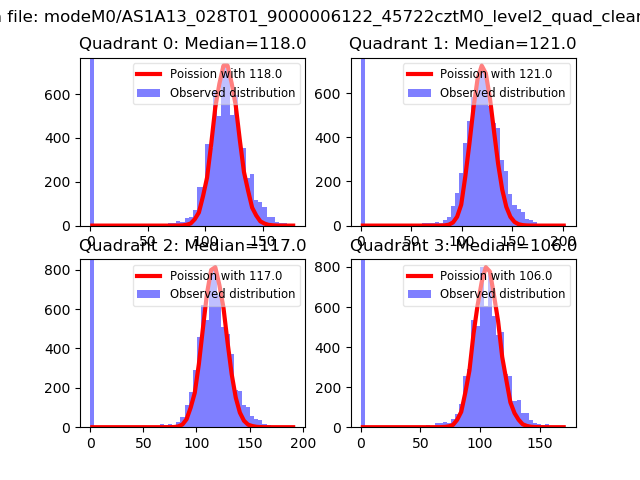 |
 |
| Quadrant-wise count rates Data is divided into 100 sec bins |
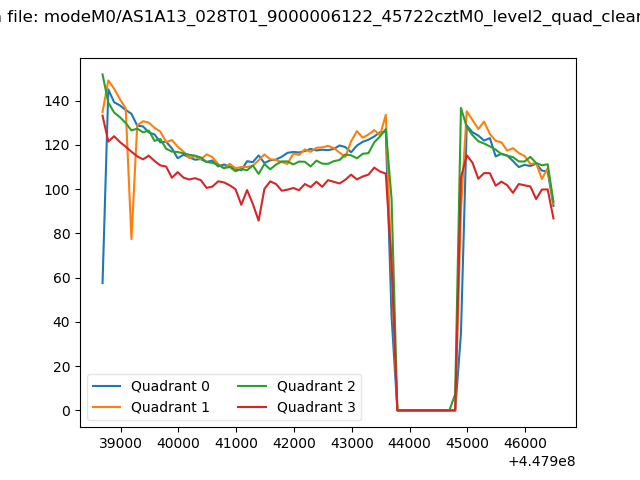 |
|
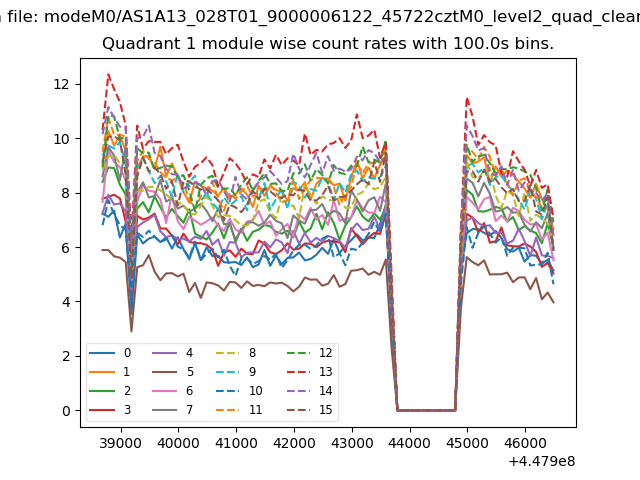
| Module-wise count rates for Quadrant A Data is divided into 100 sec bins |
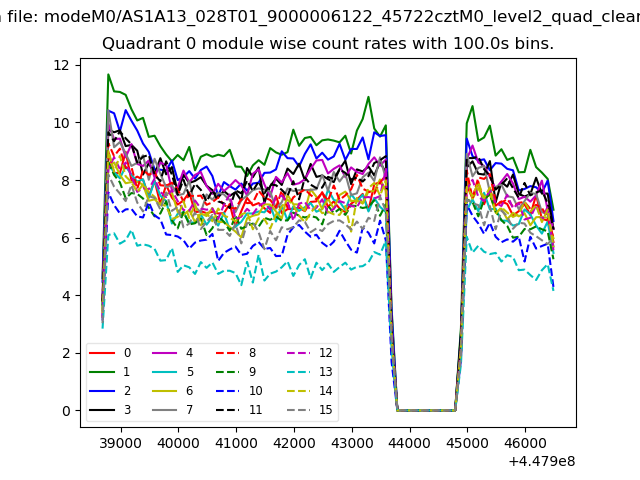 |
 |
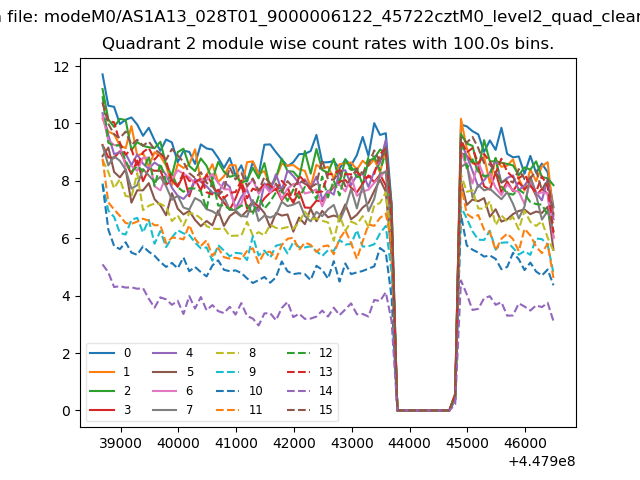
| Module-wise count rates for Quadrant B Data is divided into 100 sec bins |
 |
 |
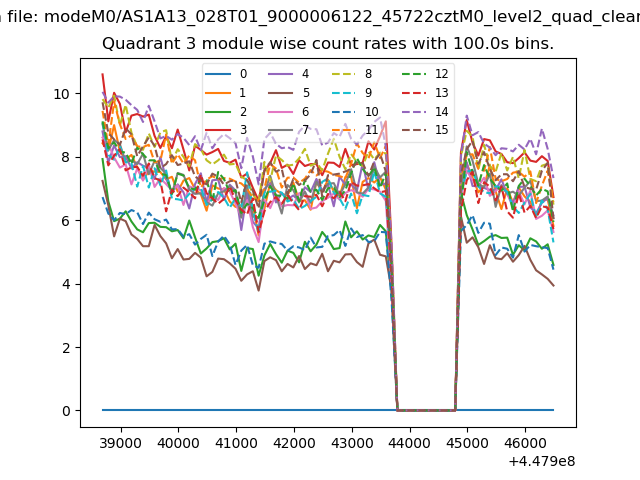
| Module-wise count rates for Quadrant C Data is divided into 100 sec bins |
 |
 |
| Module-wise count rates for Quadrant D Data is divided into 100 sec bins |
 |
 |
| Parameter | Plot |
|---|---|
| CZT HV Monitor | 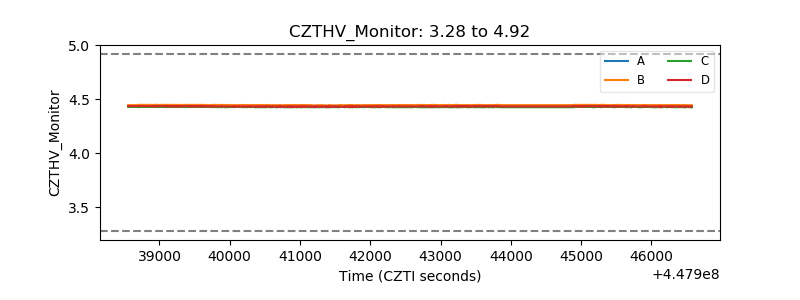 |
| D_VDD | 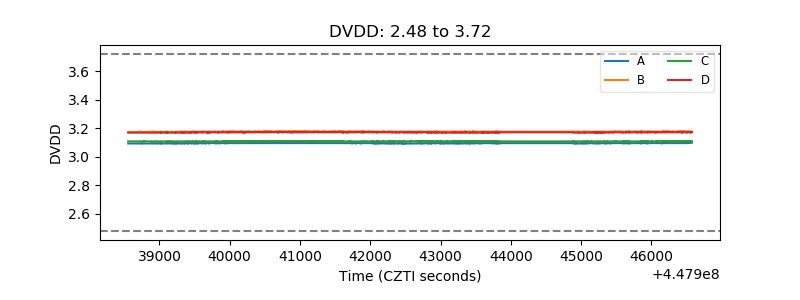 |
| Temperature 1 | 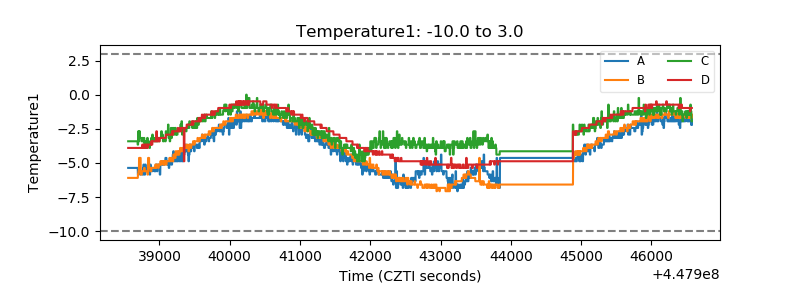 |
| Veto HV Monitor |  |
| Veto LLD | 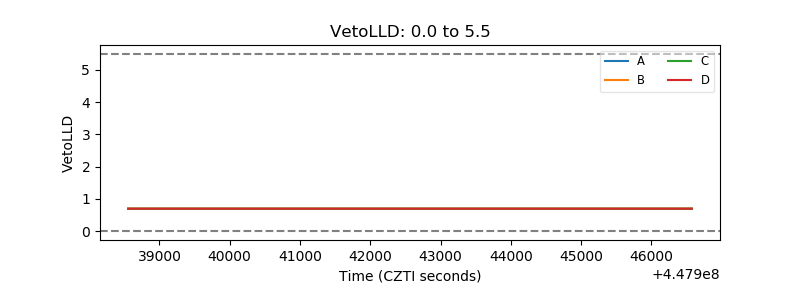 |
| Alpha Counter | 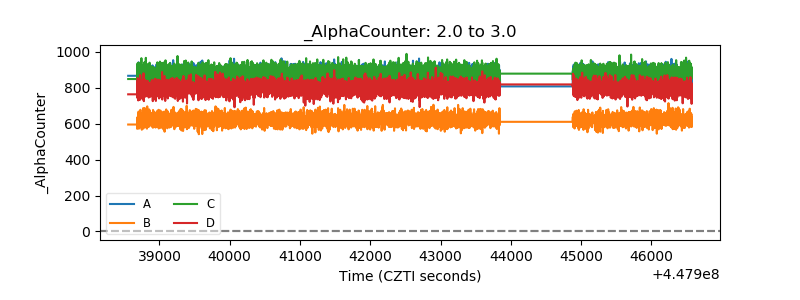 |
| _CPM_Rate | 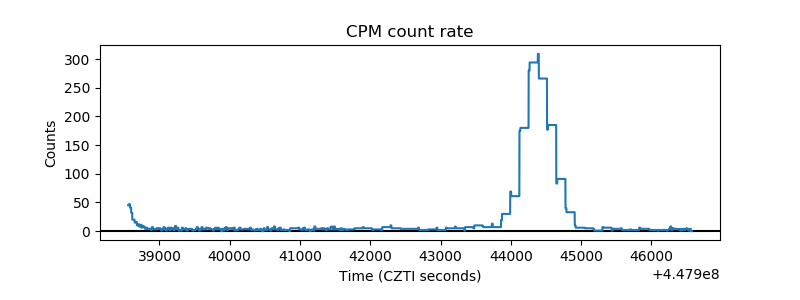 |
| CZT Counter | 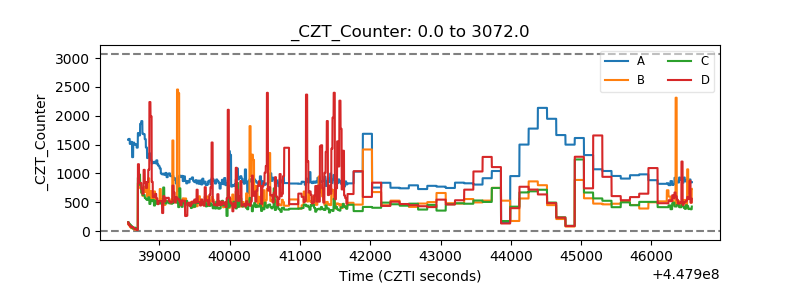 |
| +2.5 Volts monitor | 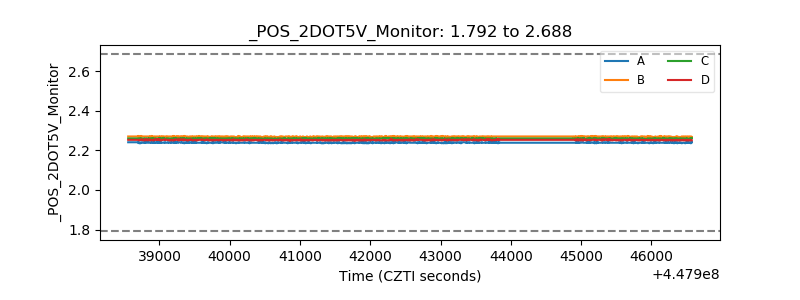 |
| +5 Volts monitor | 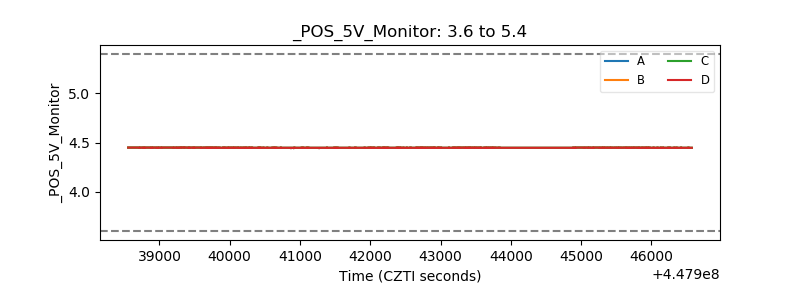 |
| _ROLL_ROT | 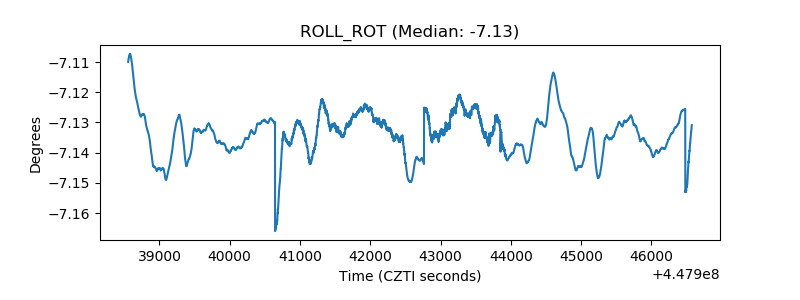 |
| _Roll_DEC | 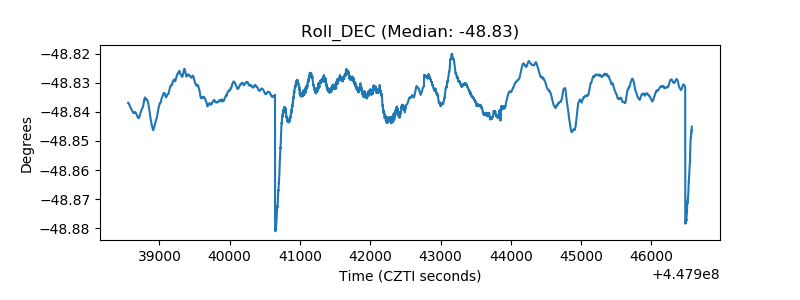 |
| _Roll_RA | 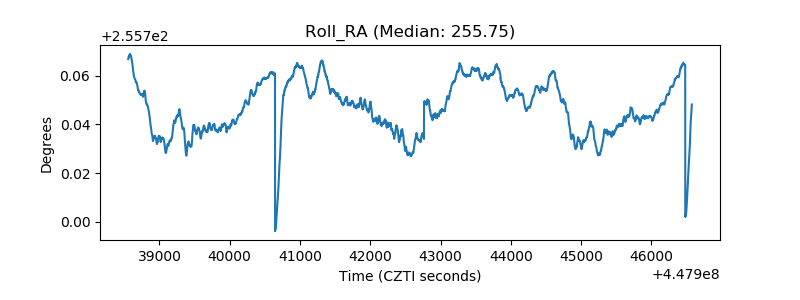 |
| Veto Counter | 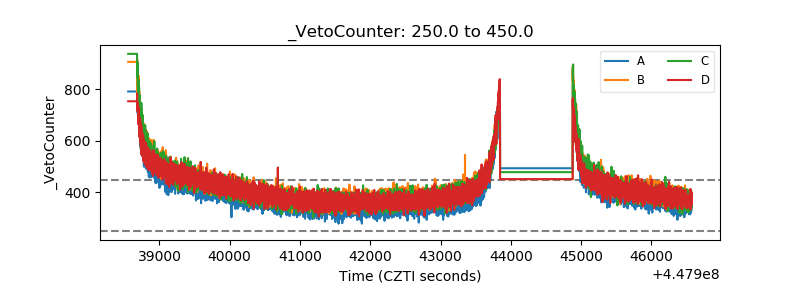 |