| Param | Original file | Final file |
|---|---|---|
| Filename | modeM0/AS1A13_028T01_9000006122_45723cztM0_level2.fits | modeM0/AS1A13_028T01_9000006122_45723cztM0_level2_quad_clean.evt |
| Size (bytes) | 261,074,880 | 60,724,800 |
| Size | 249.0 MB | 57.9 MB |
| Events in quadrant A | 3,255,272 | 403,188 |
| Events in quadrant B | 2,219,358 | 411,823 |
| Events in quadrant C | 1,569,593 | 402,880 |
| Events in quadrant D | 2,337,538 | 364,895 |
| Mode SS | |||
|---|---|---|---|
| Quadrant | BADHDUFLAG | Total packets | Discarded packets |
| A | 0 | 72 | 0 |
| B | 0 | 72 | 0 |
| C | 0 | 72 | 0 |
| D | 0 | 72 | 0 |
| Mode M0 | |||
|---|---|---|---|
| Quadrant | BADHDUFLAG | Total packets | Discarded packets |
| A | 0 | 11831 | 1 |
| B | 0 | 8908 | 1 |
| C | 0 | 7345 | 1 |
| D | 0 | 9431 | 1 |
| Quadrant | Total seconds | Saturated seconds | Saturation percentage |
|---|---|---|---|
| A | 3618 | 67 | 1.851852% |
| B | 3618 | 93 | 2.570481% |
| C | 3619 | 5 | 0.138160% |
| D | 3619 | 85 | 2.348715% |
Noise dominated data is calculated using 1-second bins in cleaned event files. If a bin has >2000 counts, and if more than 50% of those come from <1% of pixels, then it is considered to be noise-dominated and hence unusable.
| Quadrant | # 1 sec bins | Bins with >0 counts | Bins with >2000 counts | High rate bins dominated by noise | Noise dominated (total time) | Noise dominated (detector-on time) | Marked lightcurve |
|---|---|---|---|---|---|---|---|
| A | 3618 | 3618 | 0 | 0 | 0.00% | 0.00% | 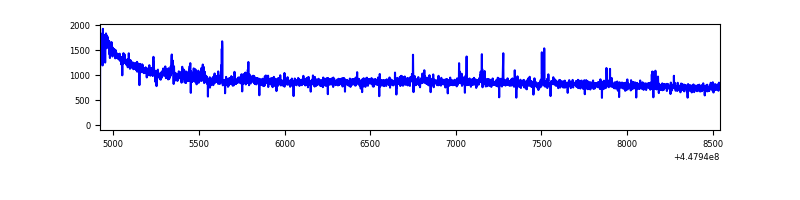 |
| B | 3618 | 3618 | 59 | 59 | 1.63% | 1.63% | 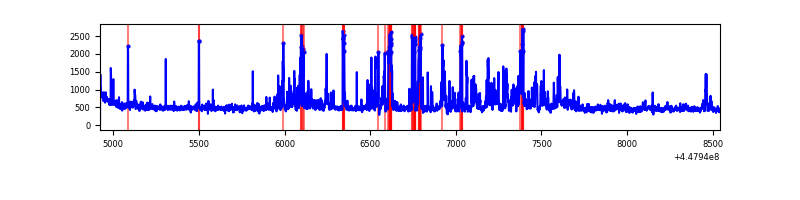 |
| C | 3618 | 3618 | 1 | 1 | 0.03% | 0.03% | 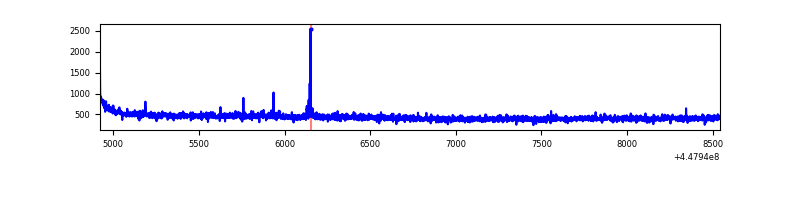 |
| D | 3618 | 3618 | 66 | 66 | 1.82% | 1.82% | 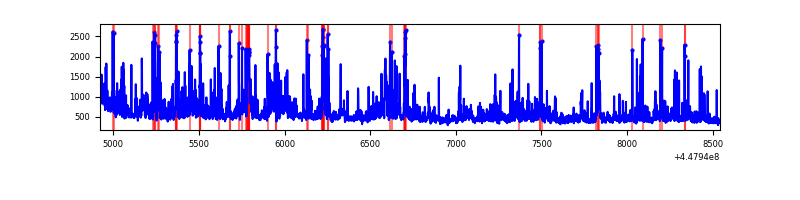 |
Top three noisy pixels from each quadrant. If the there are fewer than three noisy pixels in the level2.evt file, extra rows are filled as -1
| Pixel properties | Quadrant properties | ||||||
|---|---|---|---|---|---|---|---|
| Quadrant | DetID | PixID | Counts | Sigma | Mean | Median | Sigma |
| A | 10 | 83 | 1606636 | 18826.58 | 407 | 398 | 85.3 |
| A | 7 | 3 | 24711 | 284.97 | 407 | 398 | 85.3 |
| A | 13 | 248 | 21355 | 245.64 | 407 | 398 | 85.3 |
| B | 3 | 112 | 346794 | 4334.42 | 403 | 392 | 79.9 |
| B | 4 | 171 | 165835 | 2070.14 | 403 | 392 | 79.9 |
| B | 0 | 189 | 47215 | 585.88 | 403 | 392 | 79.9 |
| C | 0 | 207 | 12903 | 132.66 | 397 | 399 | 94.3 |
| C | 12 | 2 | 4994 | 48.75 | 397 | 399 | 94.3 |
| C | 3 | 233 | 3612 | 34.09 | 397 | 399 | 94.3 |
| D | 1 | 52 | 621153 | 6200.43 | 395 | 383 | 100.1 |
| D | 2 | 249 | 47314 | 468.76 | 395 | 383 | 100.1 |
| D | 13 | 171 | 41233 | 408.02 | 395 | 383 | 100.1 |
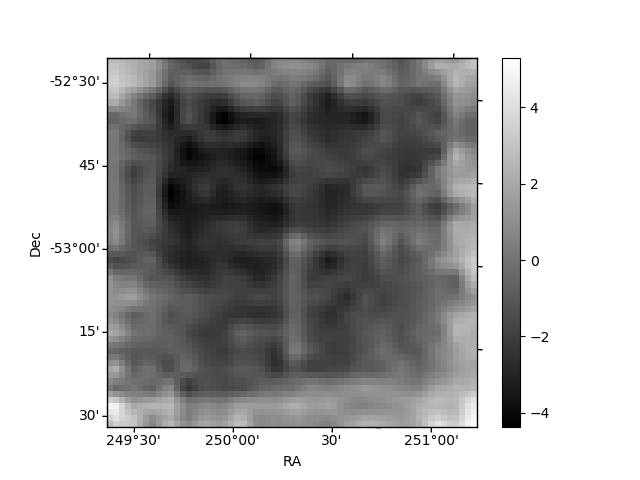
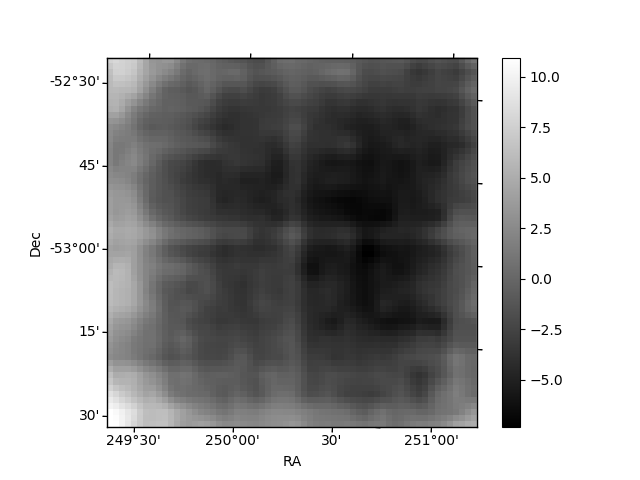
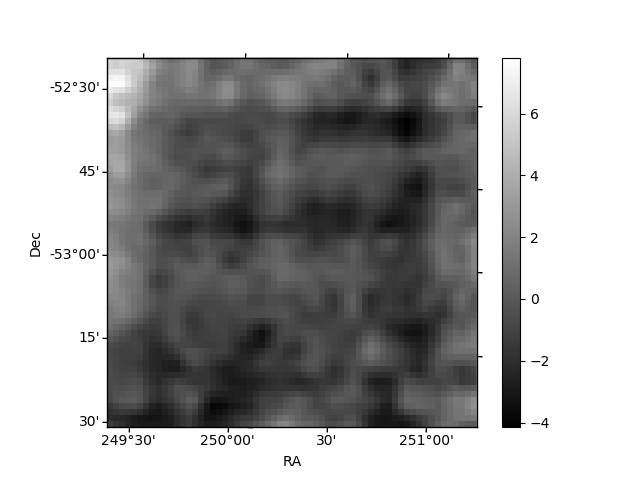
Histogram calculated using DETX and DETY for each event in the final _common_clean file
| Quadrant A | 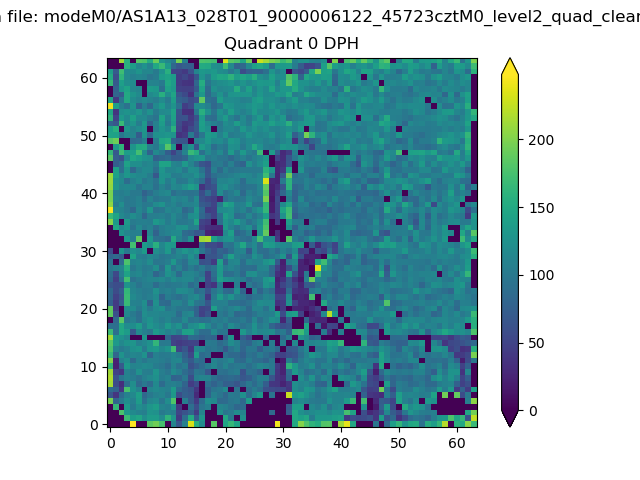 |
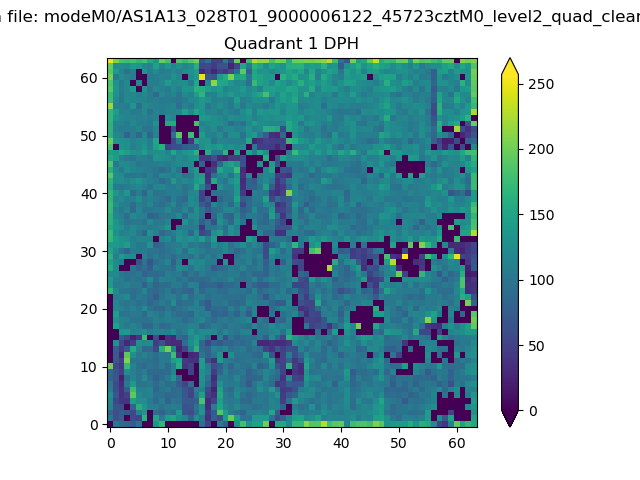 |
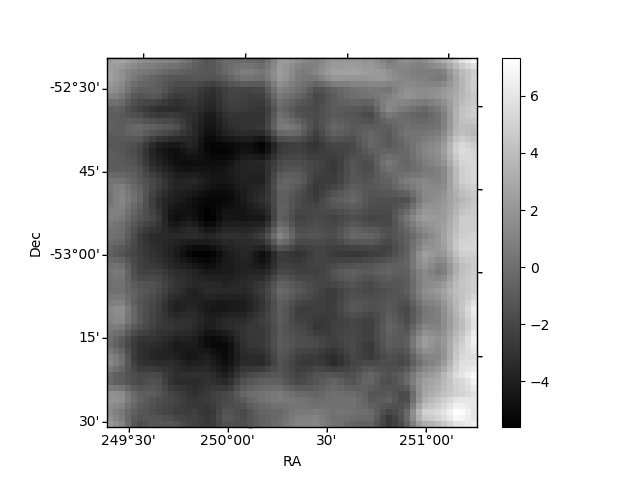
Quadrant B |
|---|---|---|---|
| Quadrant D | 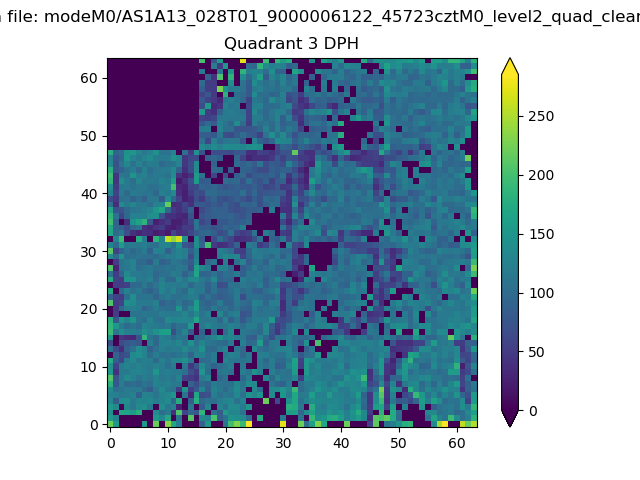 |
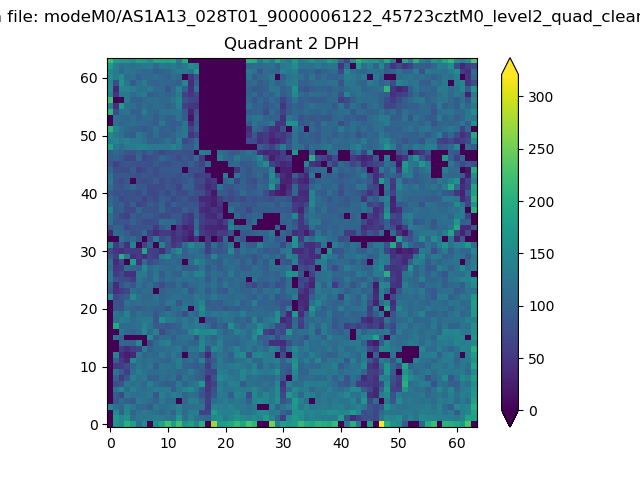 |
Quadrant C |
| Plot type | Count rate plots | Images |
|---|---|---|
| Comparison with Poisson distribution Blue bars denote a histogram of data divided into 1 sec bins. Red curve is a Poisson curve with rate = median count rate of data. |
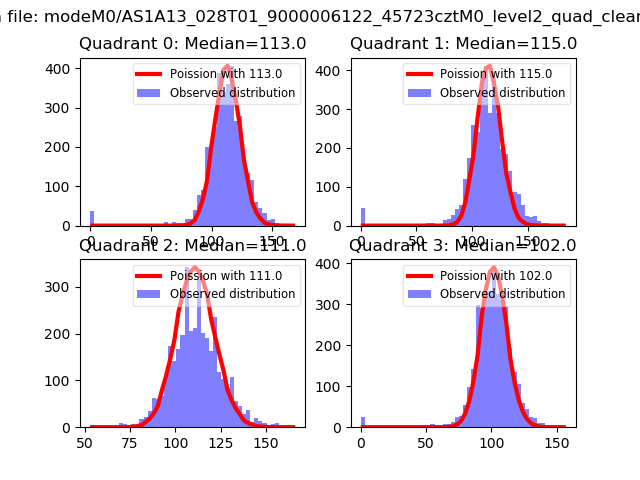 |
 |
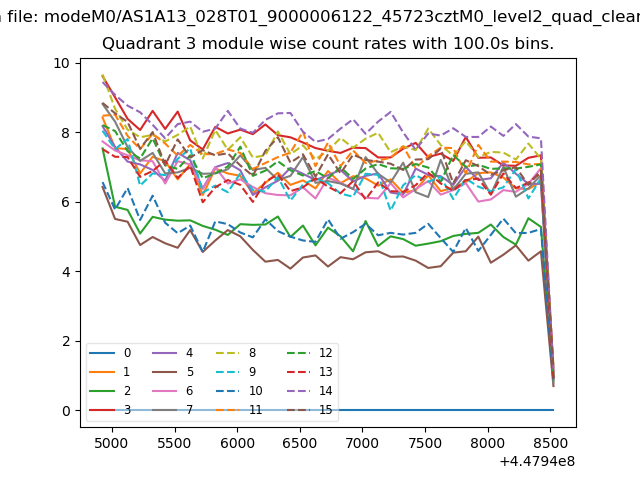
| Quadrant-wise count rates Data is divided into 100 sec bins |
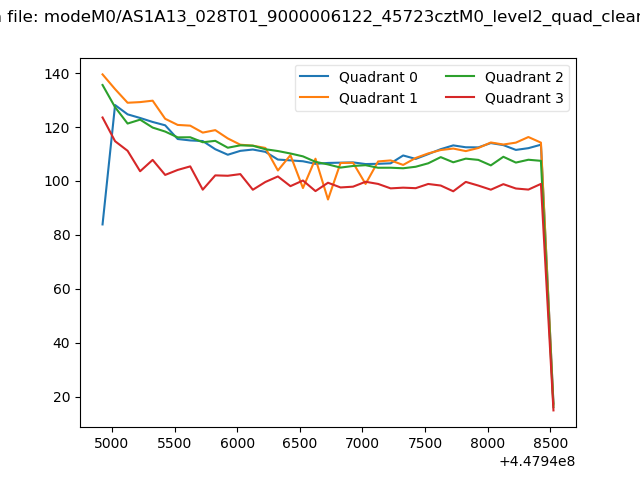 |
|
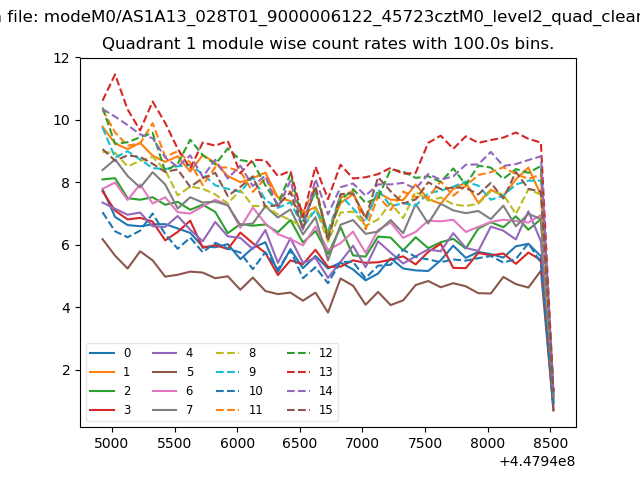
| Module-wise count rates for Quadrant A Data is divided into 100 sec bins |
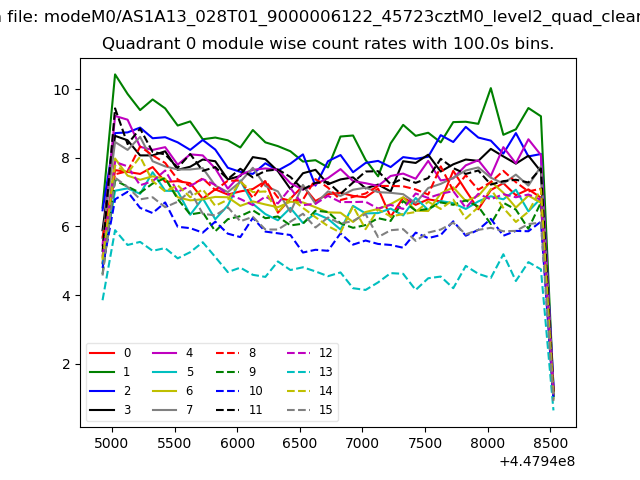 |
 |
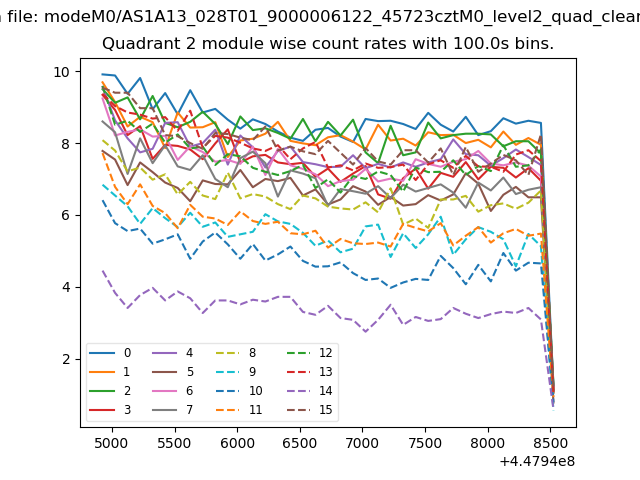
| Module-wise count rates for Quadrant B Data is divided into 100 sec bins |
 |
 |
| Module-wise count rates for Quadrant C Data is divided into 100 sec bins |
 |
 |
| Module-wise count rates for Quadrant D Data is divided into 100 sec bins |
 |
 |
| Parameter | Plot |
|---|---|
| CZT HV Monitor |  |
| D_VDD | 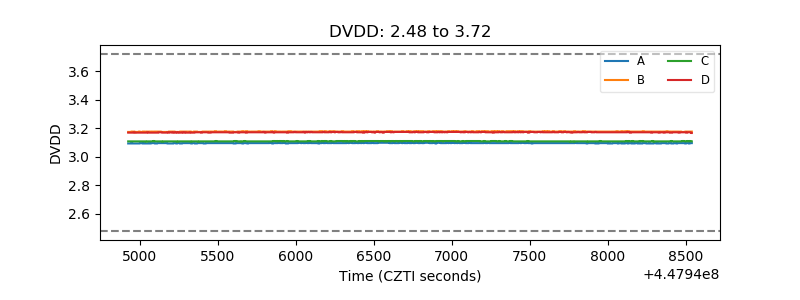 |
| Temperature 1 | 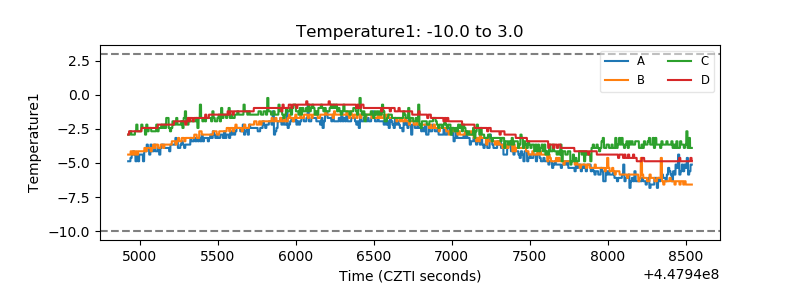 |
| Veto HV Monitor | 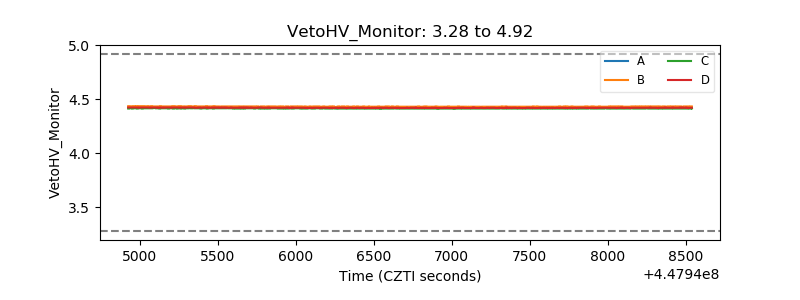 |
| Veto LLD | 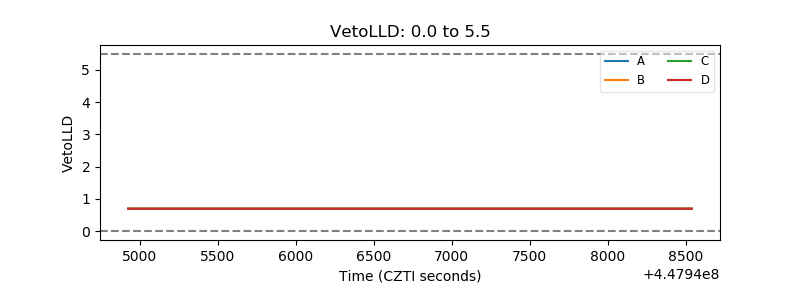 |
| Alpha Counter | 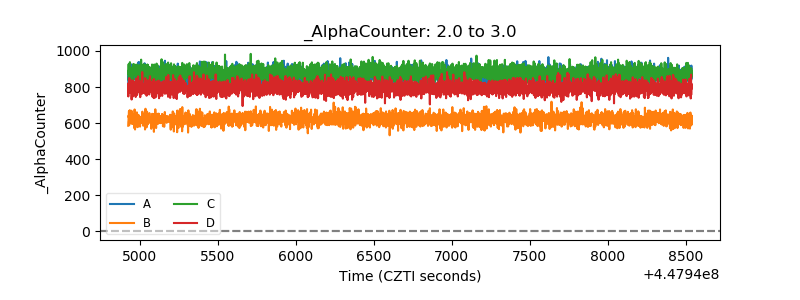 |
| _CPM_Rate | 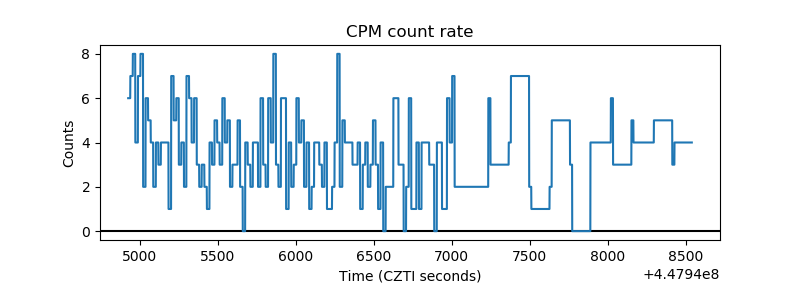 |
| CZT Counter | 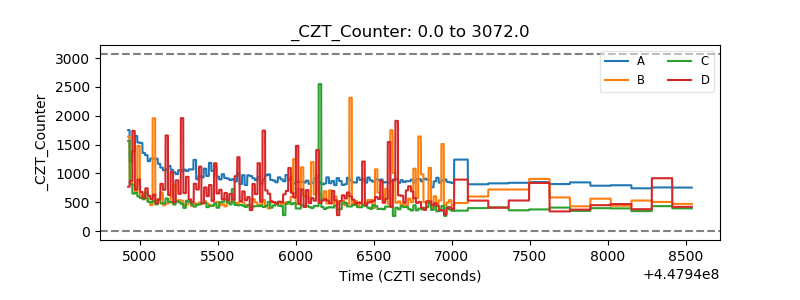 |
| +2.5 Volts monitor | 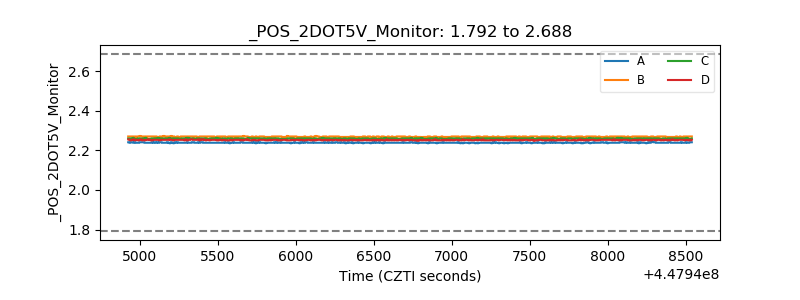 |
| +5 Volts monitor | 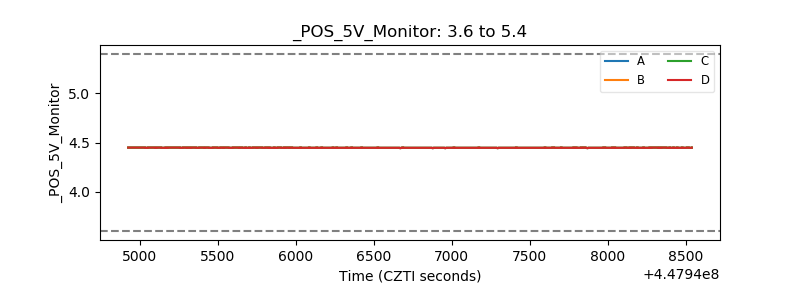 |
| _ROLL_ROT | 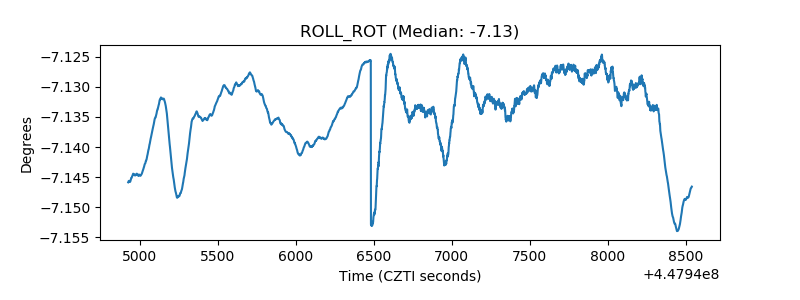 |
| _Roll_DEC | 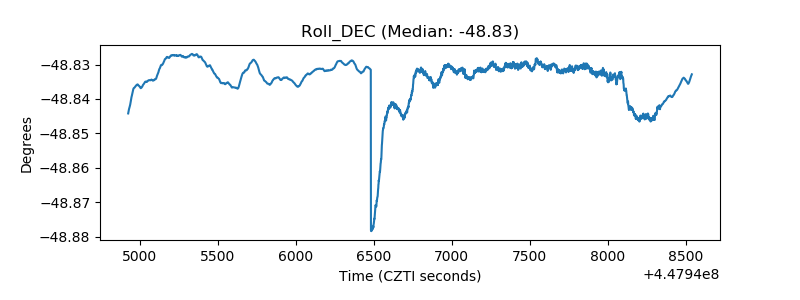 |
| _Roll_RA |  |
| Veto Counter | 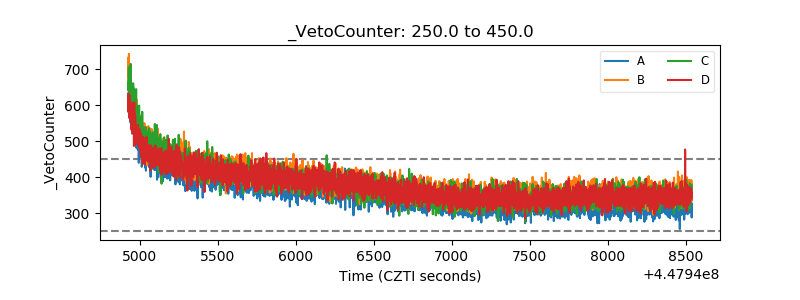 |