| Param | Original file | Final file |
|---|---|---|
| Filename | modeM0/AS1T05_183T01_9000006124_45723cztM0_level2.fits | modeM0/AS1T05_183T01_9000006124_45723cztM0_level2_quad_clean.evt |
| Size (bytes) | 200,594,880 | 37,463,040 |
| Size | 191.3 MB | 35.7 MB |
| Events in quadrant A | 2,260,831 | 238,594 |
| Events in quadrant B | 1,614,621 | 254,065 |
| Events in quadrant C | 1,438,751 | 251,950 |
| Events in quadrant D | 1,933,972 | 226,822 |
| Mode SS | |||
|---|---|---|---|
| Quadrant | BADHDUFLAG | Total packets | Discarded packets |
| A | 0 | 48 | 0 |
| B | 0 | 48 | 0 |
| C | 0 | 48 | 0 |
| D | 0 | 48 | 0 |
| Mode M0 | |||
|---|---|---|---|
| Quadrant | BADHDUFLAG | Total packets | Discarded packets |
| A | 0 | 8174 | 1 |
| B | 0 | 6293 | 1 |
| C | 0 | 5839 | 1 |
| D | 0 | 7335 | 1 |
| Mode M9 | |||
|---|---|---|---|
| Quadrant | BADHDUFLAG | Total packets | Discarded packets |
| A | 0 | 8 | 0 |
| B | 0 | 8 | 0 |
| C | 0 | 8 | 0 |
| D | 0 | 8 | 0 |
| Quadrant | Total seconds | Saturated seconds | Saturation percentage |
|---|---|---|---|
| A | 2255 | 235 | 10.421286% |
| B | 2255 | 183 | 8.115299% |
| C | 2255 | 157 | 6.962306% |
| D | 2255 | 176 | 7.804878% |
Noise dominated data is calculated using 1-second bins in cleaned event files. If a bin has >2000 counts, and if more than 50% of those come from <1% of pixels, then it is considered to be noise-dominated and hence unusable.
| Quadrant | # 1 sec bins | Bins with >0 counts | Bins with >2000 counts | High rate bins dominated by noise | Noise dominated (total time) | Noise dominated (detector-on time) | Marked lightcurve |
|---|---|---|---|---|---|---|---|
| A | 3065 | 2256 | 2 | 2 | 0.07% | 0.09% | 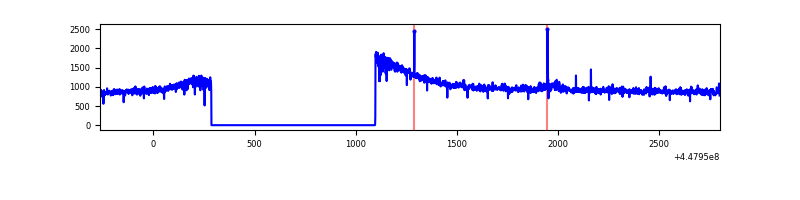 |
| B | 3065 | 2255 | 50 | 50 | 1.63% | 2.22% | 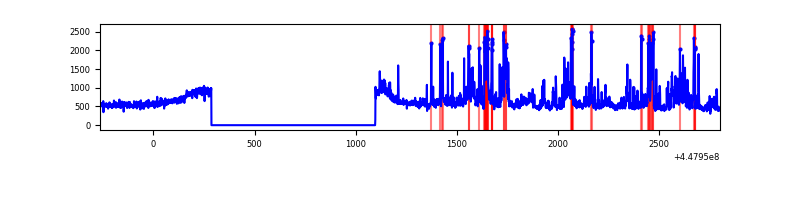 |
| C | 3065 | 2256 | 59 | 59 | 1.92% | 2.62% | 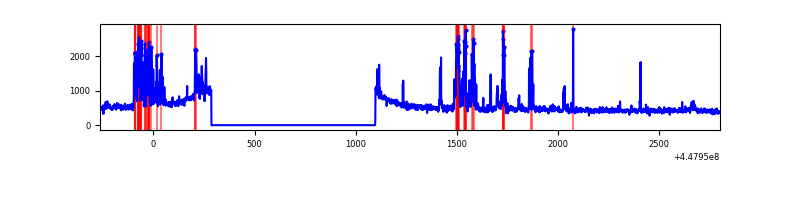 |
| D | 3065 | 2255 | 88 | 88 | 2.87% | 3.90% | 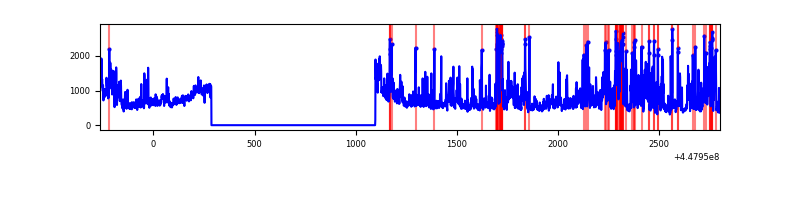 |
Top three noisy pixels from each quadrant. If the there are fewer than three noisy pixels in the level2.evt file, extra rows are filled as -1
| Pixel properties | Quadrant properties | ||||||
|---|---|---|---|---|---|---|---|
| Quadrant | DetID | PixID | Counts | Sigma | Mean | Median | Sigma |
| A | 10 | 83 | 1107871 | 17779.23 | 291 | 283 | 62.3 |
| A | 2 | 79 | 10242 | 159.86 | 291 | 283 | 62.3 |
| A | 13 | 248 | 7372 | 113.79 | 291 | 283 | 62.3 |
| B | 3 | 112 | 212538 | 3476.19 | 290 | 280 | 61.1 |
| B | 15 | 201 | 81848 | 1335.85 | 290 | 280 | 61.1 |
| B | 0 | 186 | 67143 | 1095.03 | 290 | 280 | 61.1 |
| C | 14 | 254 | 300283 | 4319.01 | 284 | 286 | 69.5 |
| C | 1 | 241 | 14156 | 199.68 | 284 | 286 | 69.5 |
| C | 0 | 207 | 5384 | 73.4 | 284 | 286 | 69.5 |
| D | 1 | 52 | 544263 | 7268.81 | 287 | 277 | 74.8 |
| D | 13 | 249 | 165818 | 2211.98 | 287 | 277 | 74.8 |
| D | 2 | 249 | 47371 | 629.28 | 287 | 277 | 74.8 |
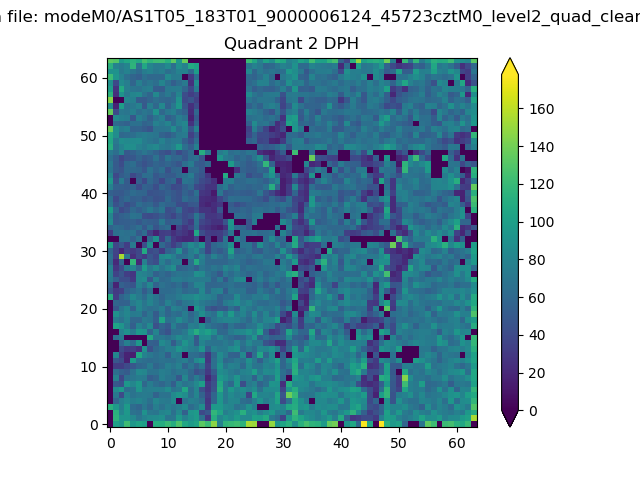
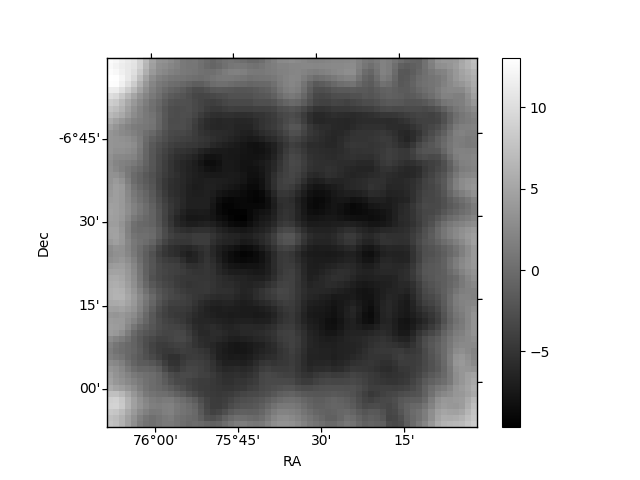
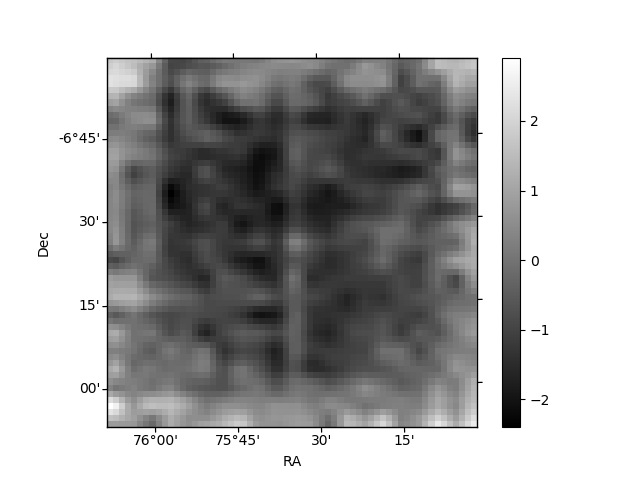
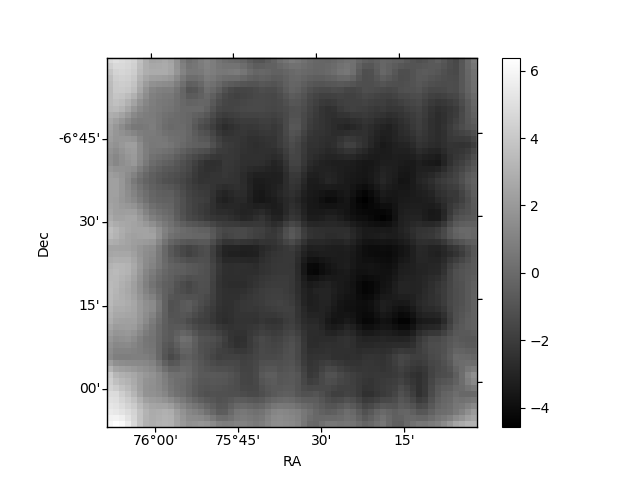
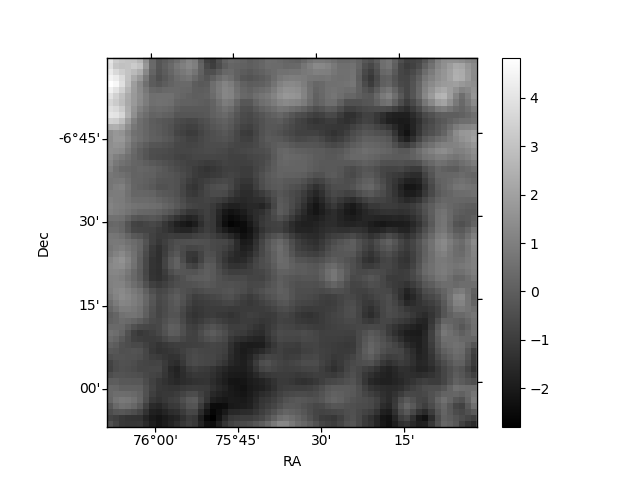
Histogram calculated using DETX and DETY for each event in the final _common_clean file
| Quadrant A | 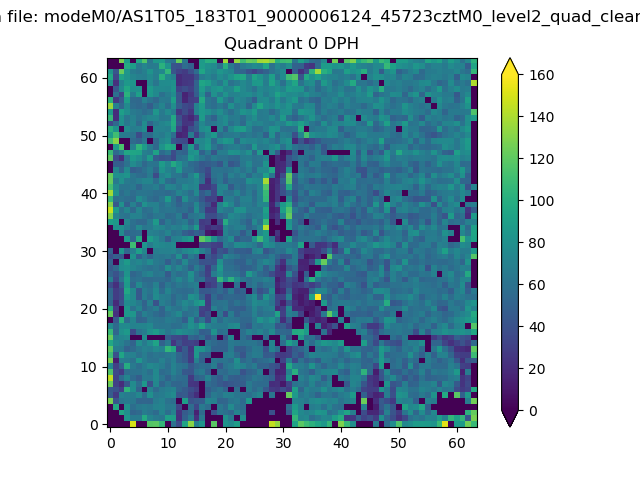 |
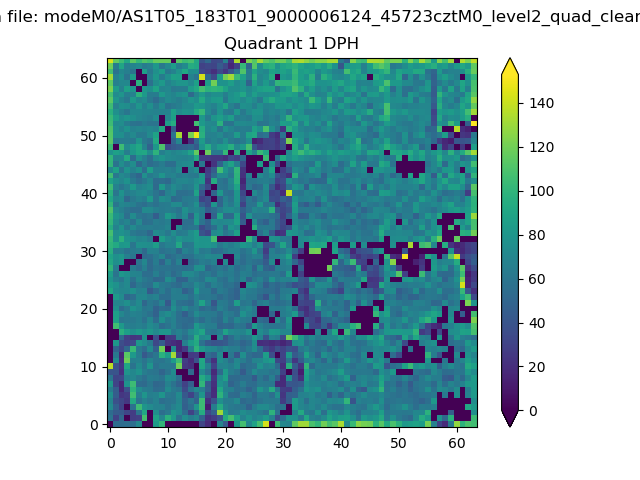 |
Quadrant B |
|---|---|---|---|
| Quadrant D | 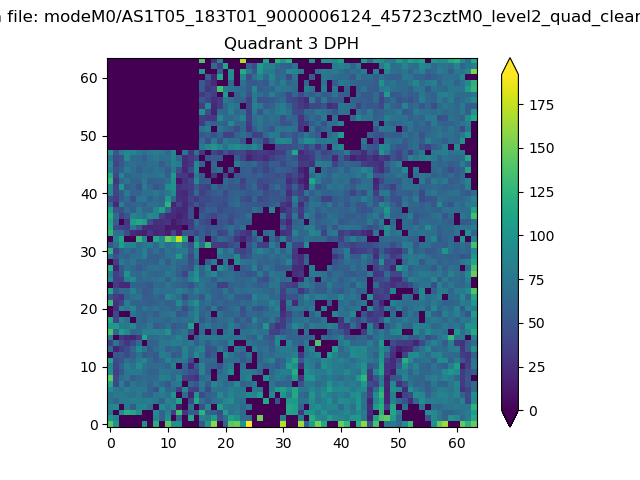 |
 |
Quadrant C |
| Plot type | Count rate plots | Images |
|---|---|---|
| Comparison with Poisson distribution Blue bars denote a histogram of data divided into 1 sec bins. Red curve is a Poisson curve with rate = median count rate of data. |
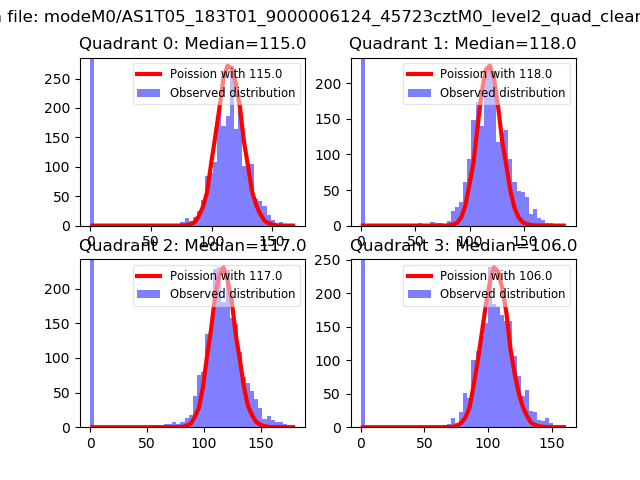 |
 |
| Quadrant-wise count rates Data is divided into 100 sec bins |
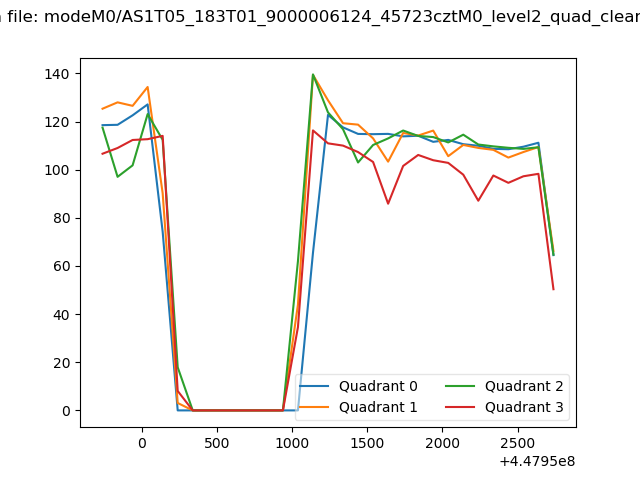 |
|
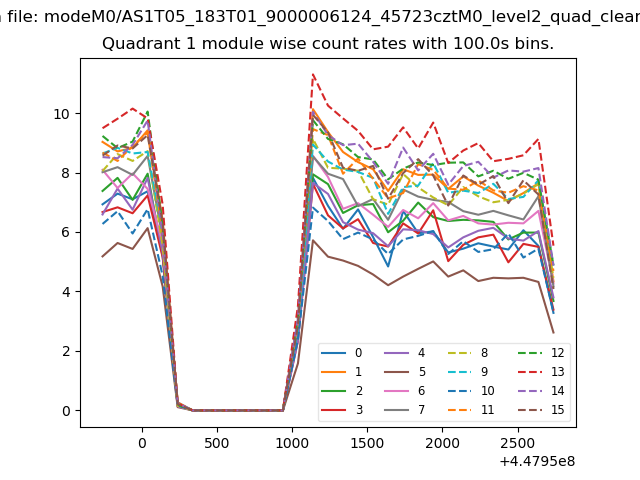
| Module-wise count rates for Quadrant A Data is divided into 100 sec bins |
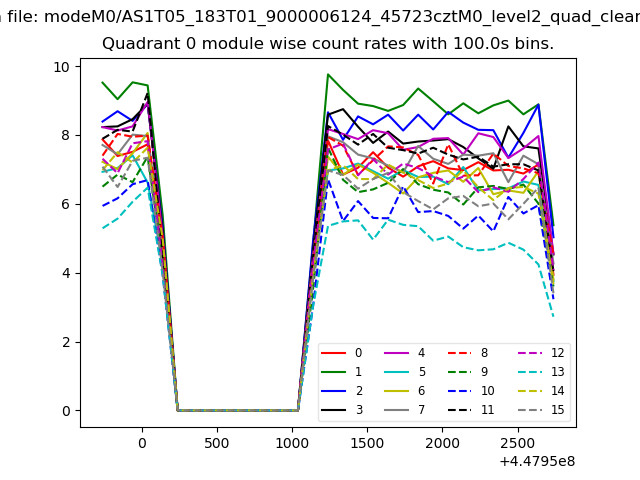 |
 |
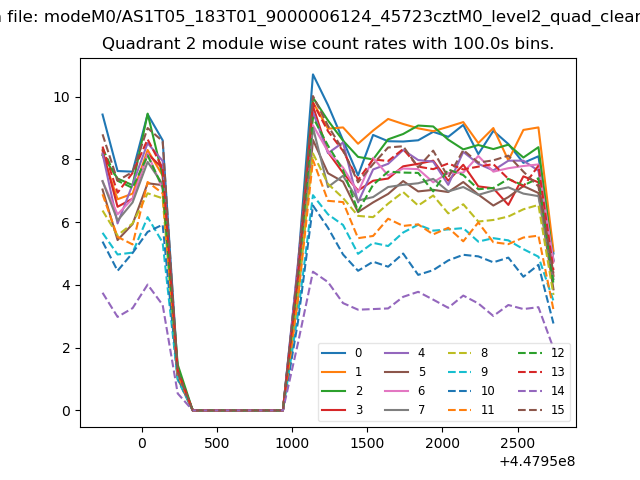
| Module-wise count rates for Quadrant B Data is divided into 100 sec bins |
 |
 |
| Module-wise count rates for Quadrant C Data is divided into 100 sec bins |
 |
 |
| Module-wise count rates for Quadrant D Data is divided into 100 sec bins |
 |
 |
| Parameter | Plot |
|---|---|
| CZT HV Monitor | 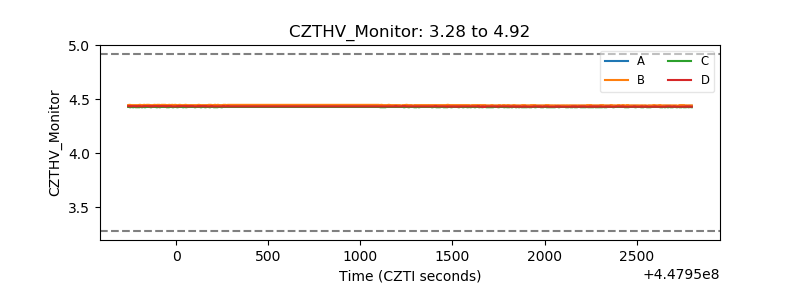 |
| D_VDD | 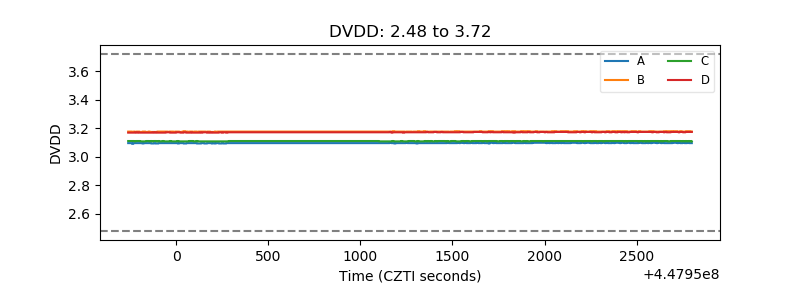 |
| Temperature 1 | 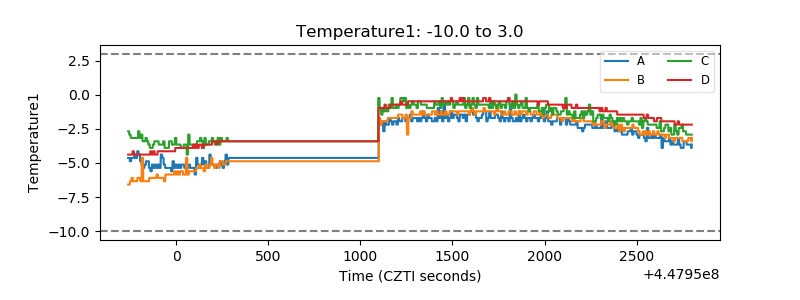 |
| Veto HV Monitor | 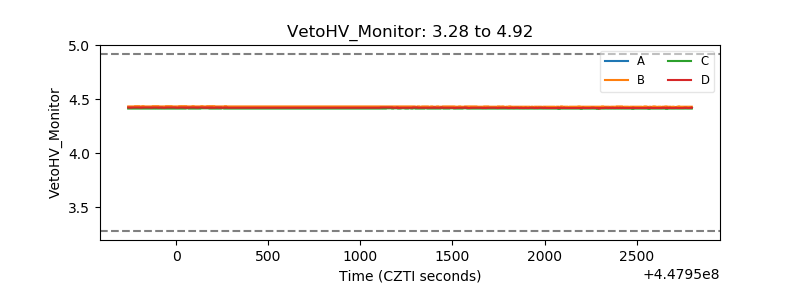 |
| Veto LLD | 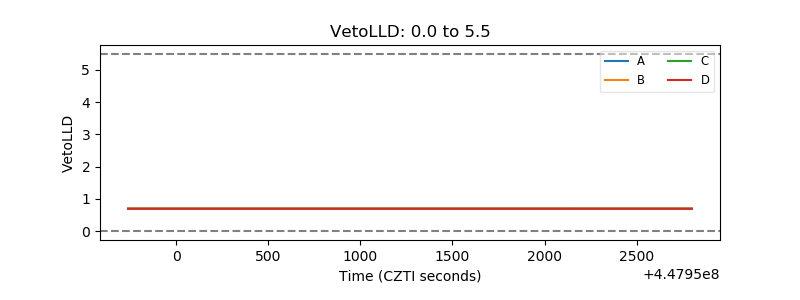 |
| Alpha Counter | 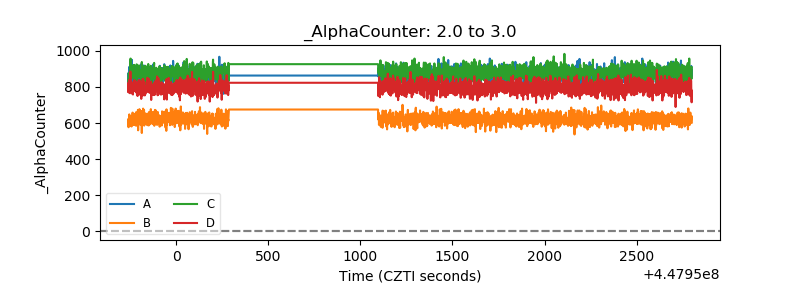 |
| _CPM_Rate | 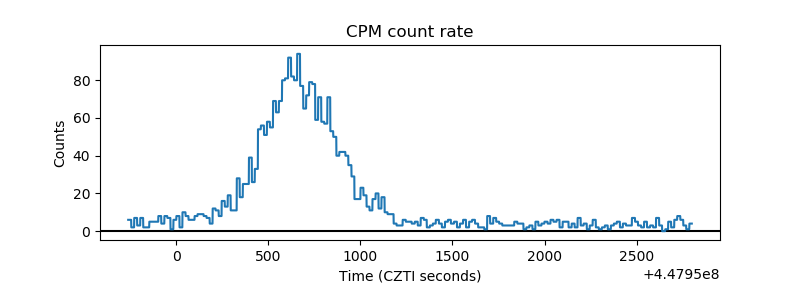 |
| CZT Counter | 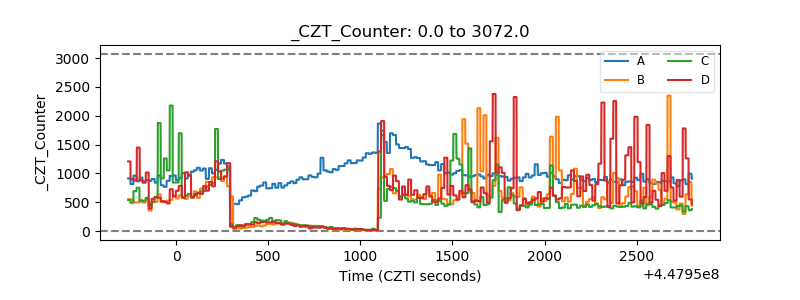 |
| +2.5 Volts monitor | 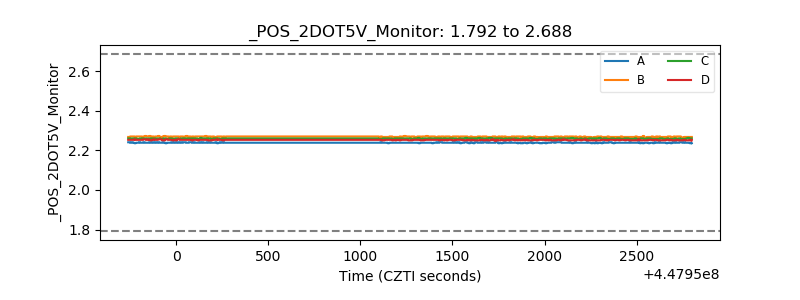 |
| +5 Volts monitor | 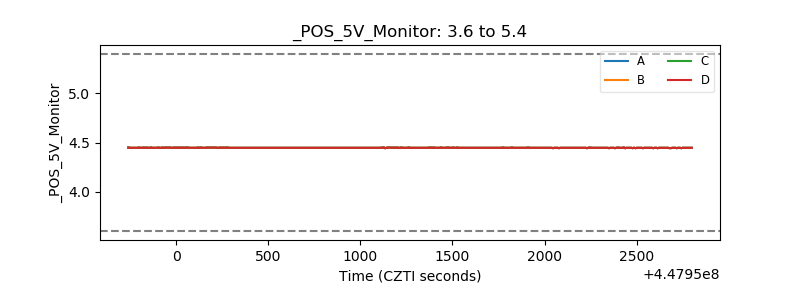 |
| _ROLL_ROT | 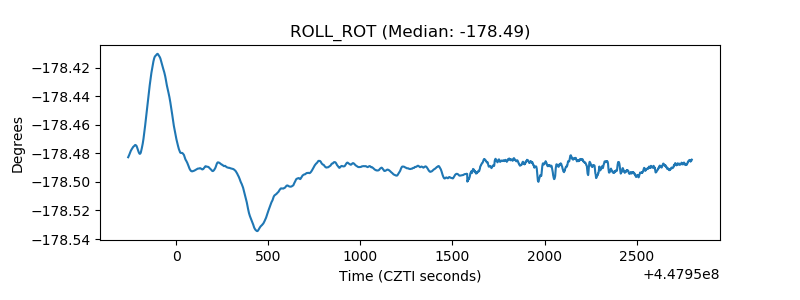 |
| _Roll_DEC | 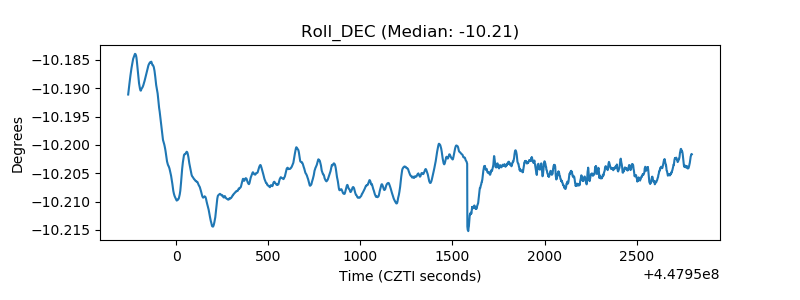 |
| _Roll_RA | 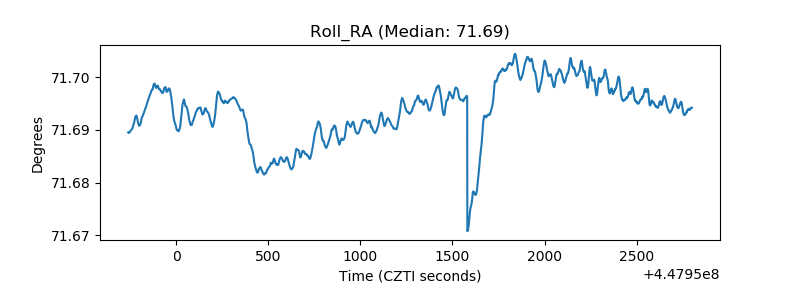 |
| Veto Counter | 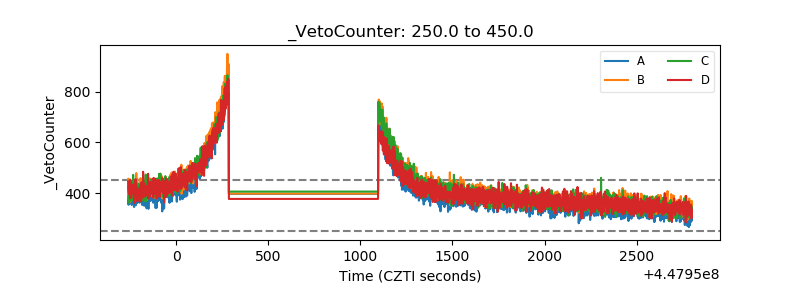 |