| Param | Original file | Final file |
|---|---|---|
| Filename | modeM0/AS1T05_183T01_9000006124_45725cztM0_level2.fits | modeM0/AS1T05_183T01_9000006124_45725cztM0_level2_quad_clean.evt |
| Size (bytes) | 627,094,080 | 127,987,200 |
| Size | 598.0 MB | 122.1 MB |
| Events in quadrant A | 6,984,523 | 854,082 |
| Events in quadrant B | 5,258,335 | 863,627 |
| Events in quadrant C | 3,889,245 | 861,180 |
| Events in quadrant D | 6,471,488 | 748,636 |
| Mode SS | |||
|---|---|---|---|
| Quadrant | BADHDUFLAG | Total packets | Discarded packets |
| A | 0 | 158 | 0 |
| B | 0 | 158 | 0 |
| C | 0 | 158 | 0 |
| D | 0 | 158 | 0 |
| Mode M0 | |||
|---|---|---|---|
| Quadrant | BADHDUFLAG | Total packets | Discarded packets |
| A | 0 | 26156 | 2 |
| B | 0 | 20809 | 2 |
| C | 0 | 17190 | 2 |
| D | 0 | 24638 | 3 |
| Quadrant | Total seconds | Saturated seconds | Saturation percentage |
|---|---|---|---|
| A | 7874 | 144 | 1.828804% |
| B | 7874 | 246 | 3.124206% |
| C | 7875 | 71 | 0.901587% |
| D | 7874 | 533 | 6.769114% |
Noise dominated data is calculated using 1-second bins in cleaned event files. If a bin has >2000 counts, and if more than 50% of those come from <1% of pixels, then it is considered to be noise-dominated and hence unusable.
| Quadrant | # 1 sec bins | Bins with >0 counts | Bins with >2000 counts | High rate bins dominated by noise | Noise dominated (total time) | Noise dominated (detector-on time) | Marked lightcurve |
|---|---|---|---|---|---|---|---|
| A | 7889 | 7875 | 4 | 4 | 0.05% | 0.05% | 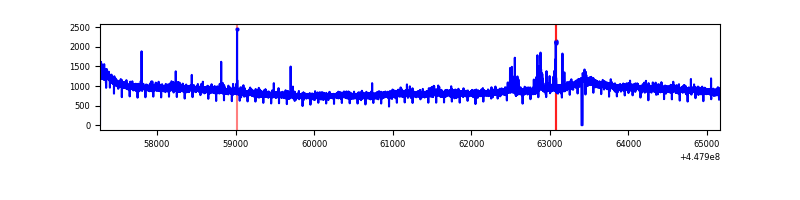 |
| B | 7889 | 7874 | 162 | 162 | 2.05% | 2.06% | 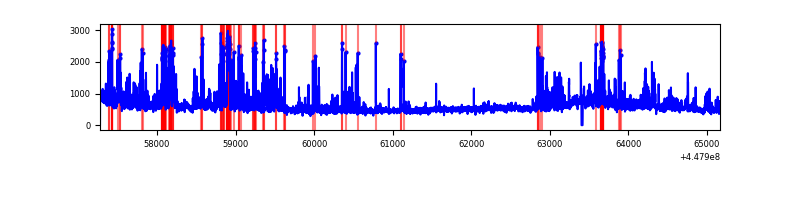 |
| C | 7890 | 7876 | 58 | 58 | 0.74% | 0.74% | 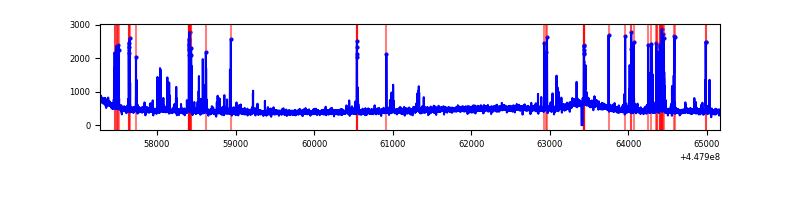 |
| D | 7889 | 7874 | 512 | 512 | 6.49% | 6.50% | 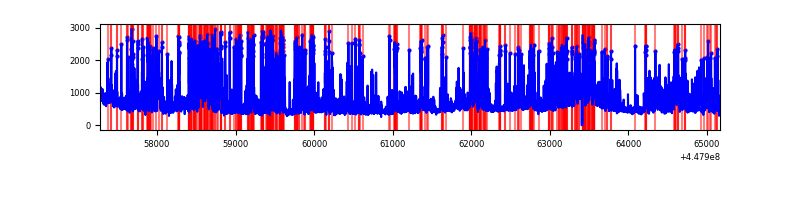 |
Top three noisy pixels from each quadrant. If the there are fewer than three noisy pixels in the level2.evt file, extra rows are filled as -1
| Pixel properties | Quadrant properties | ||||||
|---|---|---|---|---|---|---|---|
| Quadrant | DetID | PixID | Counts | Sigma | Mean | Median | Sigma |
| A | 10 | 83 | 3381355 | 17885.94 | 904 | 885 | 189.0 |
| A | 7 | 3 | 36465 | 188.25 | 904 | 885 | 189.0 |
| A | 13 | 248 | 32942 | 169.61 | 904 | 885 | 189.0 |
| B | 3 | 112 | 755902 | 4271.57 | 892 | 864 | 176.8 |
| B | 4 | 171 | 368091 | 2077.56 | 892 | 864 | 176.8 |
| B | 4 | 200 | 153119 | 861.37 | 892 | 864 | 176.8 |
| C | 14 | 254 | 276739 | 1310.62 | 887 | 891 | 210.5 |
| C | 12 | 2 | 35207 | 163.04 | 887 | 891 | 210.5 |
| C | 0 | 207 | 34420 | 159.3 | 887 | 891 | 210.5 |
| D | 1 | 52 | 1539332 | 6953.77 | 867 | 838 | 221.2 |
| D | 13 | 249 | 602261 | 2718.35 | 867 | 838 | 221.2 |
| D | 2 | 249 | 423367 | 1909.77 | 867 | 838 | 221.2 |
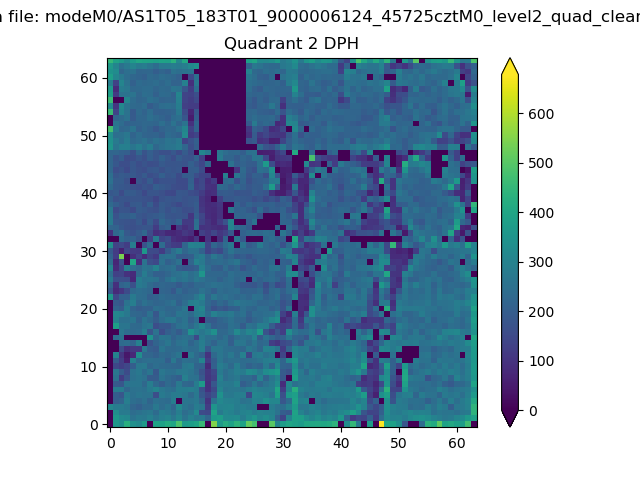
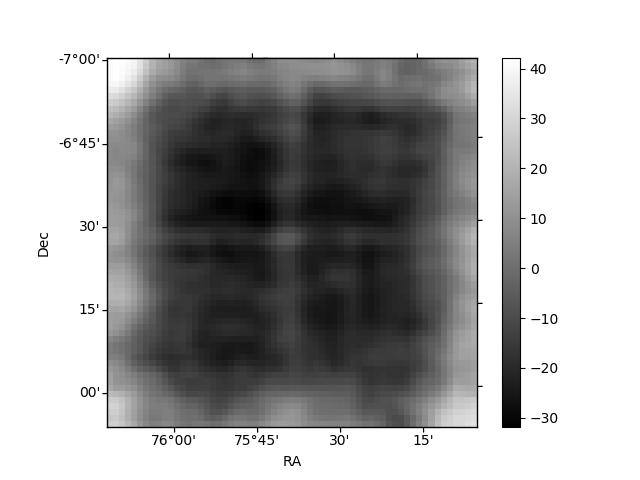
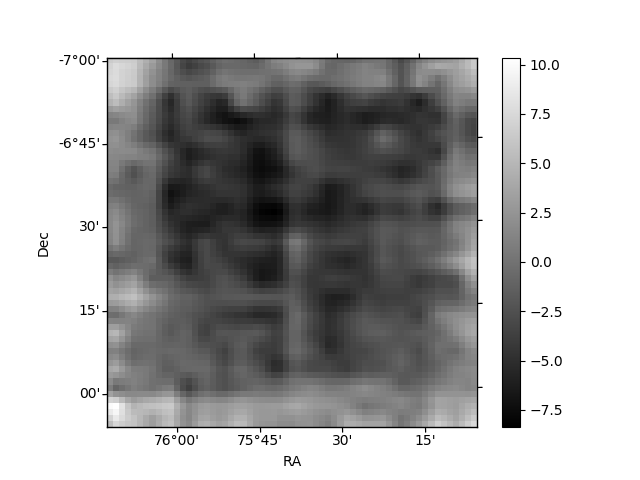
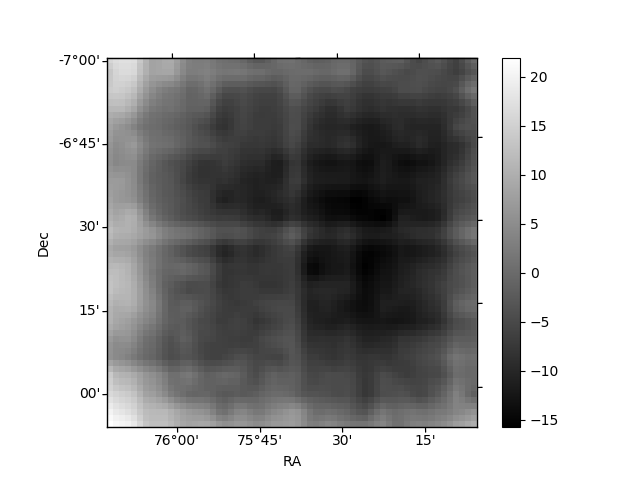
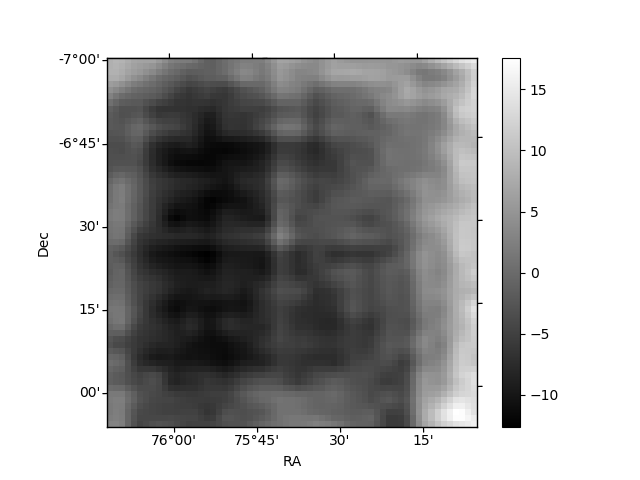
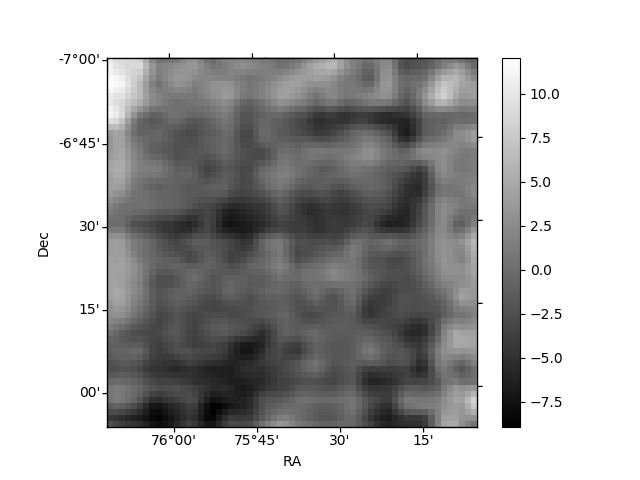
Histogram calculated using DETX and DETY for each event in the final _common_clean file
| Quadrant A | 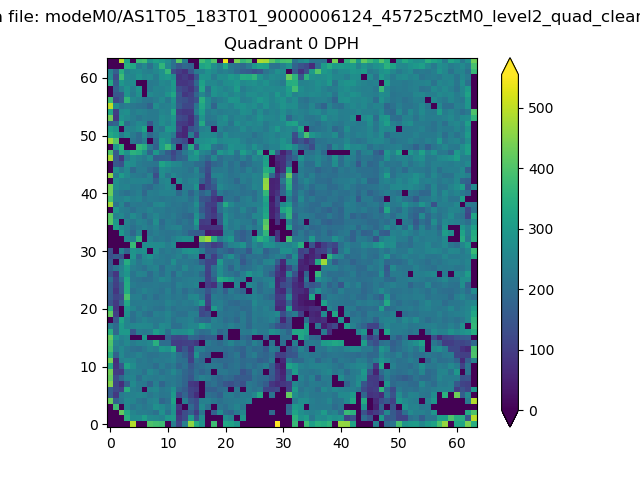 |
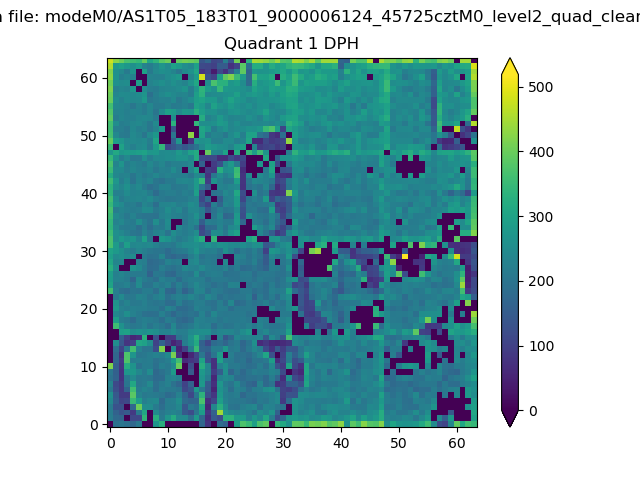 |
Quadrant B |
|---|---|---|---|
| Quadrant D | 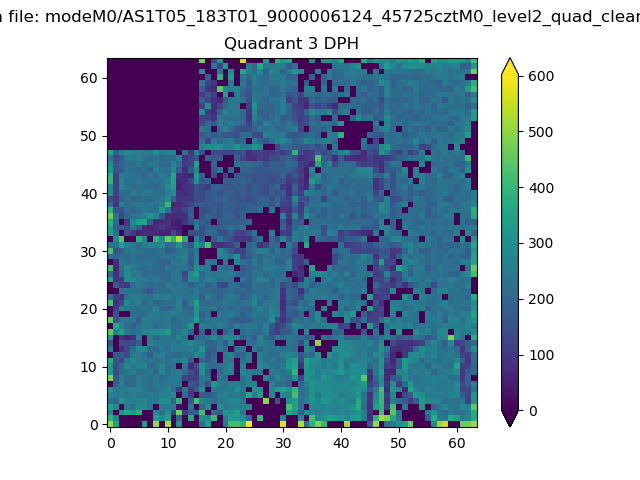 |
 |
Quadrant C |
| Plot type | Count rate plots | Images |
|---|---|---|
| Comparison with Poisson distribution Blue bars denote a histogram of data divided into 1 sec bins. Red curve is a Poisson curve with rate = median count rate of data. |
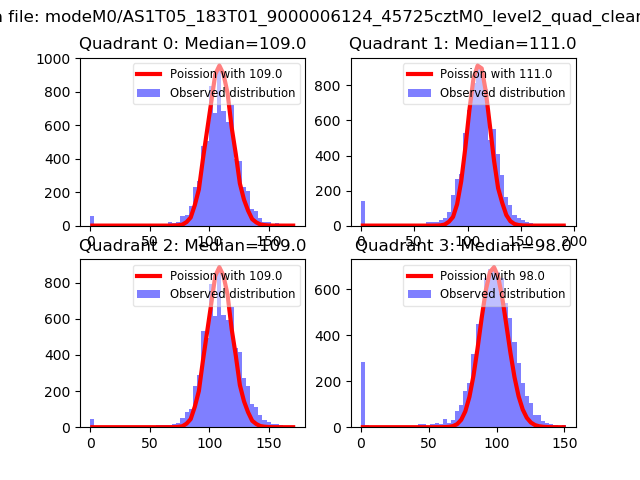 |
 |
| Quadrant-wise count rates Data is divided into 100 sec bins |
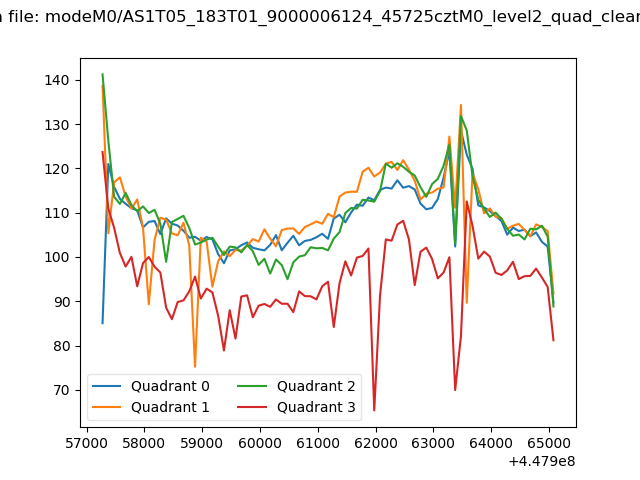 |
|
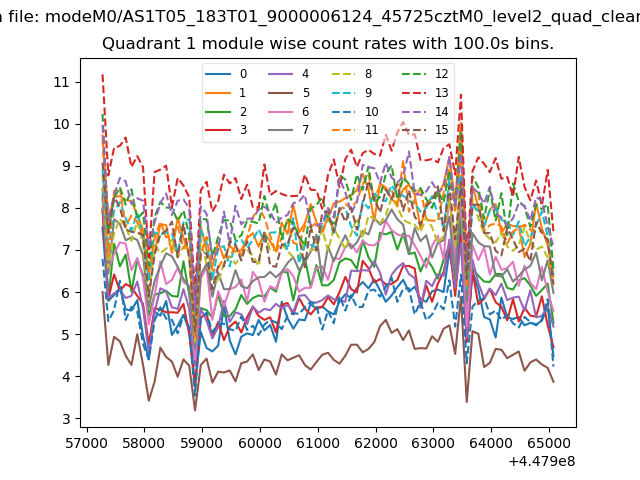
| Module-wise count rates for Quadrant A Data is divided into 100 sec bins |
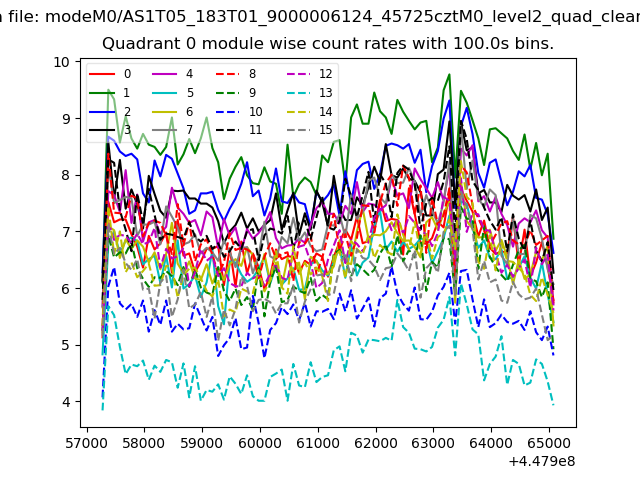 |
 |
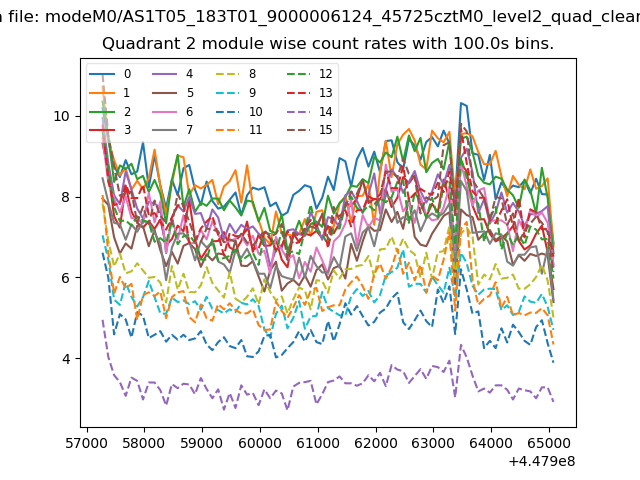
| Module-wise count rates for Quadrant B Data is divided into 100 sec bins |
 |
 |
| Module-wise count rates for Quadrant C Data is divided into 100 sec bins |
 |
 |
| Module-wise count rates for Quadrant D Data is divided into 100 sec bins |
 |
 |
| Parameter | Plot |
|---|---|
| CZT HV Monitor | 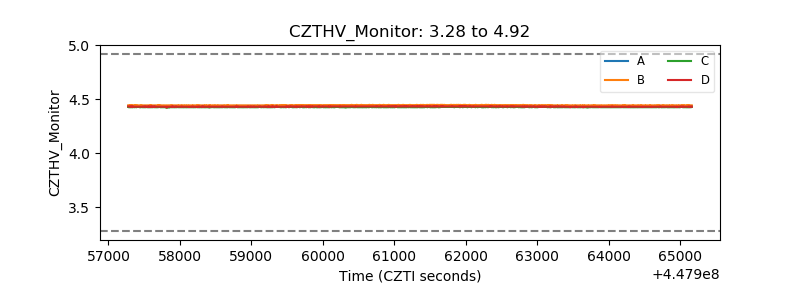 |
| D_VDD | 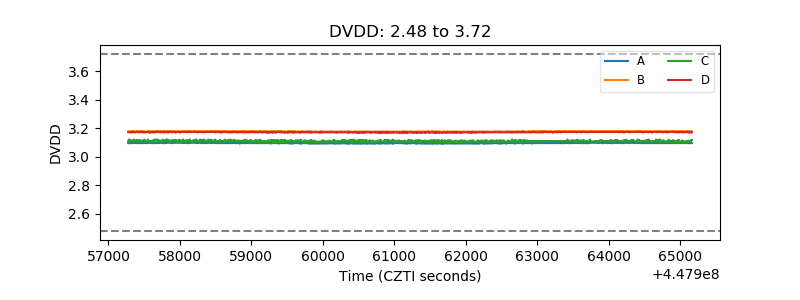 |
| Temperature 1 | 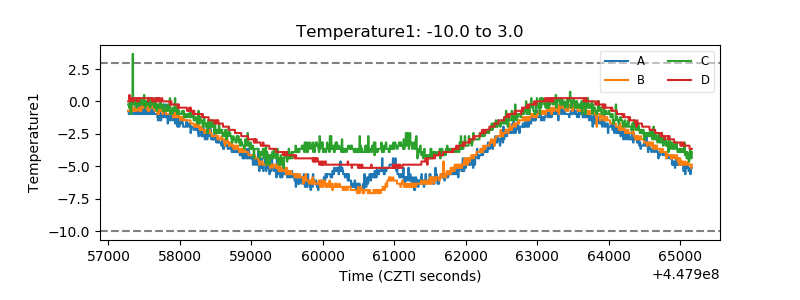 |
| Veto HV Monitor | 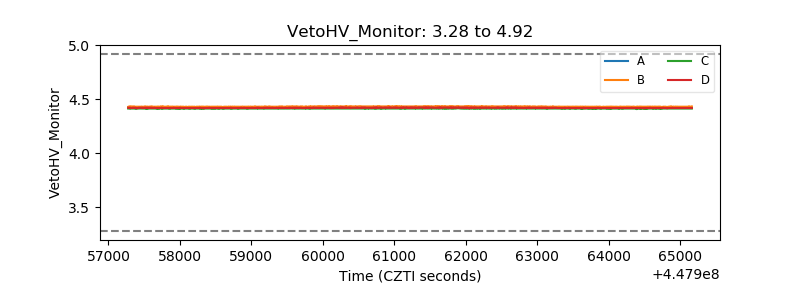 |
| Veto LLD | 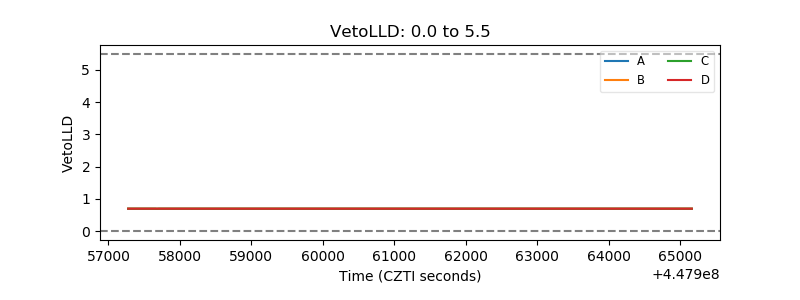 |
| Alpha Counter | 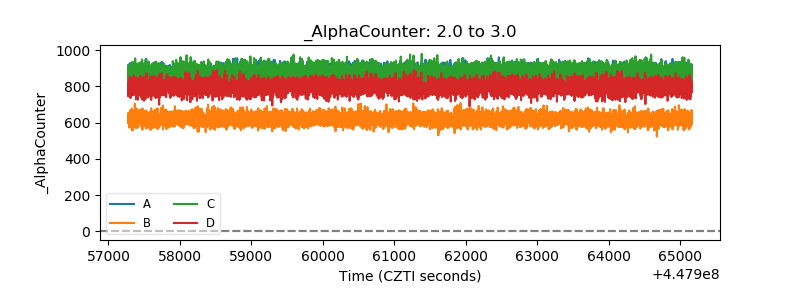 |
| _CPM_Rate | 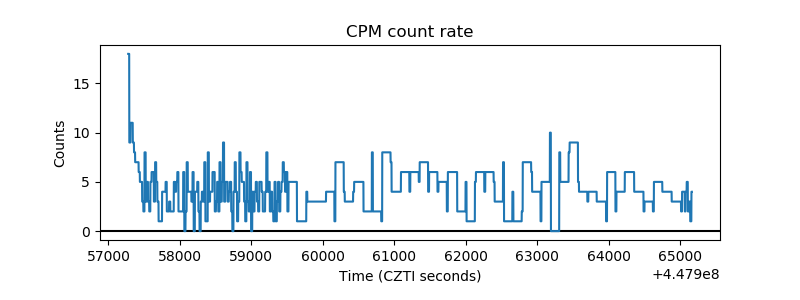 |
| CZT Counter | 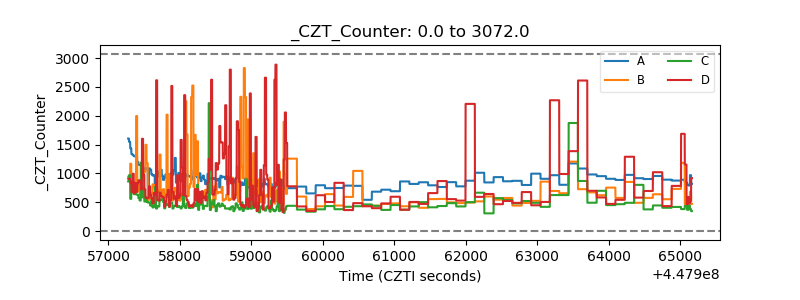 |
| +2.5 Volts monitor | 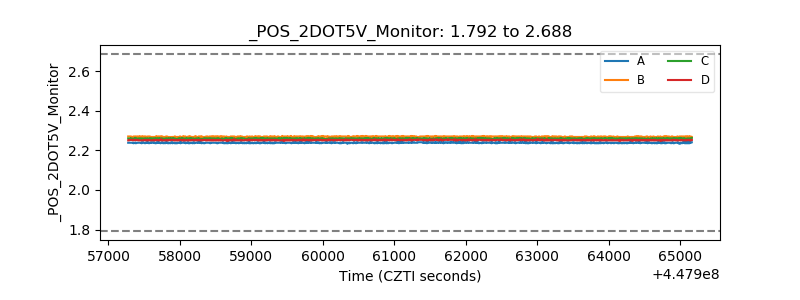 |
| +5 Volts monitor | 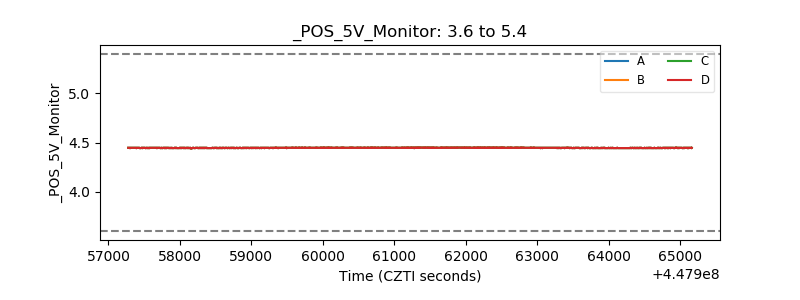 |
| _ROLL_ROT | 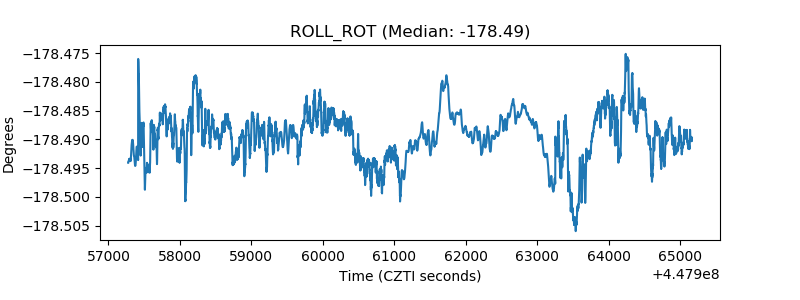 |
| _Roll_DEC | 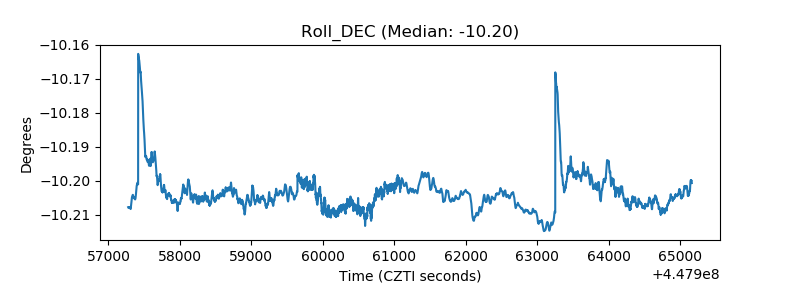 |
| _Roll_RA | 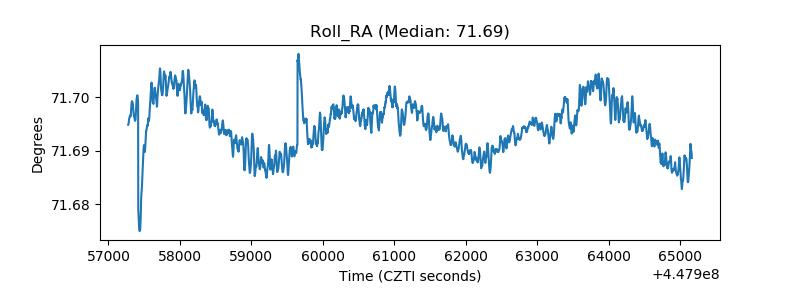 |
| Veto Counter |  |