| Param | Original file | Final file |
|---|---|---|
| Filename | modeM0/AS1T05_183T01_9000006124_45726cztM0_level2.fits | modeM0/AS1T05_183T01_9000006124_45726cztM0_level2_quad_clean.evt |
| Size (bytes) | 584,907,840 | 127,707,840 |
| Size | 557.8 MB | 121.8 MB |
| Events in quadrant A | 7,055,294 | 849,646 |
| Events in quadrant B | 4,999,310 | 857,241 |
| Events in quadrant C | 3,838,668 | 852,344 |
| Events in quadrant D | 5,142,949 | 755,006 |
| Mode SS | |||
|---|---|---|---|
| Quadrant | BADHDUFLAG | Total packets | Discarded packets |
| A | 0 | 160 | 0 |
| B | 0 | 160 | 0 |
| C | 0 | 160 | 0 |
| D | 0 | 160 | 0 |
| Mode M0 | |||
|---|---|---|---|
| Quadrant | BADHDUFLAG | Total packets | Discarded packets |
| A | 0 | 26299 | 0 |
| B | 0 | 20142 | 0 |
| C | 0 | 17138 | 0 |
| D | 0 | 20831 | 0 |
| Quadrant | Total seconds | Saturated seconds | Saturation percentage |
|---|---|---|---|
| A | 7940 | 104 | 1.309824% |
| B | 7940 | 194 | 2.443325% |
| C | 7940 | 57 | 0.717884% |
| D | 7941 | 286 | 3.601562% |
Noise dominated data is calculated using 1-second bins in cleaned event files. If a bin has >2000 counts, and if more than 50% of those come from <1% of pixels, then it is considered to be noise-dominated and hence unusable.
| Quadrant | # 1 sec bins | Bins with >0 counts | Bins with >2000 counts | High rate bins dominated by noise | Noise dominated (total time) | Noise dominated (detector-on time) | Marked lightcurve |
|---|---|---|---|---|---|---|---|
| A | 7940 | 7940 | 20 | 20 | 0.25% | 0.25% | 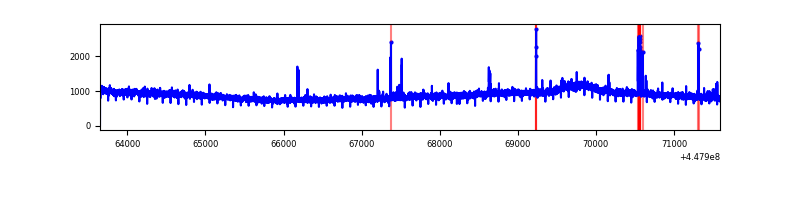 |
| B | 7940 | 7940 | 71 | 71 | 0.89% | 0.89% | 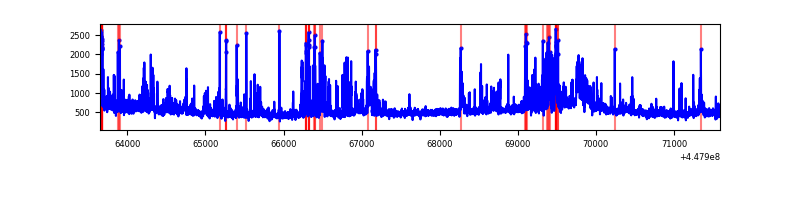 |
| C | 7940 | 7940 | 54 | 54 | 0.68% | 0.68% | 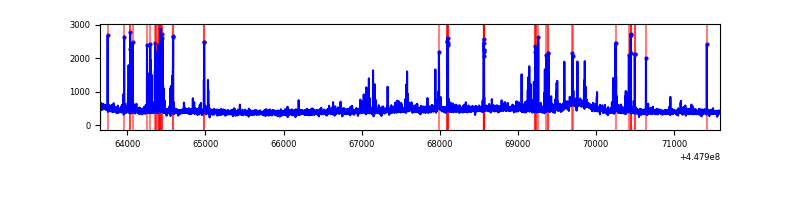 |
| D | 7941 | 7941 | 228 | 228 | 2.87% | 2.87% | 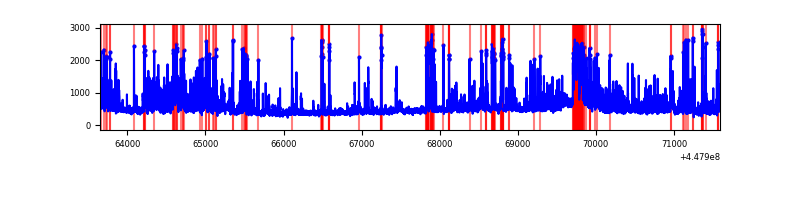 |
Top three noisy pixels from each quadrant. If the there are fewer than three noisy pixels in the level2.evt file, extra rows are filled as -1
| Pixel properties | Quadrant properties | ||||||
|---|---|---|---|---|---|---|---|
| Quadrant | DetID | PixID | Counts | Sigma | Mean | Median | Sigma |
| A | 10 | 83 | 3472353 | 18538.95 | 892 | 871 | 187.3 |
| A | 13 | 248 | 81568 | 430.95 | 892 | 871 | 187.3 |
| A | 14 | 235 | 17690 | 89.82 | 892 | 871 | 187.3 |
| B | 3 | 112 | 868378 | 5003.34 | 885 | 859 | 173.4 |
| B | 4 | 171 | 206909 | 1188.37 | 885 | 859 | 173.4 |
| B | 5 | 172 | 89322 | 510.2 | 885 | 859 | 173.4 |
| C | 14 | 254 | 214909 | 1039.46 | 876 | 884 | 205.9 |
| C | 2 | 14 | 91218 | 438.73 | 876 | 884 | 205.9 |
| C | 12 | 2 | 36944 | 175.13 | 876 | 884 | 205.9 |
| D | 1 | 52 | 487311 | 2230.64 | 862 | 838 | 218.1 |
| D | 2 | 249 | 480350 | 2198.72 | 862 | 838 | 218.1 |
| D | 13 | 249 | 343202 | 1569.85 | 862 | 838 | 218.1 |
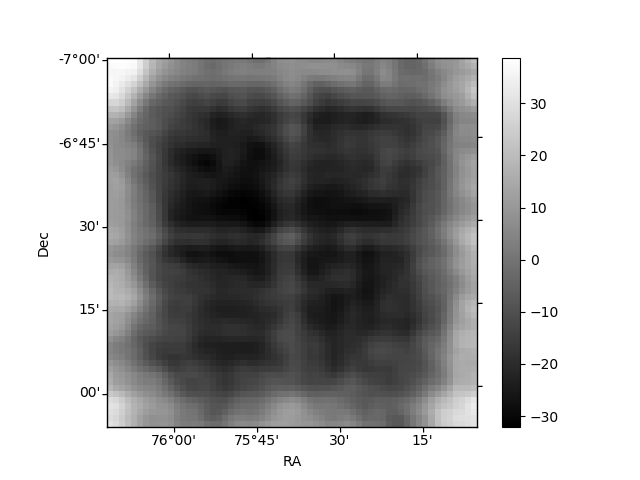
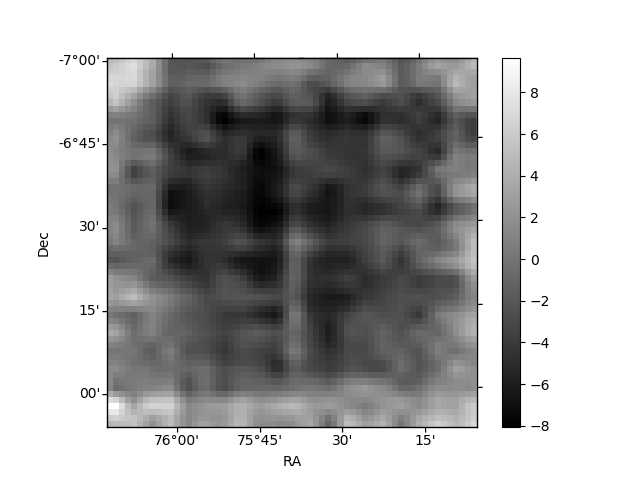
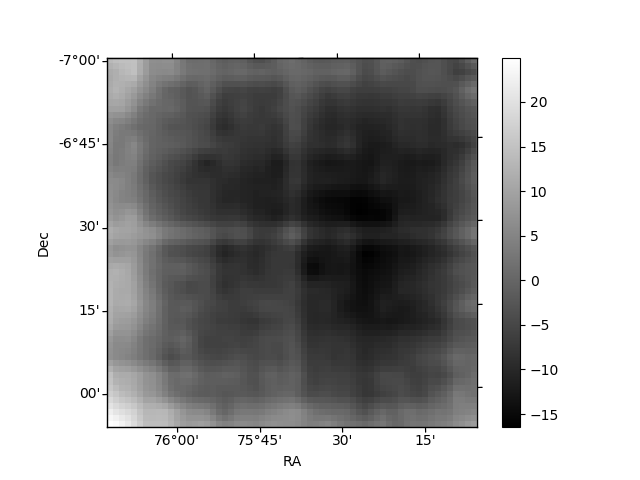
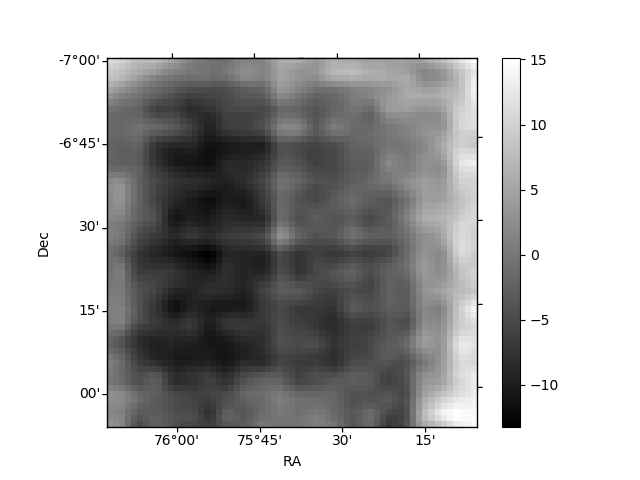
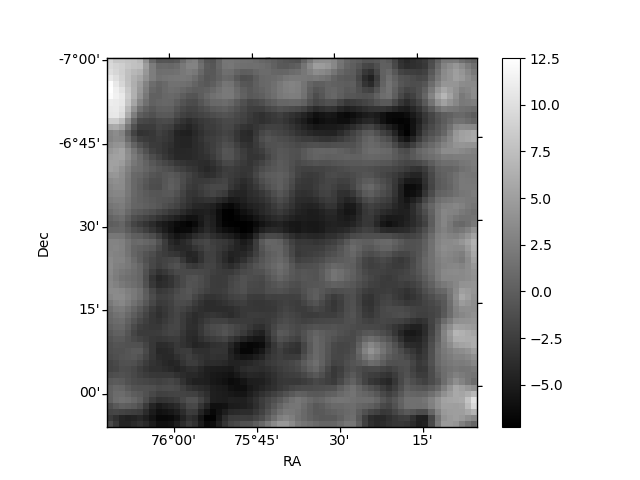
Histogram calculated using DETX and DETY for each event in the final _common_clean file
| Quadrant A | 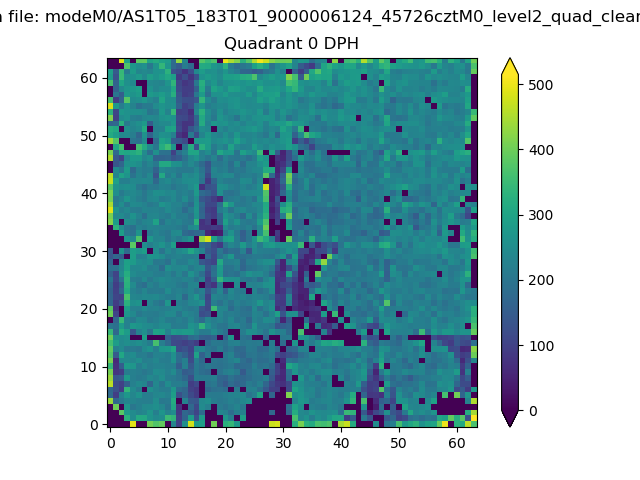 |
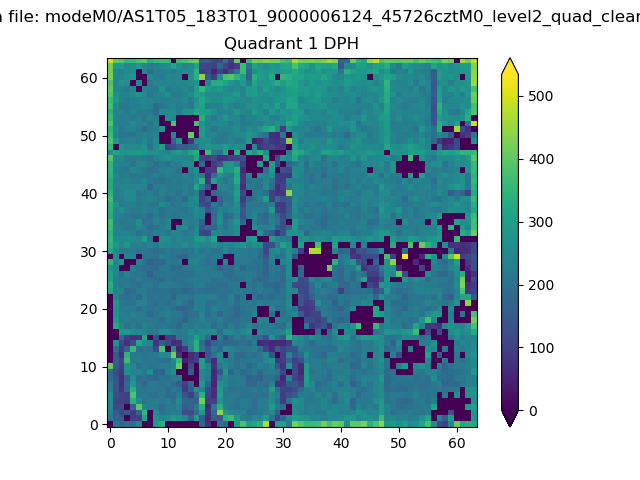 |
Quadrant B |
|---|---|---|---|
| Quadrant D | 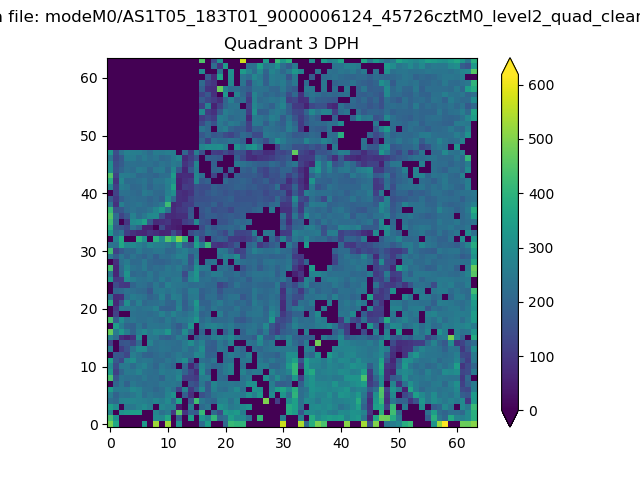 |
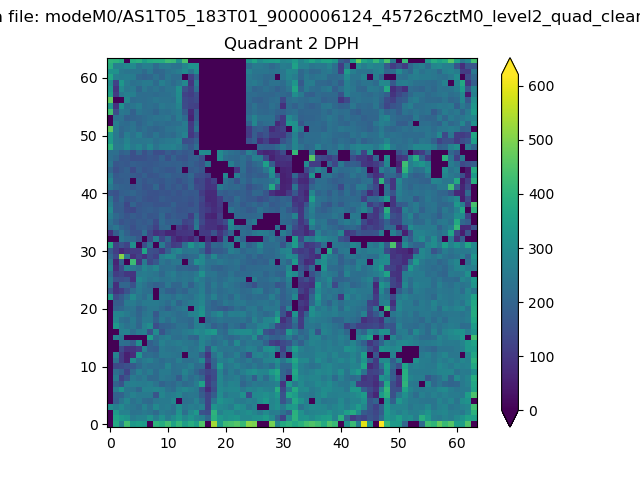 |
Quadrant C |
| Plot type | Count rate plots | Images |
|---|---|---|
| Comparison with Poisson distribution Blue bars denote a histogram of data divided into 1 sec bins. Red curve is a Poisson curve with rate = median count rate of data. |
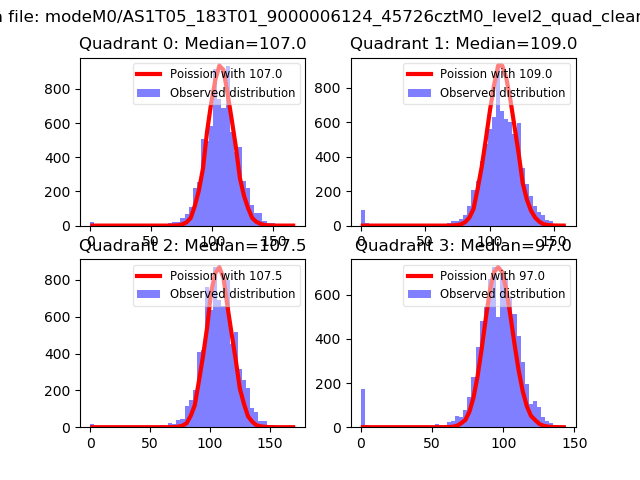 |
 |
| Quadrant-wise count rates Data is divided into 100 sec bins |
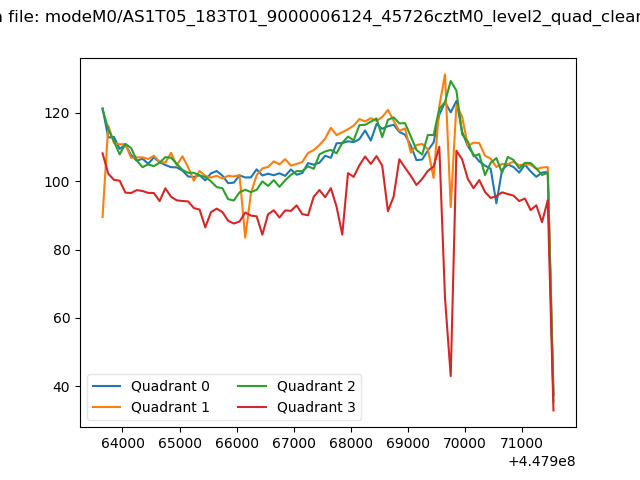 |
|
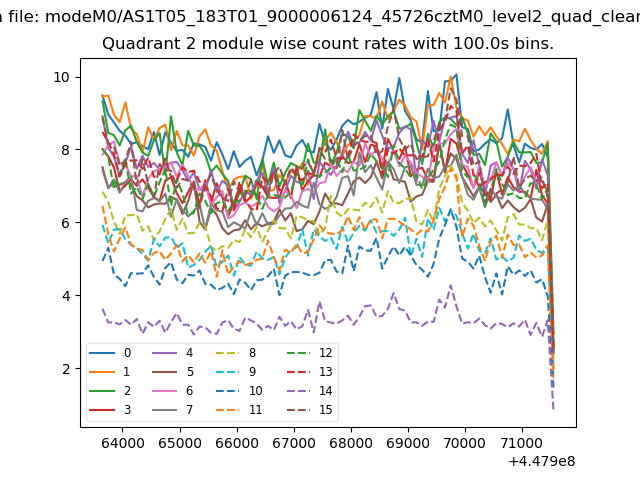
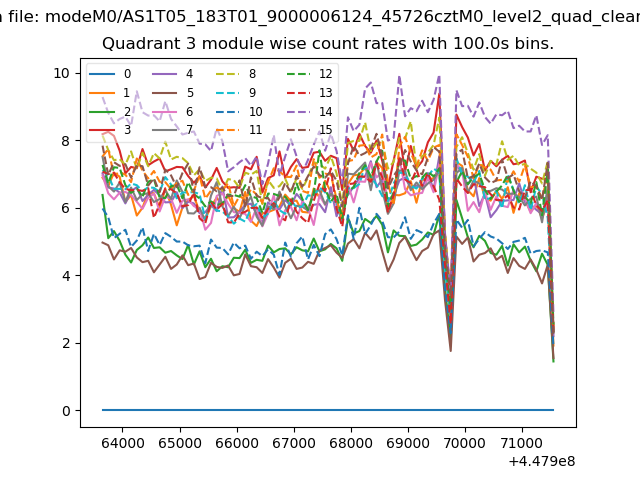
| Module-wise count rates for Quadrant A Data is divided into 100 sec bins |
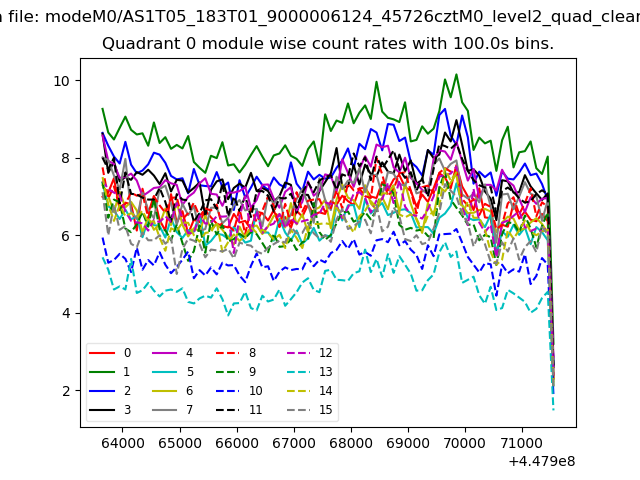 |
 |
| Module-wise count rates for Quadrant B Data is divided into 100 sec bins |
 |
 |
| Module-wise count rates for Quadrant C Data is divided into 100 sec bins |
 |
 |
| Module-wise count rates for Quadrant D Data is divided into 100 sec bins |
 |
 |
| Parameter | Plot |
|---|---|
| CZT HV Monitor | 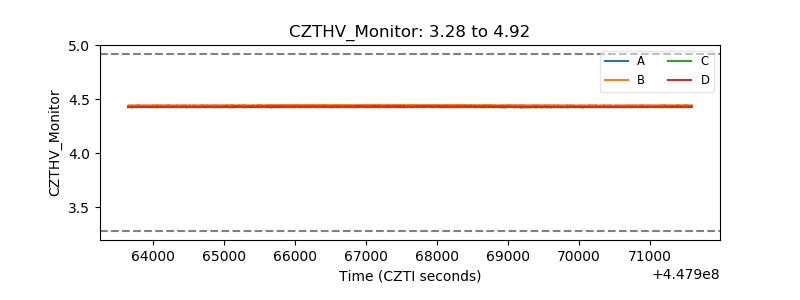 |
| D_VDD | 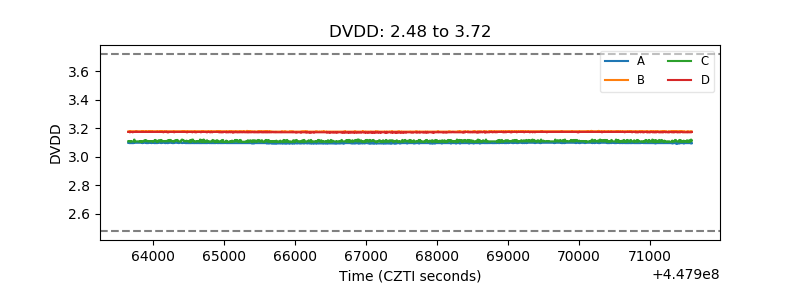 |
| Temperature 1 | 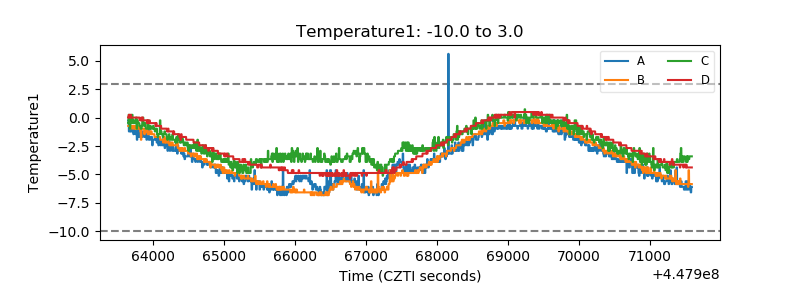 |
| Veto HV Monitor | 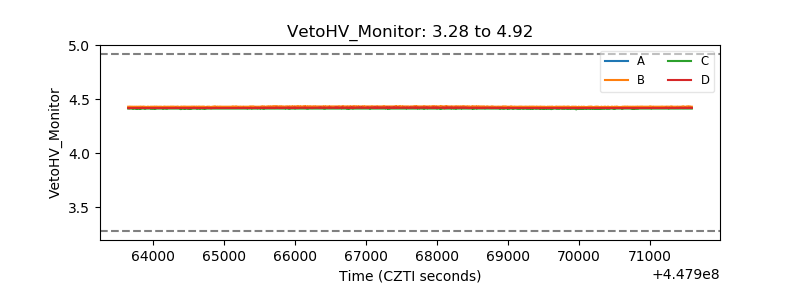 |
| Veto LLD | 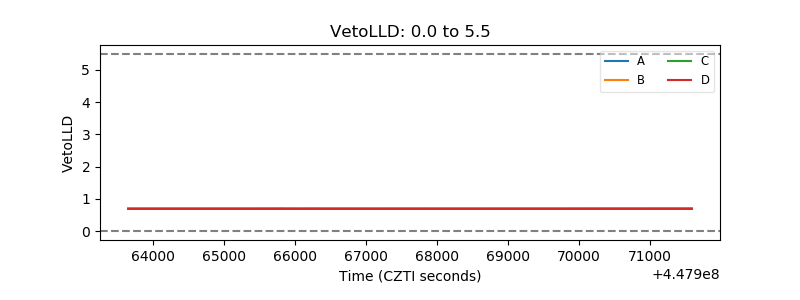 |
| Alpha Counter | 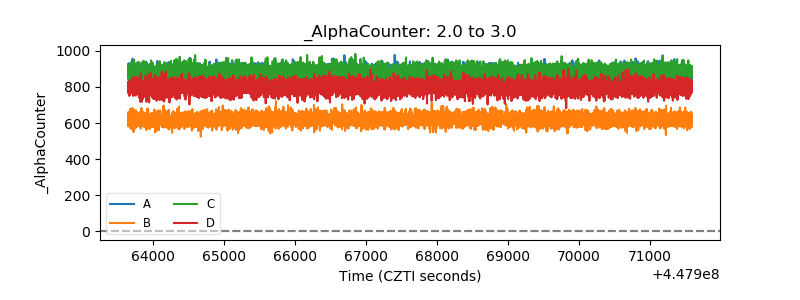 |
| _CPM_Rate | 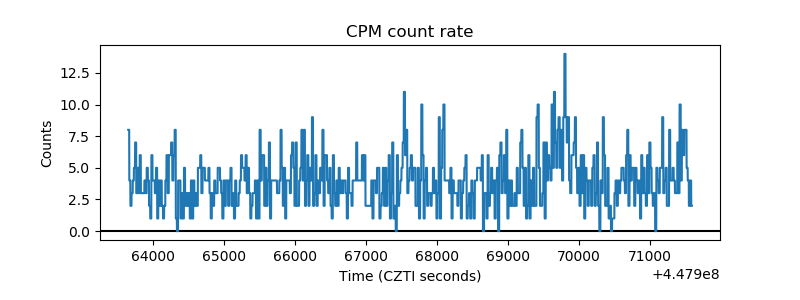 |
| CZT Counter | 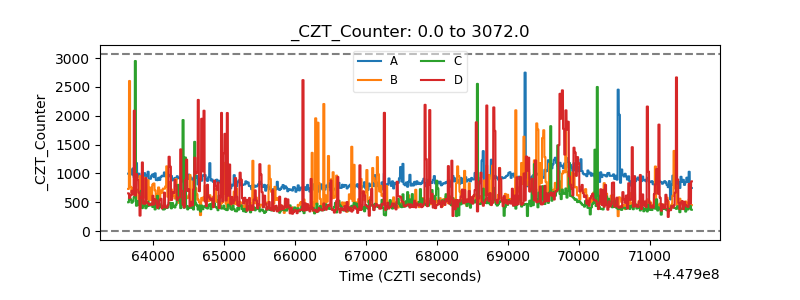 |
| +2.5 Volts monitor | 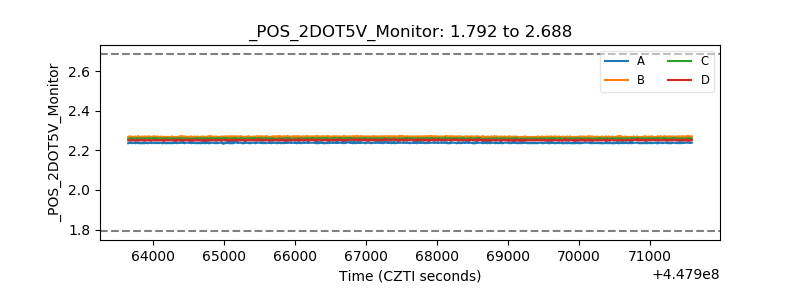 |
| +5 Volts monitor | 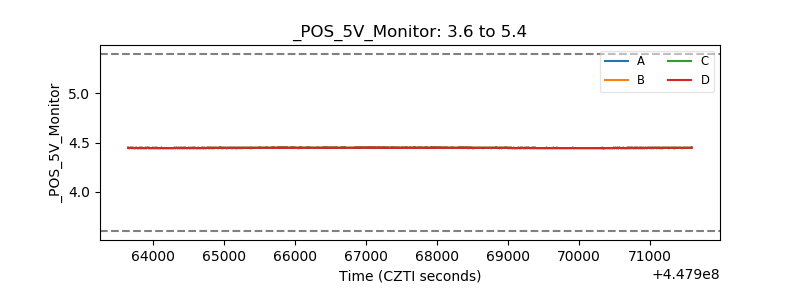 |
| _ROLL_ROT | 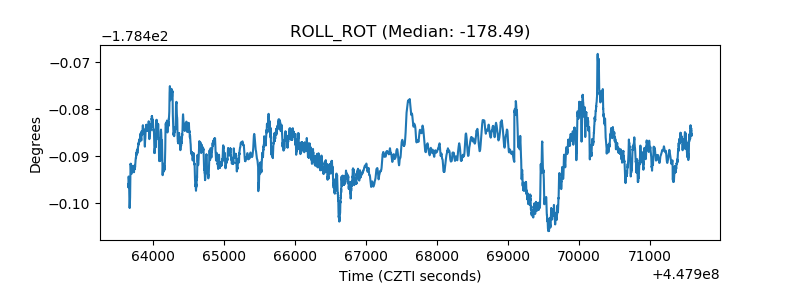 |
| _Roll_DEC | 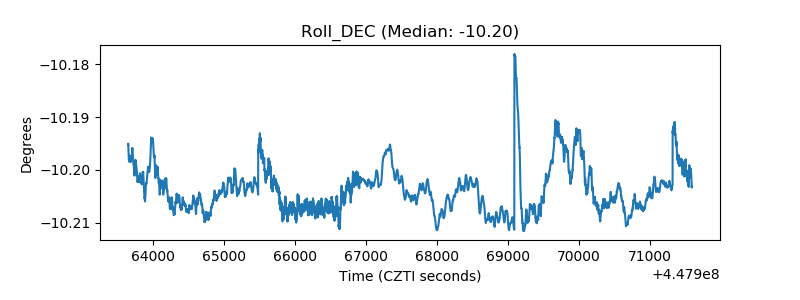 |
| _Roll_RA | 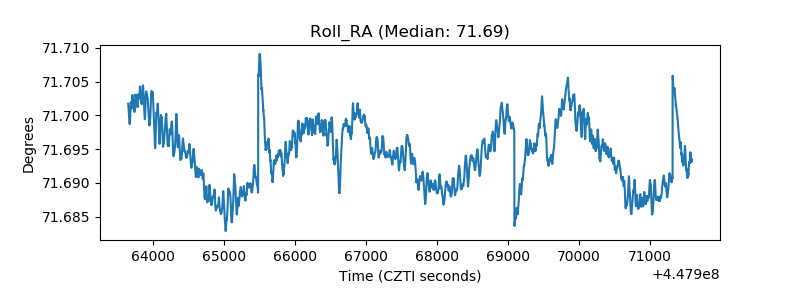 |
| Veto Counter | 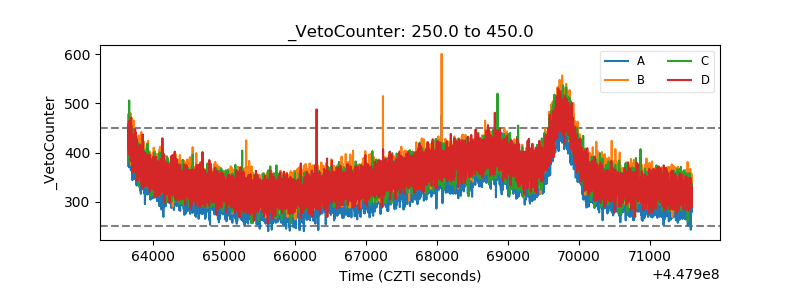 |