| Param | Original file | Final file |
|---|---|---|
| Filename | modeM0/AS1T05_183T01_9000006124_45729cztM0_level2.fits | modeM0/AS1T05_183T01_9000006124_45729cztM0_level2_quad_clean.evt |
| Size (bytes) | 1,465,966,080 | 311,846,400 |
| Size | 1.4 GB | 297.4 MB |
| Events in quadrant A | 17,836,346 | 2,053,511 |
| Events in quadrant B | 12,258,725 | 2,096,403 |
| Events in quadrant C | 9,348,034 | 2,090,380 |
| Events in quadrant D | 13,292,064 | 1,835,271 |
| Mode SS | |||
|---|---|---|---|
| Quadrant | BADHDUFLAG | Total packets | Discarded packets |
| A | 0 | 404 | 0 |
| B | 0 | 404 | 0 |
| C | 0 | 404 | 0 |
| D | 0 | 404 | 0 |
| Mode M0 | |||
|---|---|---|---|
| Quadrant | BADHDUFLAG | Total packets | Discarded packets |
| A | 0 | 66434 | 3 |
| B | 0 | 49604 | 3 |
| C | 0 | 42073 | 4 |
| D | 0 | 53298 | 3 |
| Mode M9 | |||
|---|---|---|---|
| Quadrant | BADHDUFLAG | Total packets | Discarded packets |
| A | 0 | 13 | 0 |
| B | 0 | 13 | 0 |
| C | 0 | 13 | 0 |
| D | 0 | 13 | 0 |
| Quadrant | Total seconds | Saturated seconds | Saturation percentage |
|---|---|---|---|
| A | 19818 | 530 | 2.674336% |
| B | 19818 | 654 | 3.300030% |
| C | 19818 | 190 | 0.958724% |
| D | 19818 | 880 | 4.440408% |
Noise dominated data is calculated using 1-second bins in cleaned event files. If a bin has >2000 counts, and if more than 50% of those come from <1% of pixels, then it is considered to be noise-dominated and hence unusable.
| Quadrant | # 1 sec bins | Bins with >0 counts | Bins with >2000 counts | High rate bins dominated by noise | Noise dominated (total time) | Noise dominated (detector-on time) | Marked lightcurve |
|---|---|---|---|---|---|---|---|
| A | 21178 | 19821 | 86 | 86 | 0.41% | 0.43% | 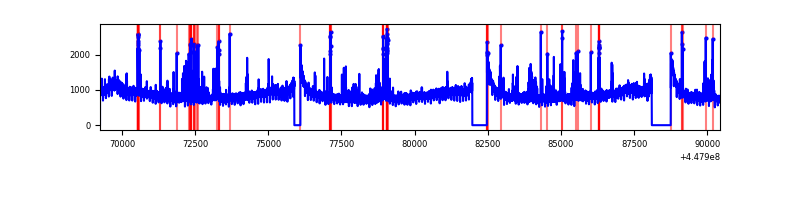 |
| B | 21178 | 19820 | 334 | 334 | 1.58% | 1.69% | 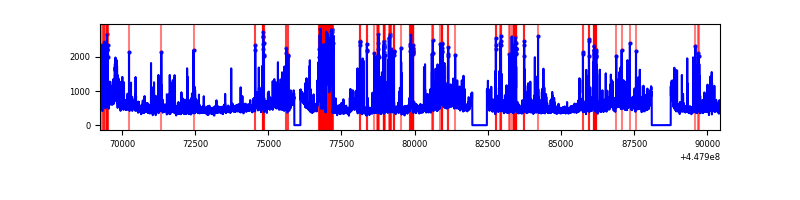 |
| C | 21178 | 19819 | 83 | 83 | 0.39% | 0.42% | 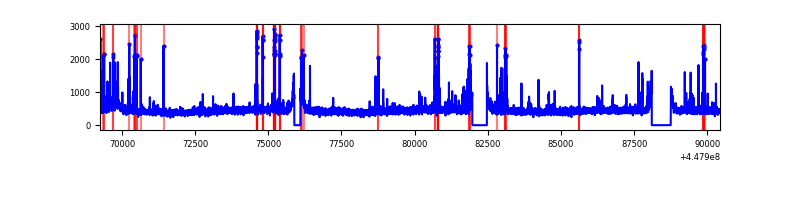 |
| D | 21178 | 19819 | 645 | 645 | 3.05% | 3.25% | 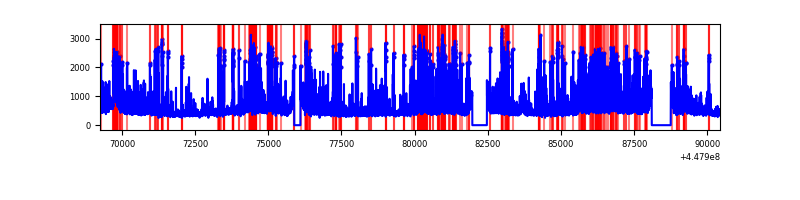 |
Top three noisy pixels from each quadrant. If the there are fewer than three noisy pixels in the level2.evt file, extra rows are filled as -1
| Pixel properties | Quadrant properties | ||||||
|---|---|---|---|---|---|---|---|
| Quadrant | DetID | PixID | Counts | Sigma | Mean | Median | Sigma |
| A | 10 | 83 | 8319495 | 17772.83 | 2239 | 2187 | 468.0 |
| A | 13 | 248 | 471523 | 1002.9 | 2239 | 2187 | 468.0 |
| A | 14 | 235 | 262583 | 556.43 | 2239 | 2187 | 468.0 |
| B | 3 | 112 | 1506800 | 3416.21 | 2240 | 2166 | 440.4 |
| B | 15 | 201 | 771694 | 1747.18 | 2240 | 2166 | 440.4 |
| B | 4 | 171 | 265033 | 596.83 | 2240 | 2166 | 440.4 |
| C | 14 | 254 | 348525 | 665.12 | 2217 | 2233 | 520.6 |
| C | 12 | 2 | 141404 | 267.31 | 2217 | 2233 | 520.6 |
| C | 3 | 233 | 103983 | 195.43 | 2217 | 2233 | 520.6 |
| D | 1 | 52 | 2660908 | 4862.13 | 2174 | 2108 | 546.8 |
| D | 13 | 249 | 1070870 | 1954.44 | 2174 | 2108 | 546.8 |
| D | 2 | 249 | 535786 | 975.93 | 2174 | 2108 | 546.8 |
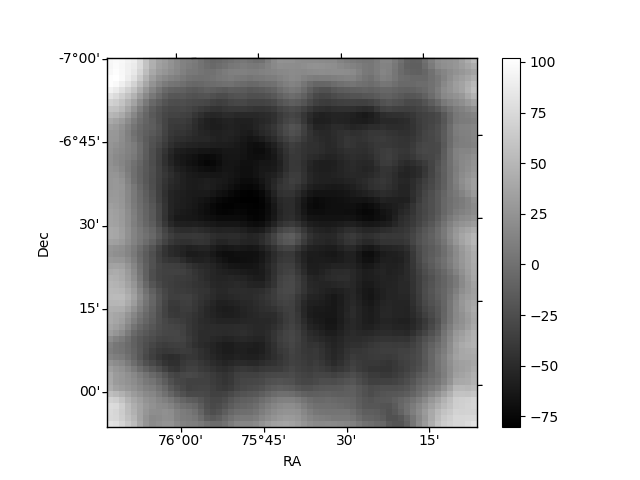
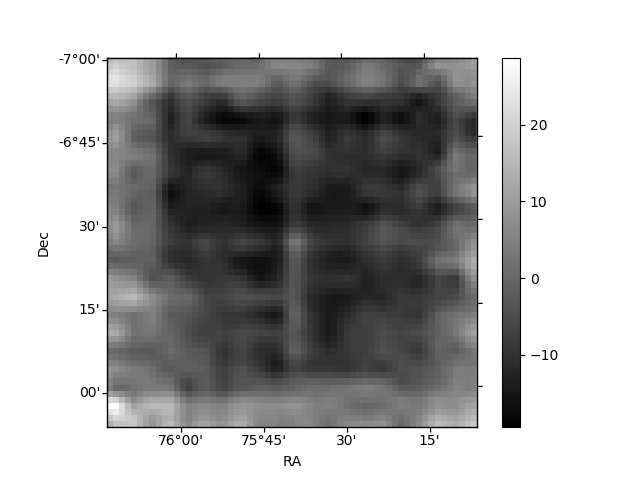
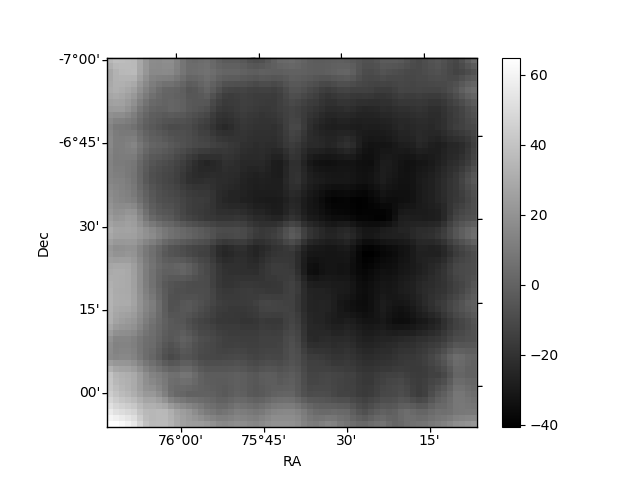
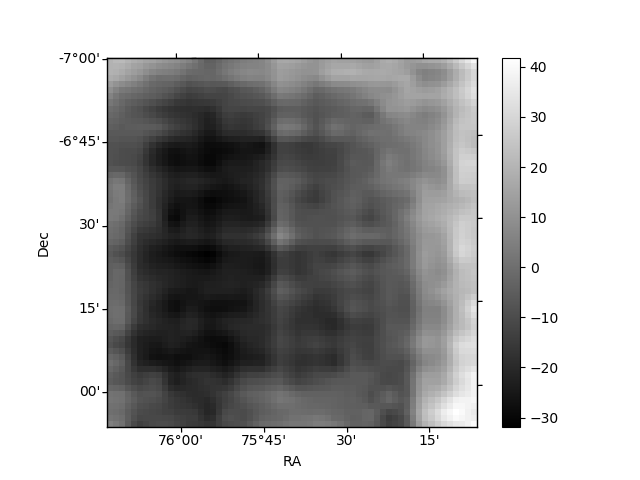
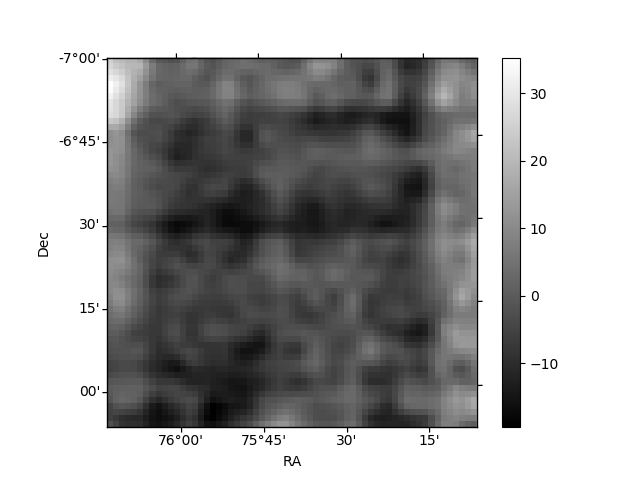
Histogram calculated using DETX and DETY for each event in the final _common_clean file
| Quadrant A | 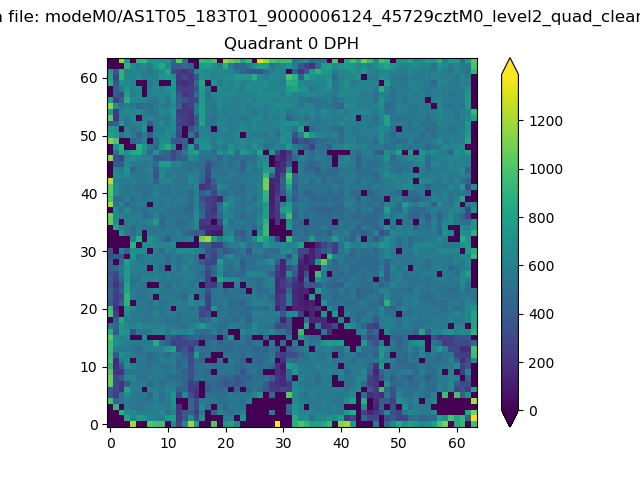 |
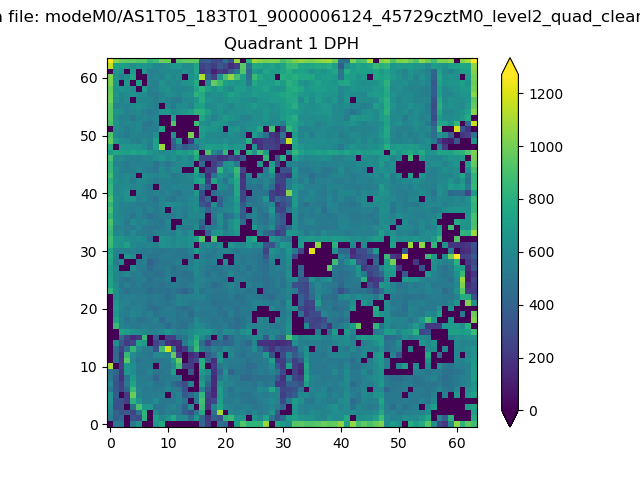 |
Quadrant B |
|---|---|---|---|
| Quadrant D | 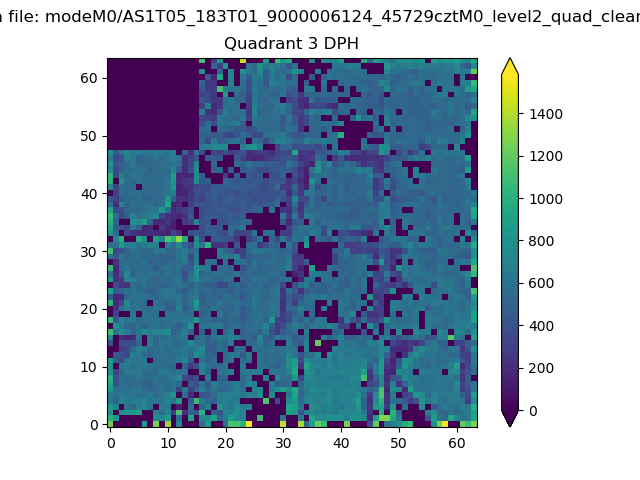 |
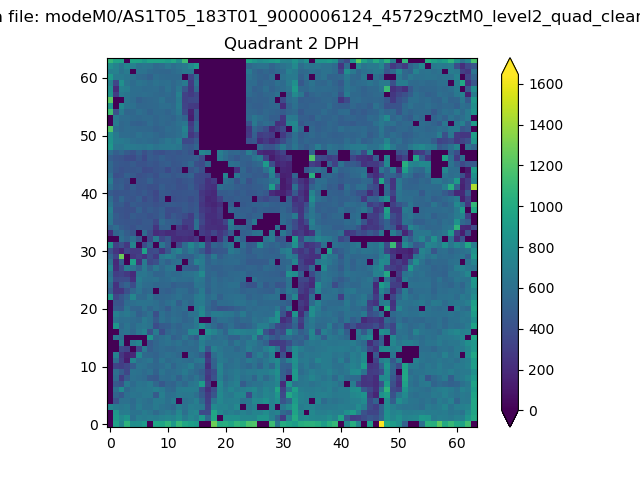 |
Quadrant C |
| Plot type | Count rate plots | Images |
|---|---|---|
| Comparison with Poisson distribution Blue bars denote a histogram of data divided into 1 sec bins. Red curve is a Poisson curve with rate = median count rate of data. |
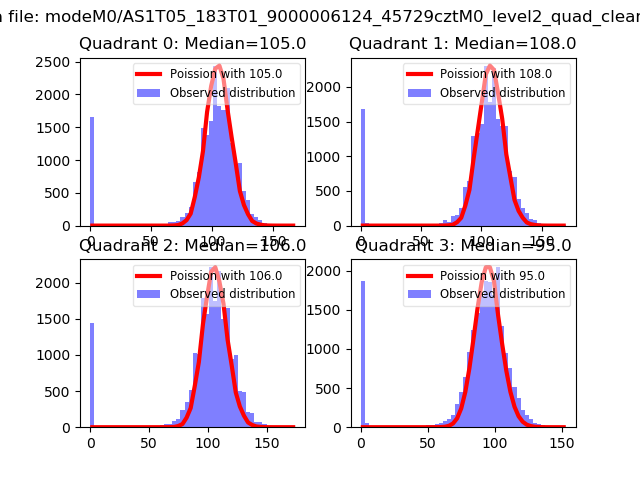 |
 |
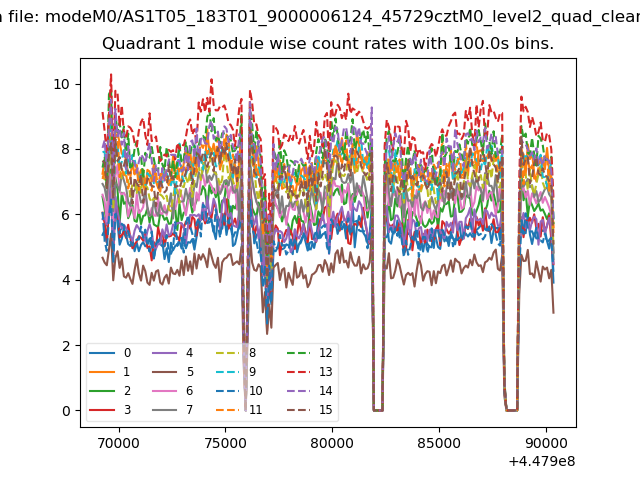
| Quadrant-wise count rates Data is divided into 100 sec bins |
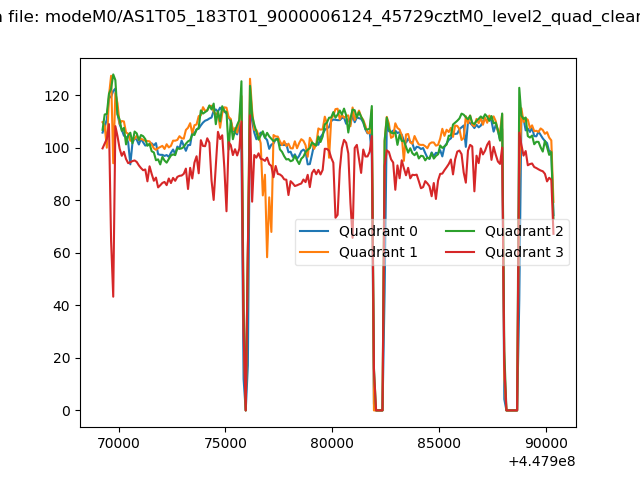 |
|
| Module-wise count rates for Quadrant A Data is divided into 100 sec bins |
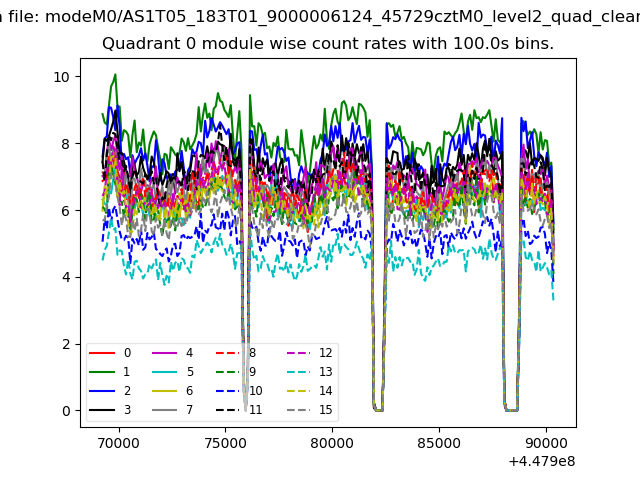 |
 |
| Module-wise count rates for Quadrant B Data is divided into 100 sec bins |
 |
 |
| Module-wise count rates for Quadrant C Data is divided into 100 sec bins |
 |
 |
| Module-wise count rates for Quadrant D Data is divided into 100 sec bins |
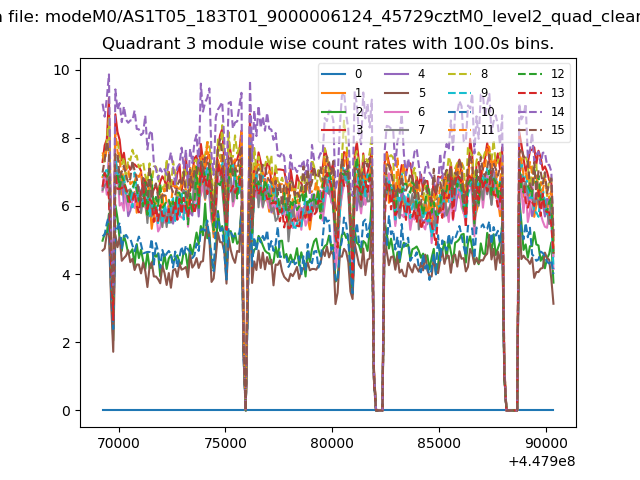 |
 |
| Parameter | Plot |
|---|---|
| CZT HV Monitor |  |
| D_VDD | 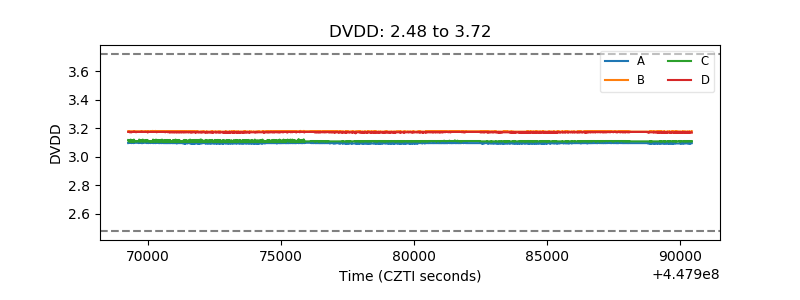 |
| Temperature 1 | 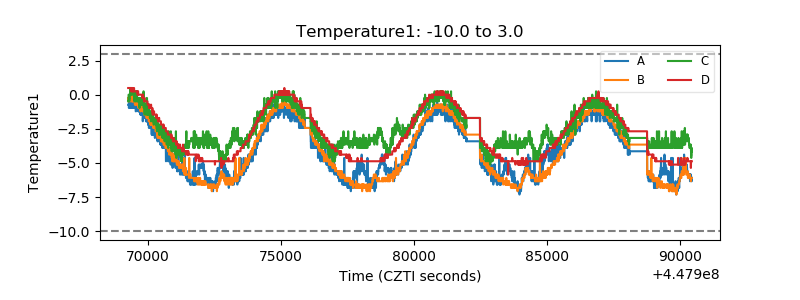 |
| Veto HV Monitor | 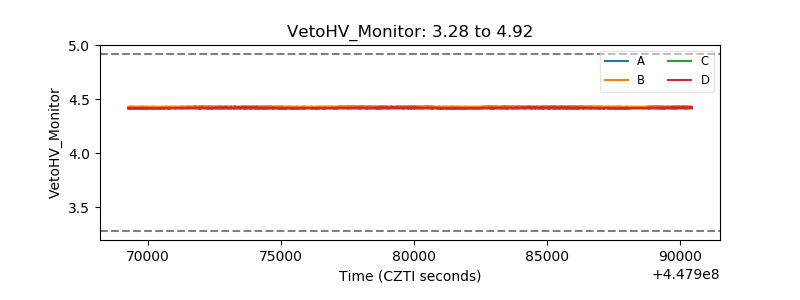 |
| Veto LLD | 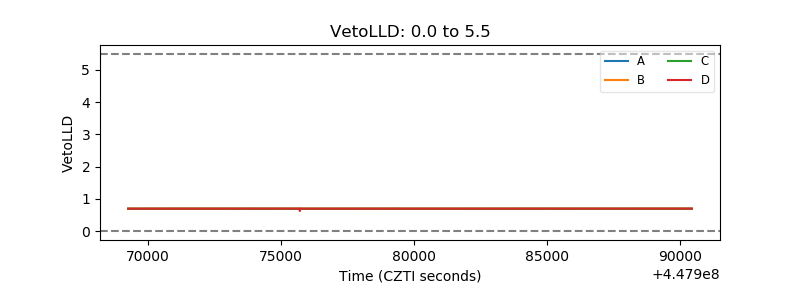 |
| Alpha Counter | 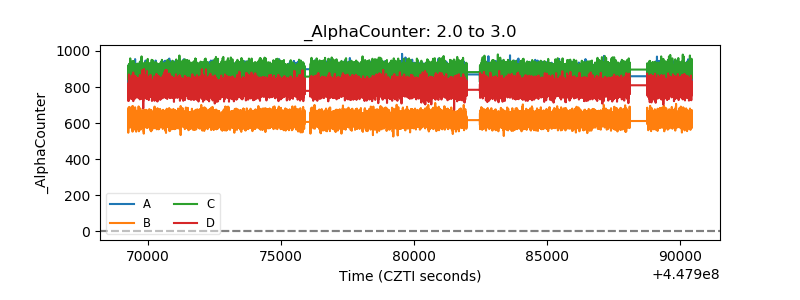 |
| _CPM_Rate | 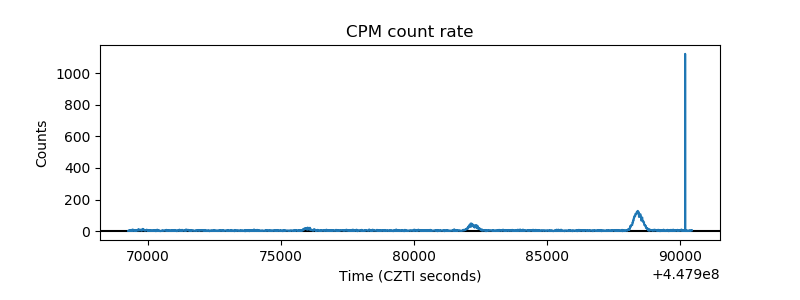 |
| CZT Counter | 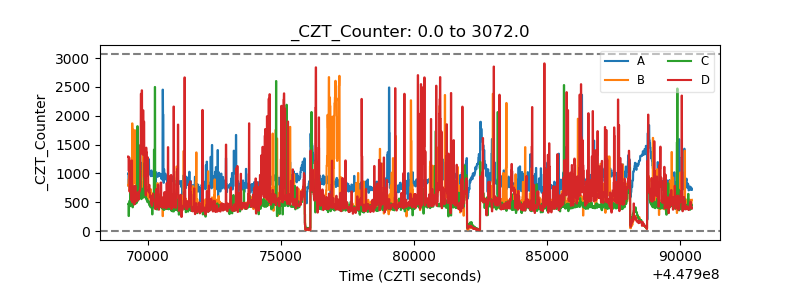 |
| +2.5 Volts monitor | 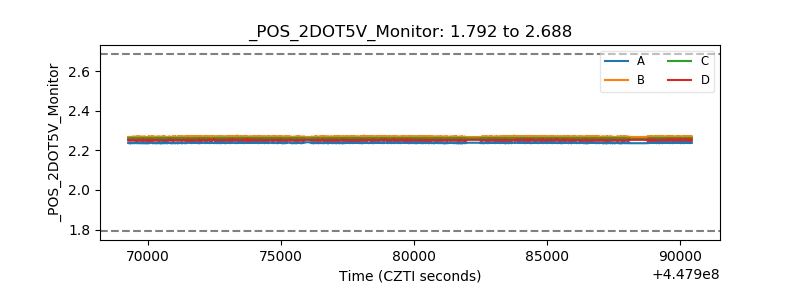 |
| +5 Volts monitor | 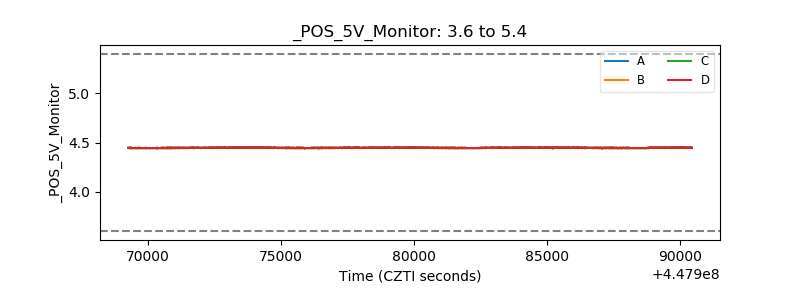 |
| _ROLL_ROT | 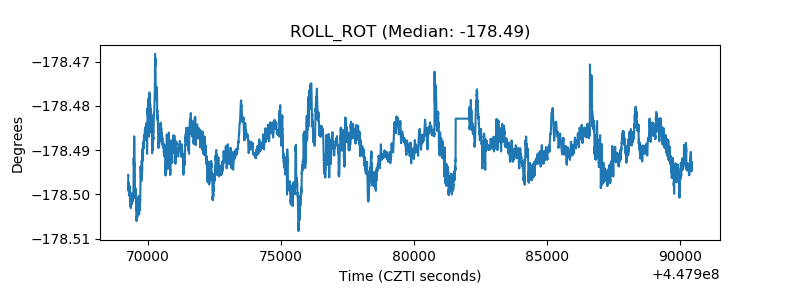 |
| _Roll_DEC | 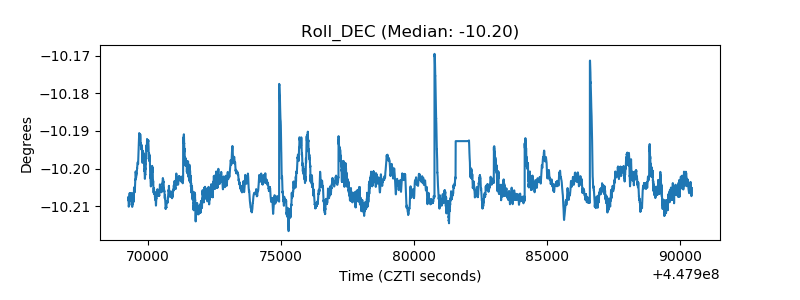 |
| _Roll_RA | 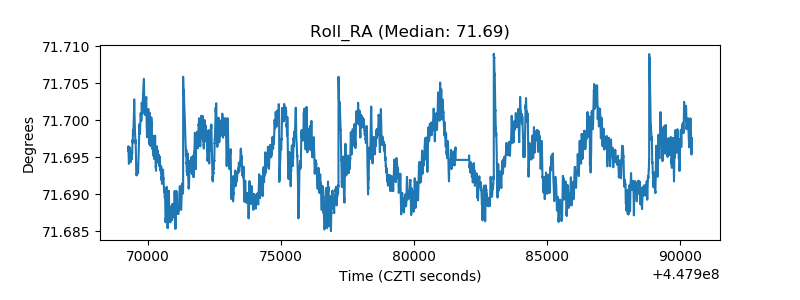 |
| Veto Counter | 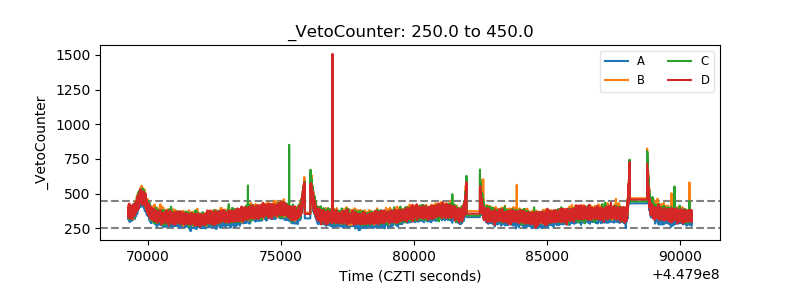 |