| Param | Original file | Final file |
|---|---|---|
| Filename | modeM0/AS1T05_183T01_9000006124_45730cztM0_level2.fits | modeM0/AS1T05_183T01_9000006124_45730cztM0_level2_quad_clean.evt |
| Size (bytes) | 498,579,840 | 103,492,800 |
| Size | 475.5 MB | 98.7 MB |
| Events in quadrant A | 5,639,673 | 686,665 |
| Events in quadrant B | 3,879,750 | 702,172 |
| Events in quadrant C | 3,100,287 | 693,186 |
| Events in quadrant D | 5,329,989 | 596,034 |
| Mode SS | |||
|---|---|---|---|
| Quadrant | BADHDUFLAG | Total packets | Discarded packets |
| A | 0 | 134 | 0 |
| B | 0 | 134 | 0 |
| C | 0 | 134 | 0 |
| D | 0 | 134 | 0 |
| Mode M0 | |||
|---|---|---|---|
| Quadrant | BADHDUFLAG | Total packets | Discarded packets |
| A | 0 | 20911 | 2 |
| B | 0 | 15715 | 1 |
| C | 0 | 13791 | 1 |
| D | 0 | 20276 | 1 |
| Mode M9 | |||
|---|---|---|---|
| Quadrant | BADHDUFLAG | Total packets | Discarded packets |
| A | 0 | 8 | 0 |
| B | 0 | 8 | 0 |
| C | 0 | 8 | 0 |
| D | 0 | 8 | 0 |
| Quadrant | Total seconds | Saturated seconds | Saturation percentage |
|---|---|---|---|
| A | 6526 | 130 | 1.992032% |
| B | 6526 | 203 | 3.110634% |
| C | 6527 | 72 | 1.103110% |
| D | 6527 | 459 | 7.032327% |
Noise dominated data is calculated using 1-second bins in cleaned event files. If a bin has >2000 counts, and if more than 50% of those come from <1% of pixels, then it is considered to be noise-dominated and hence unusable.
| Quadrant | # 1 sec bins | Bins with >0 counts | Bins with >2000 counts | High rate bins dominated by noise | Noise dominated (total time) | Noise dominated (detector-on time) | Marked lightcurve |
|---|---|---|---|---|---|---|---|
| A | 7361 | 6527 | 7 | 7 | 0.10% | 0.11% | 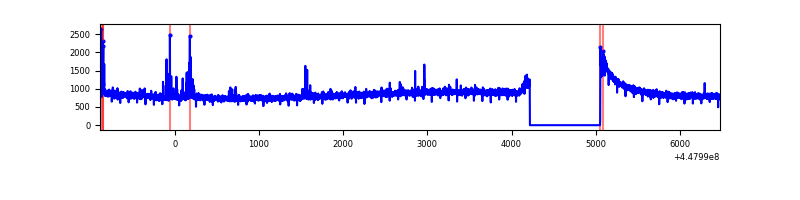 |
| B | 7361 | 6527 | 86 | 86 | 1.17% | 1.32% | 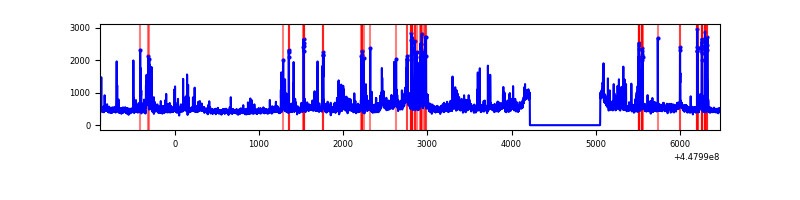 |
| C | 7362 | 6528 | 22 | 22 | 0.30% | 0.34% | 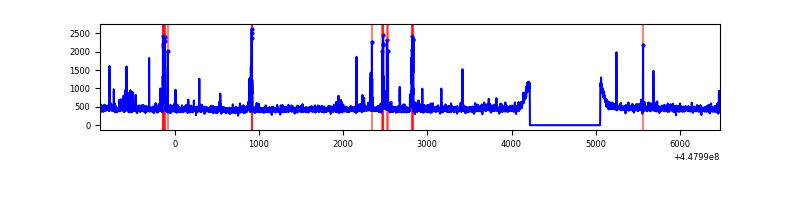 |
| D | 7362 | 6528 | 398 | 398 | 5.41% | 6.10% | 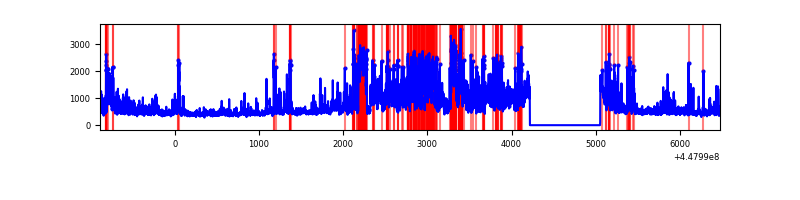 |
Top three noisy pixels from each quadrant. If the there are fewer than three noisy pixels in the level2.evt file, extra rows are filled as -1
| Pixel properties | Quadrant properties | ||||||
|---|---|---|---|---|---|---|---|
| Quadrant | DetID | PixID | Counts | Sigma | Mean | Median | Sigma |
| A | 10 | 83 | 2707422 | 17608.84 | 734 | 719 | 153.7 |
| A | 13 | 248 | 72972 | 470.05 | 734 | 719 | 153.7 |
| A | 13 | 254 | 10553 | 63.98 | 734 | 719 | 153.7 |
| B | 3 | 112 | 389159 | 2650.19 | 735 | 712 | 146.6 |
| B | 5 | 172 | 329157 | 2240.83 | 735 | 712 | 146.6 |
| B | 0 | 189 | 146414 | 994.06 | 735 | 712 | 146.6 |
| C | 14 | 254 | 161131 | 927.52 | 731 | 735 | 172.9 |
| C | 3 | 233 | 48065 | 273.7 | 731 | 735 | 172.9 |
| C | 0 | 207 | 14956 | 82.24 | 731 | 735 | 172.9 |
| D | 1 | 52 | 1628432 | 9077.49 | 705 | 685 | 179.3 |
| D | 13 | 138 | 375504 | 2090.26 | 705 | 685 | 179.3 |
| D | 13 | 249 | 319449 | 1777.66 | 705 | 685 | 179.3 |
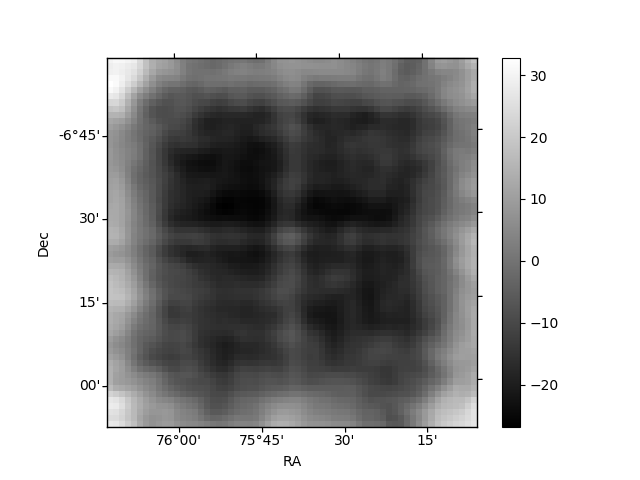
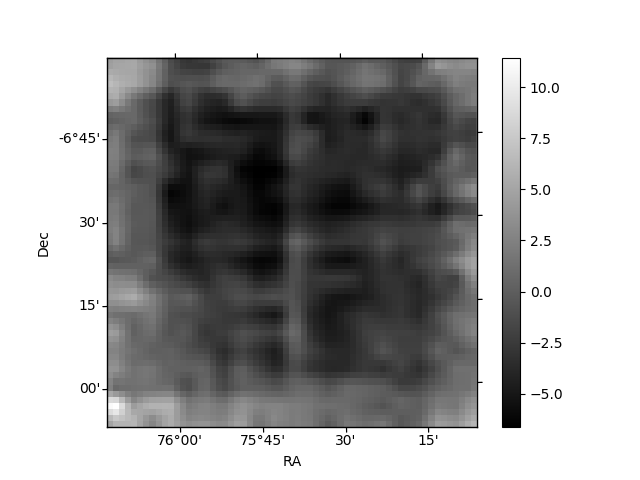
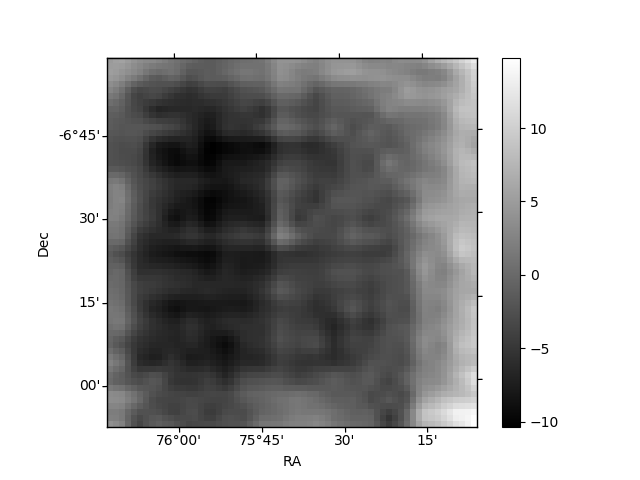
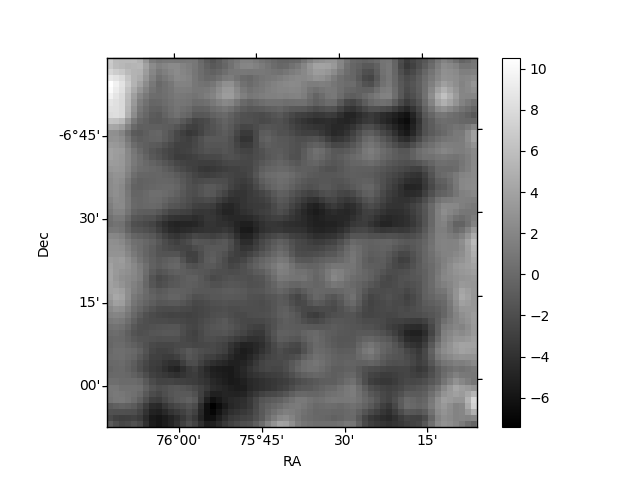
Histogram calculated using DETX and DETY for each event in the final _common_clean file
| Quadrant A | 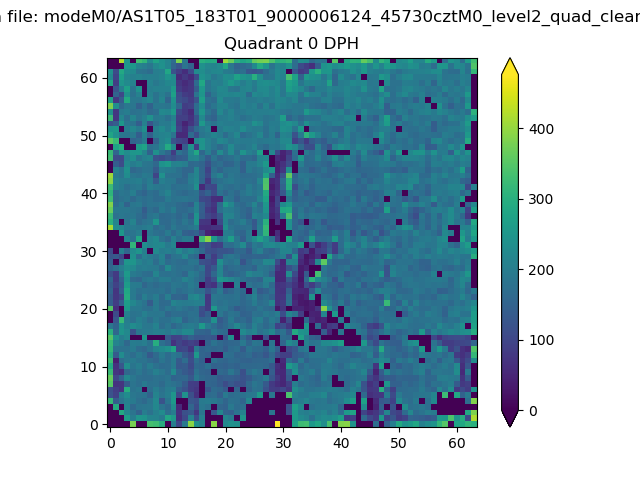 |
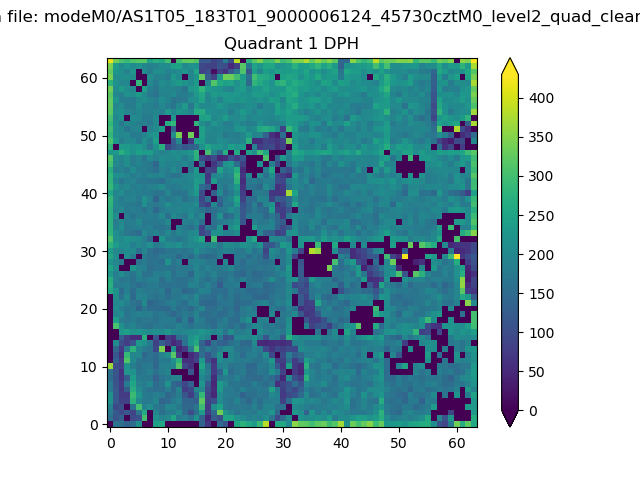 |
Quadrant B |
|---|---|---|---|
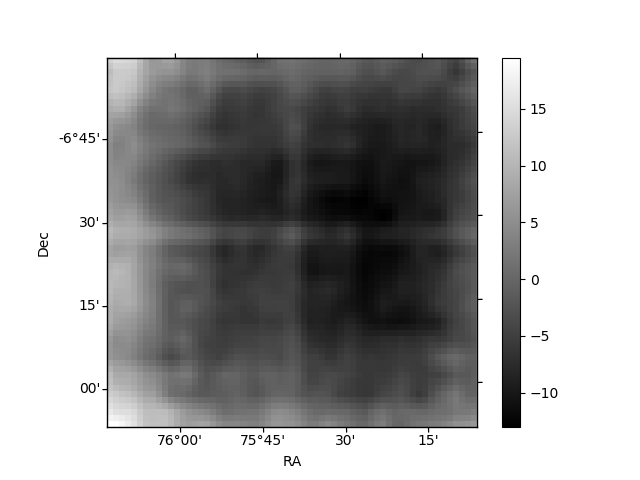
| Quadrant D | 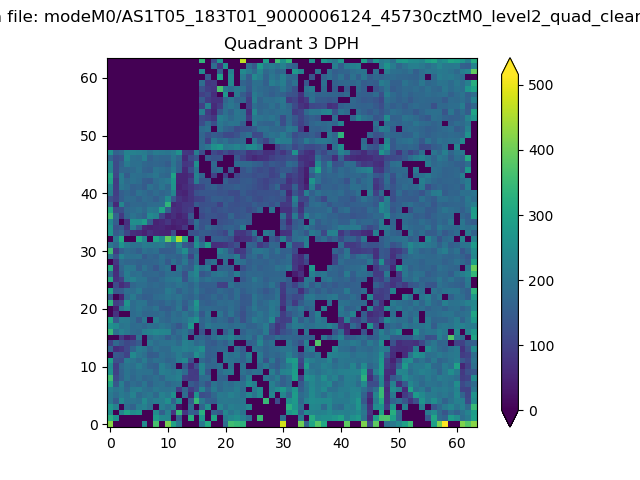 |
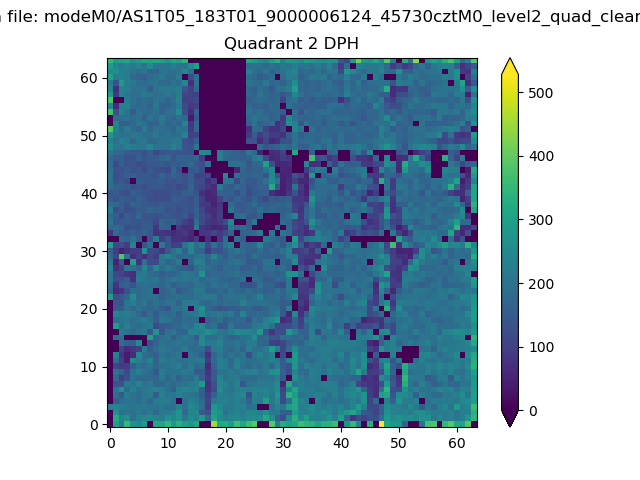 |
Quadrant C |
| Plot type | Count rate plots | Images |
|---|---|---|
| Comparison with Poisson distribution Blue bars denote a histogram of data divided into 1 sec bins. Red curve is a Poisson curve with rate = median count rate of data. |
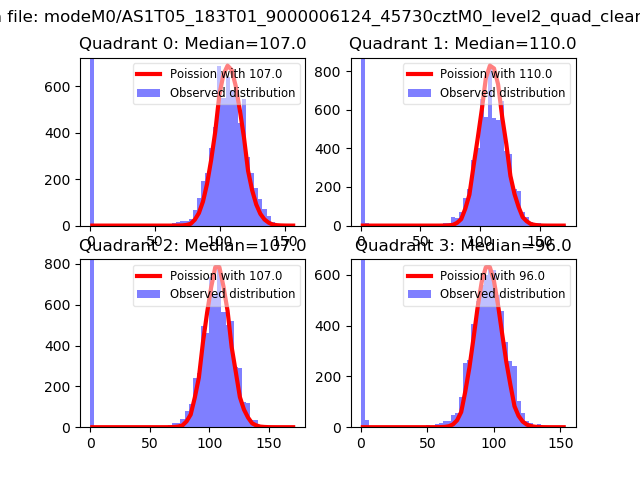 |
 |
| Quadrant-wise count rates Data is divided into 100 sec bins |
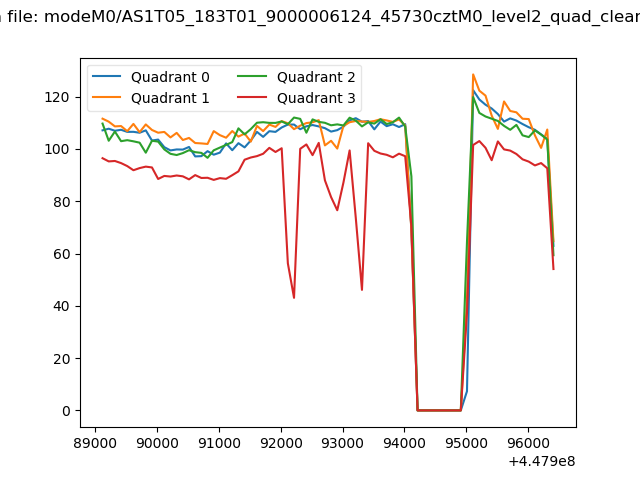 |
|
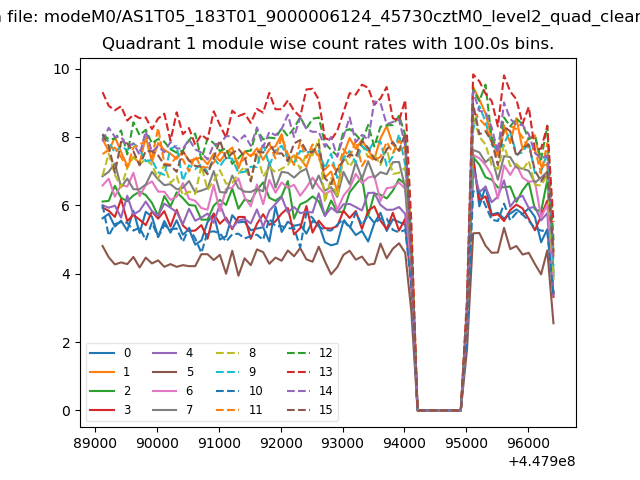
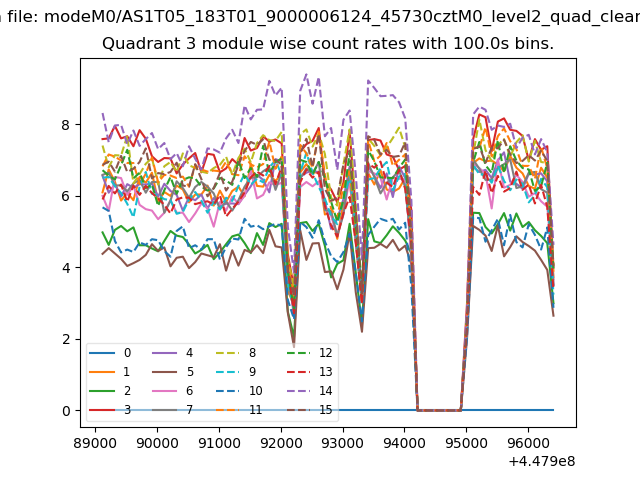
| Module-wise count rates for Quadrant A Data is divided into 100 sec bins |
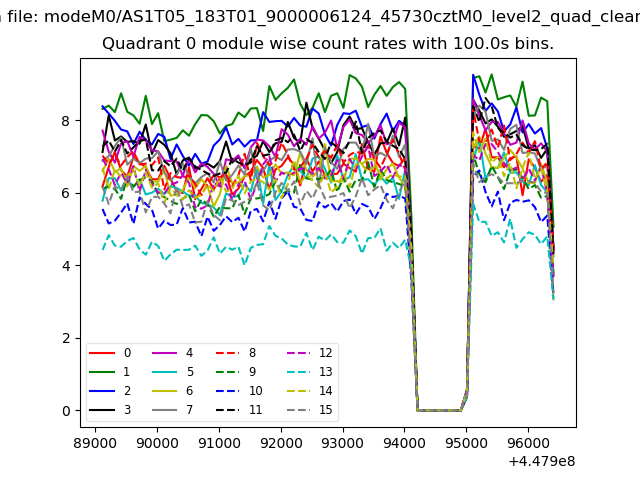 |
 |
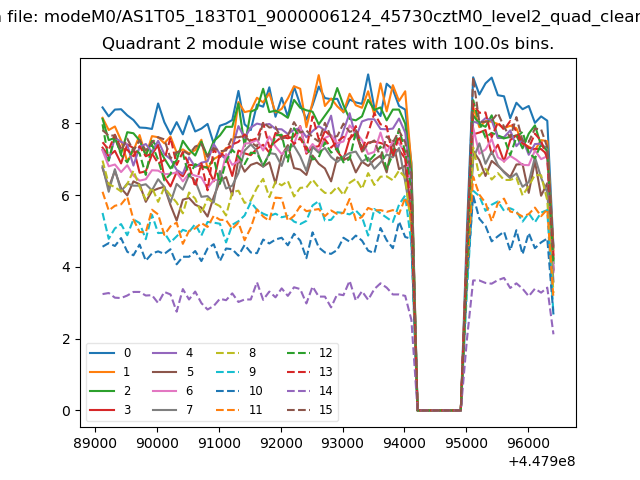
| Module-wise count rates for Quadrant B Data is divided into 100 sec bins |
 |
 |
| Module-wise count rates for Quadrant C Data is divided into 100 sec bins |
 |
 |
| Module-wise count rates for Quadrant D Data is divided into 100 sec bins |
 |
 |
| Parameter | Plot |
|---|---|
| CZT HV Monitor |  |
| D_VDD | 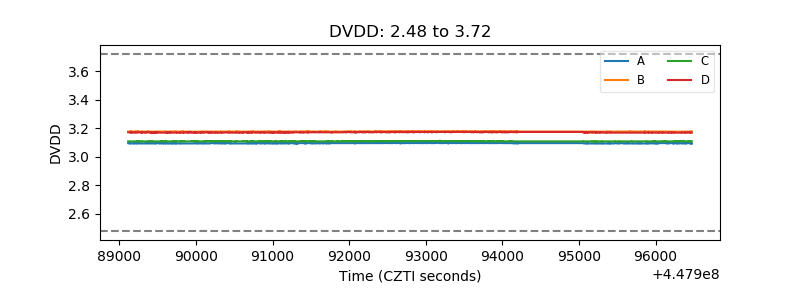 |
| Temperature 1 | 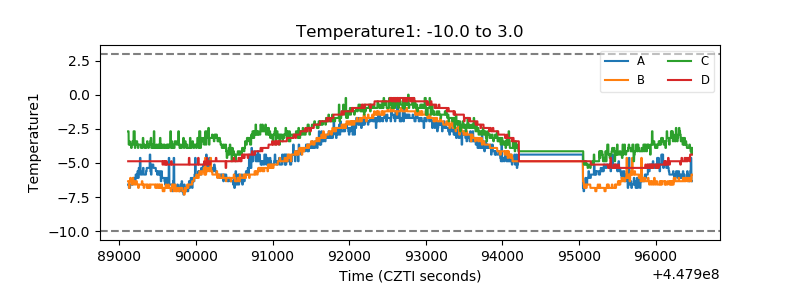 |
| Veto HV Monitor | 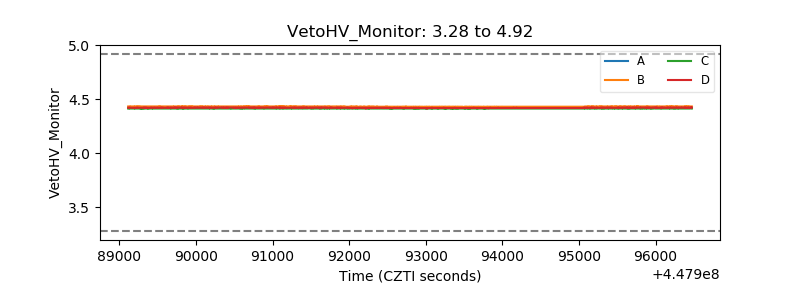 |
| Veto LLD | 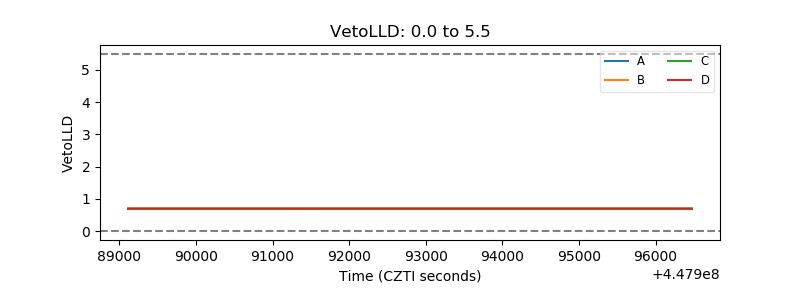 |
| Alpha Counter | 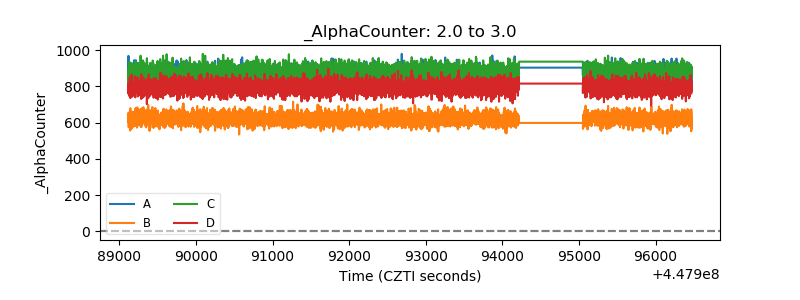 |
| _CPM_Rate | 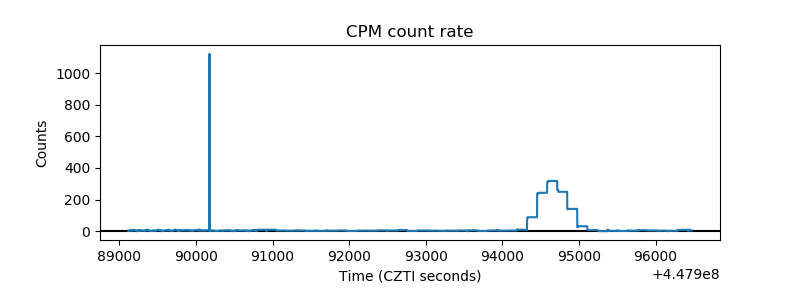 |
| CZT Counter | 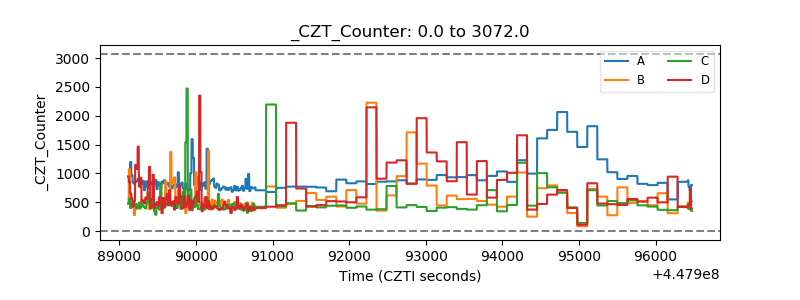 |
| +2.5 Volts monitor | 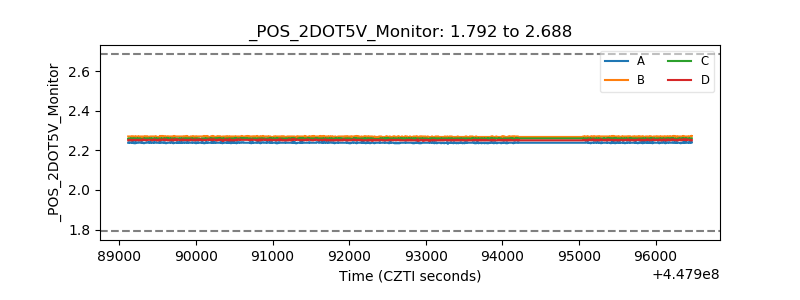 |
| +5 Volts monitor | 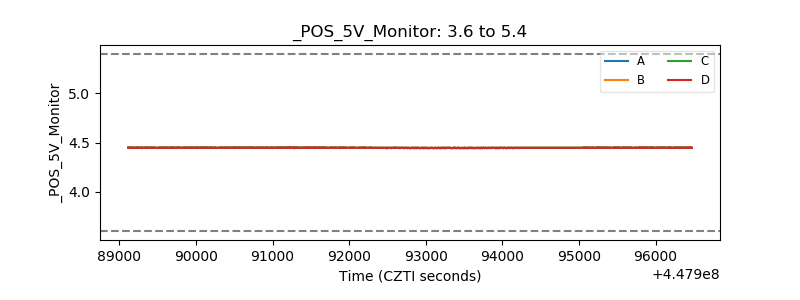 |
| _ROLL_ROT | 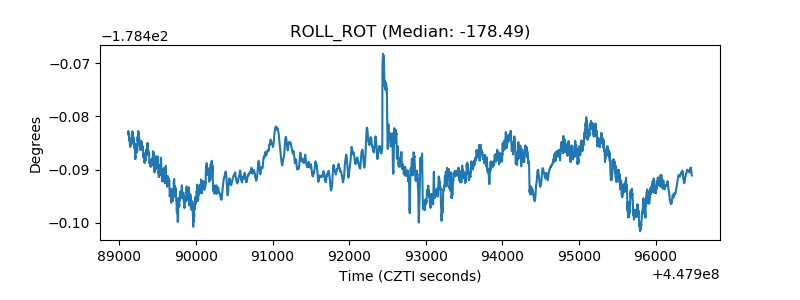 |
| _Roll_DEC | 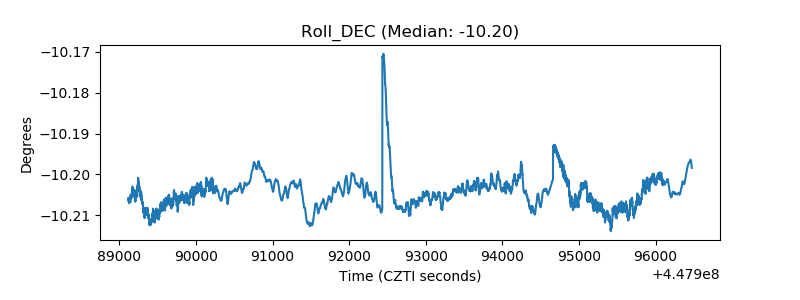 |
| _Roll_RA | 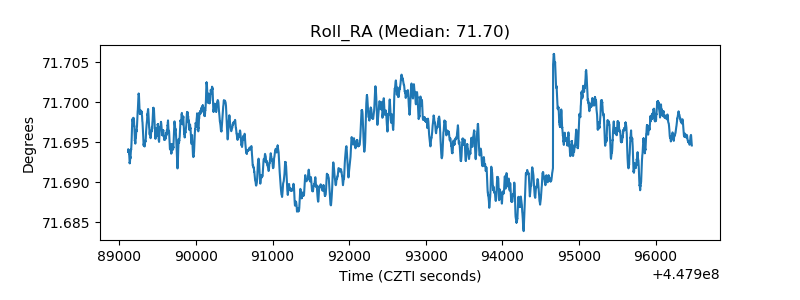 |
| Veto Counter | 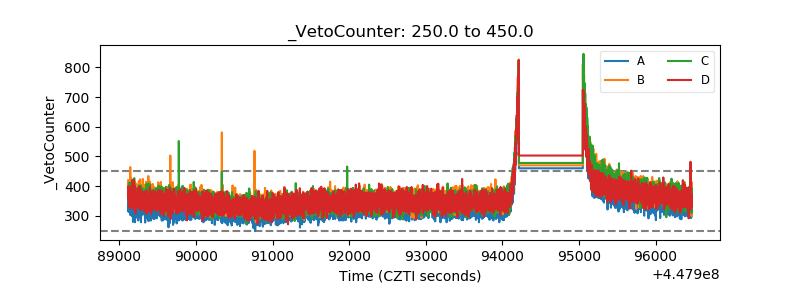 |