| Param | Original file | Final file |
|---|---|---|
| Filename | modeM0/AS1T05_183T01_9000006124_45733cztM0_level2.fits | modeM0/AS1T05_183T01_9000006124_45733cztM0_level2_quad_clean.evt |
| Size (bytes) | 539,547,840 | 111,130,560 |
| Size | 514.6 MB | 106.0 MB |
| Events in quadrant A | 6,224,637 | 742,616 |
| Events in quadrant B | 4,417,162 | 759,406 |
| Events in quadrant C | 3,549,366 | 750,722 |
| Events in quadrant D | 5,274,972 | 656,862 |
| Mode SS | |||
|---|---|---|---|
| Quadrant | BADHDUFLAG | Total packets | Discarded packets |
| A | 0 | 134 | 0 |
| B | 0 | 134 | 0 |
| C | 0 | 132 | 0 |
| D | 0 | 132 | 0 |
| Mode M0 | |||
|---|---|---|---|
| Quadrant | BADHDUFLAG | Total packets | Discarded packets |
| A | 0 | 22454 | 2 |
| B | 0 | 17265 | 2 |
| C | 0 | 14859 | 2 |
| D | 0 | 20038 | 2 |
| Mode M9 | |||
|---|---|---|---|
| Quadrant | BADHDUFLAG | Total packets | Discarded packets |
| A | 0 | 22 | 0 |
| B | 0 | 22 | 0 |
| C | 0 | 22 | 0 |
| D | 0 | 22 | 0 |
| Quadrant | Total seconds | Saturated seconds | Saturation percentage |
|---|---|---|---|
| A | 6533 | 283 | 4.331854% |
| B | 6534 | 370 | 5.662687% |
| C | 6534 | 164 | 2.509948% |
| D | 6533 | 470 | 7.194245% |
Noise dominated data is calculated using 1-second bins in cleaned event files. If a bin has >2000 counts, and if more than 50% of those come from <1% of pixels, then it is considered to be noise-dominated and hence unusable.
| Quadrant | # 1 sec bins | Bins with >0 counts | Bins with >2000 counts | High rate bins dominated by noise | Noise dominated (total time) | Noise dominated (detector-on time) | Marked lightcurve |
|---|---|---|---|---|---|---|---|
| A | 8693 | 6535 | 18 | 18 | 0.21% | 0.28% | 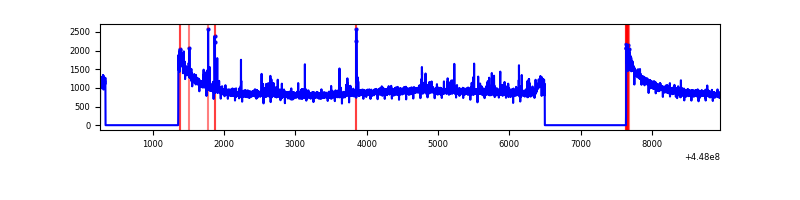 |
| B | 8694 | 6536 | 142 | 142 | 1.63% | 2.17% | 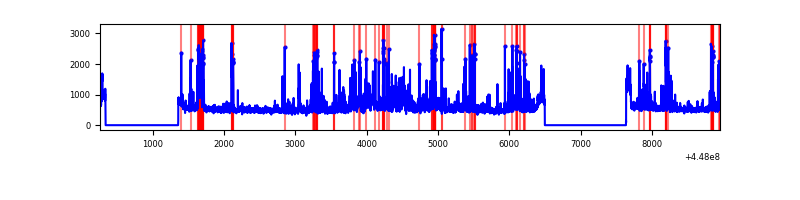 |
| C | 8694 | 6536 | 80 | 80 | 0.92% | 1.22% | 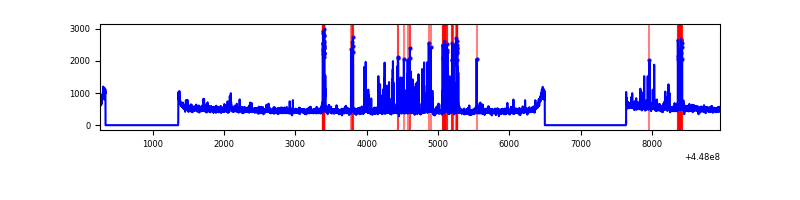 |
| D | 8693 | 6535 | 393 | 393 | 4.52% | 6.01% | 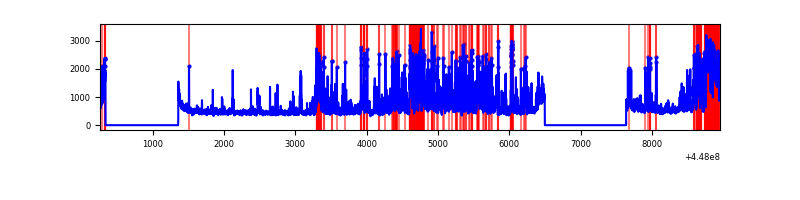 |
Top three noisy pixels from each quadrant. If the there are fewer than three noisy pixels in the level2.evt file, extra rows are filled as -1
| Pixel properties | Quadrant properties | ||||||
|---|---|---|---|---|---|---|---|
| Quadrant | DetID | PixID | Counts | Sigma | Mean | Median | Sigma |
| A | 10 | 83 | 3058319 | 18667.08 | 787 | 770 | 163.8 |
| A | 13 | 248 | 60794 | 366.46 | 787 | 770 | 163.8 |
| A | 2 | 79 | 40508 | 242.61 | 787 | 770 | 163.8 |
| B | 5 | 172 | 410277 | 2710.32 | 779 | 756 | 151.1 |
| B | 3 | 112 | 272507 | 1798.52 | 779 | 756 | 151.1 |
| B | 5 | 255 | 185225 | 1220.86 | 779 | 756 | 151.1 |
| C | 14 | 254 | 169487 | 914.02 | 779 | 784 | 184.6 |
| C | 0 | 207 | 132373 | 712.94 | 779 | 784 | 184.6 |
| C | 2 | 14 | 116813 | 628.64 | 779 | 784 | 184.6 |
| D | 1 | 52 | 1462000 | 7633.18 | 762 | 738 | 191.4 |
| D | 2 | 249 | 229071 | 1192.74 | 762 | 738 | 191.4 |
| D | 13 | 249 | 173468 | 902.29 | 762 | 738 | 191.4 |
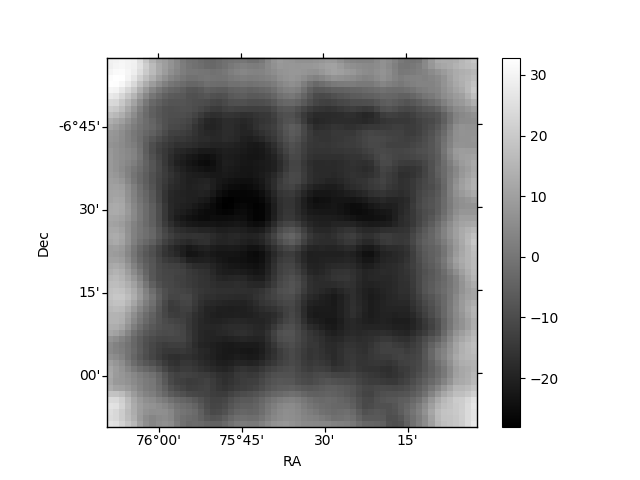
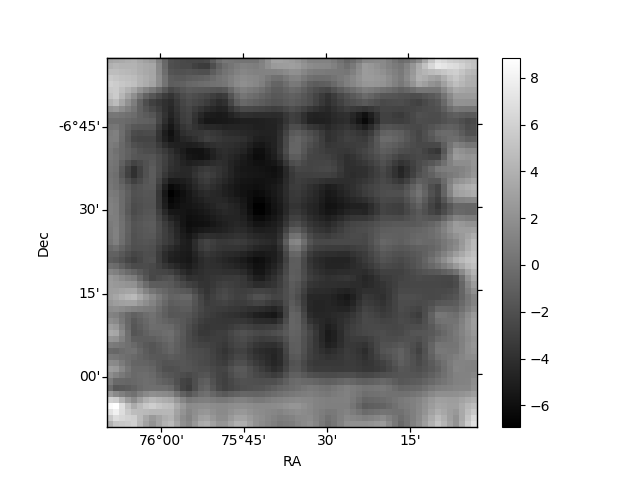
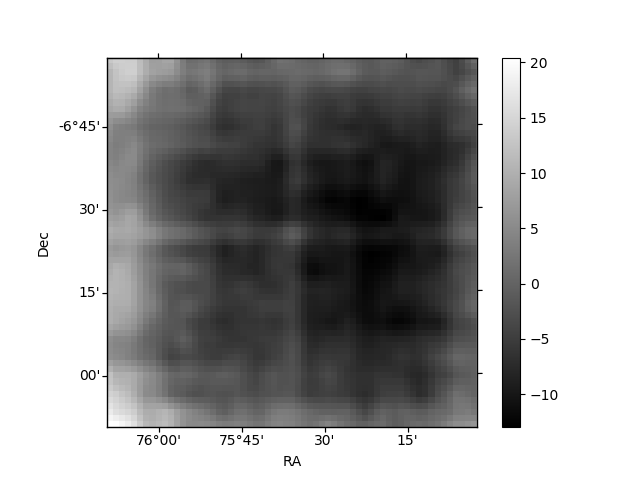
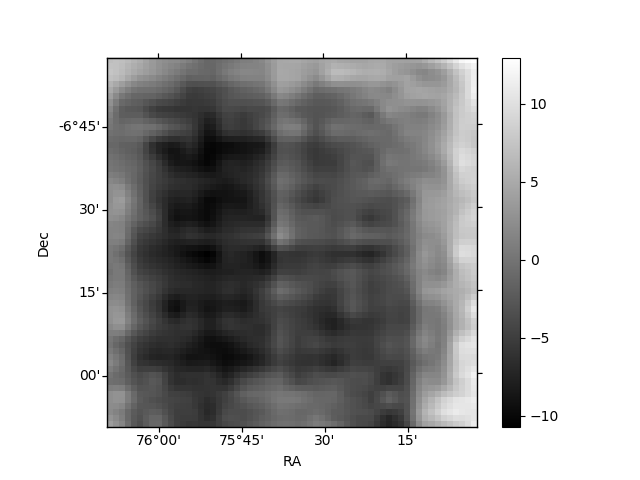
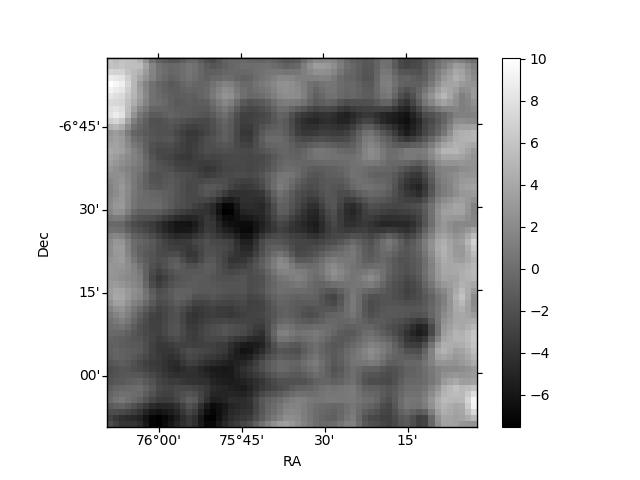
Histogram calculated using DETX and DETY for each event in the final _common_clean file
| Quadrant A | 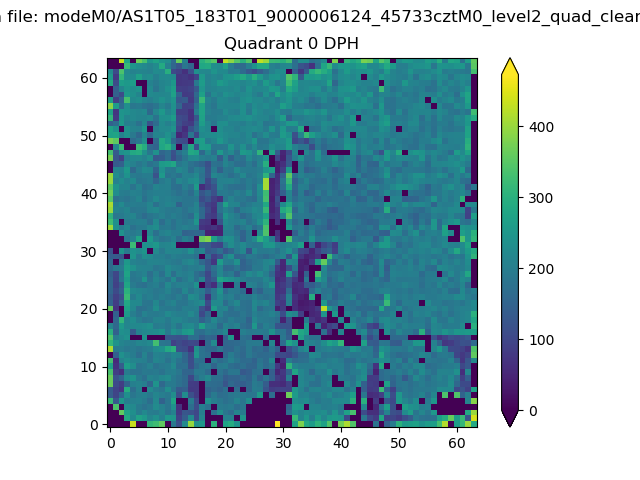 |
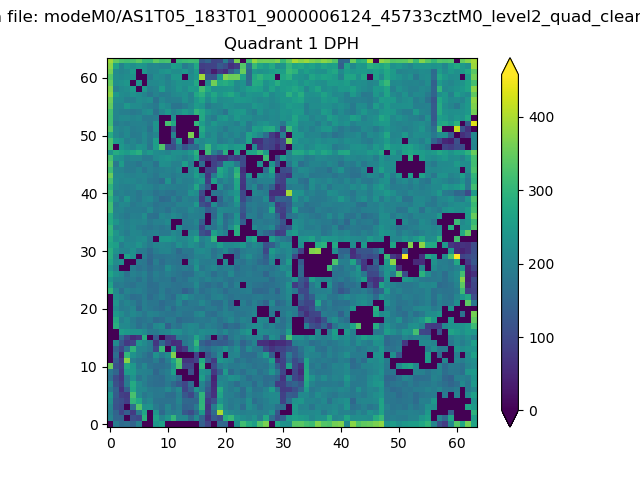 |
Quadrant B |
|---|---|---|---|
| Quadrant D | 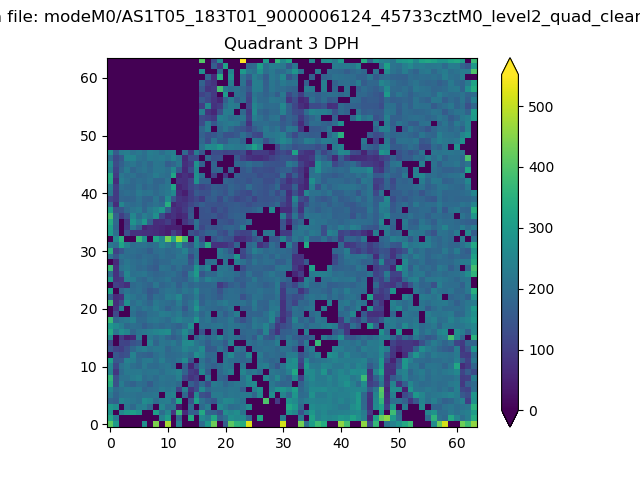 |
 |
Quadrant C |
| Plot type | Count rate plots | Images |
|---|---|---|
| Comparison with Poisson distribution Blue bars denote a histogram of data divided into 1 sec bins. Red curve is a Poisson curve with rate = median count rate of data. |
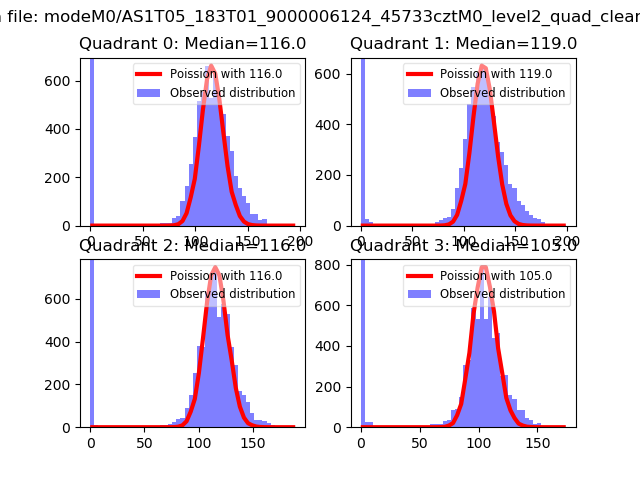 |
 |
| Quadrant-wise count rates Data is divided into 100 sec bins |
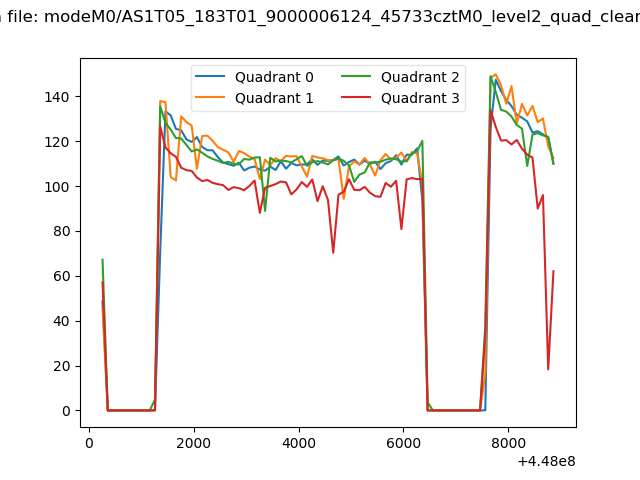 |
|
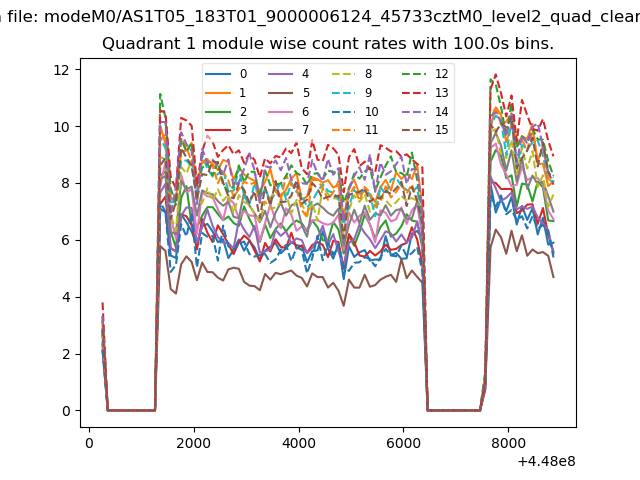
| Module-wise count rates for Quadrant A Data is divided into 100 sec bins |
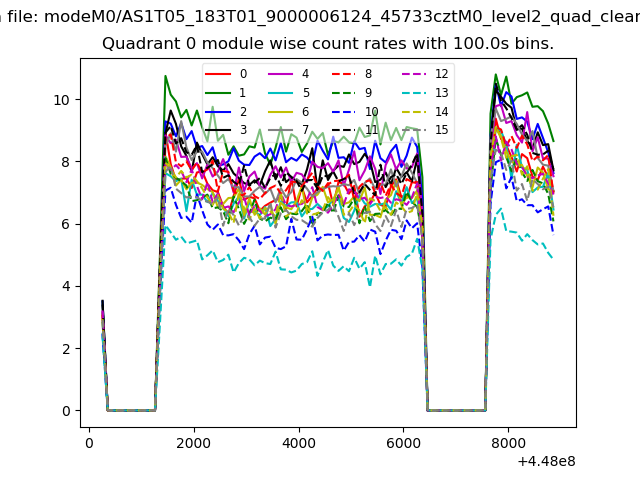 |
 |
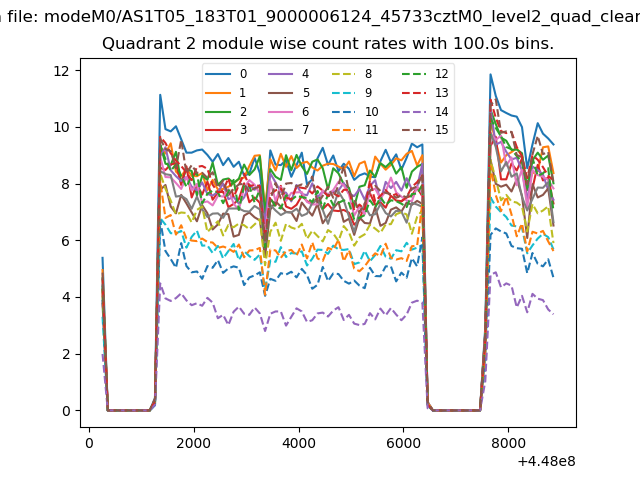
| Module-wise count rates for Quadrant B Data is divided into 100 sec bins |
 |
 |
| Module-wise count rates for Quadrant C Data is divided into 100 sec bins |
 |
 |
| Module-wise count rates for Quadrant D Data is divided into 100 sec bins |
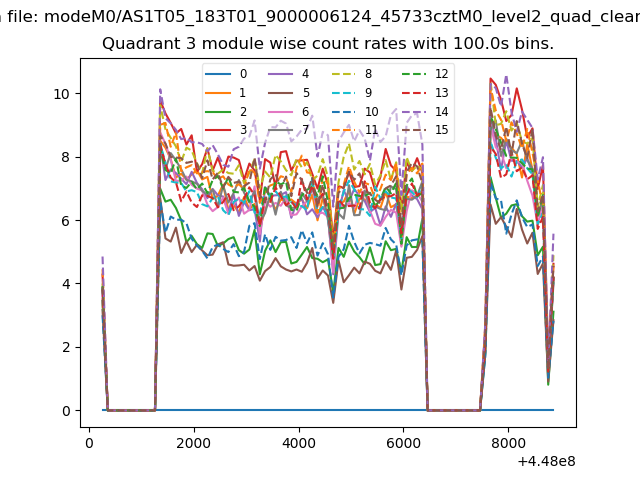 |
 |
| Parameter | Plot |
|---|---|
| CZT HV Monitor | 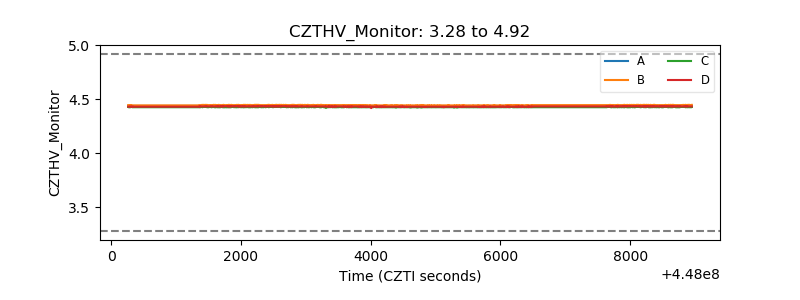 |
| D_VDD | 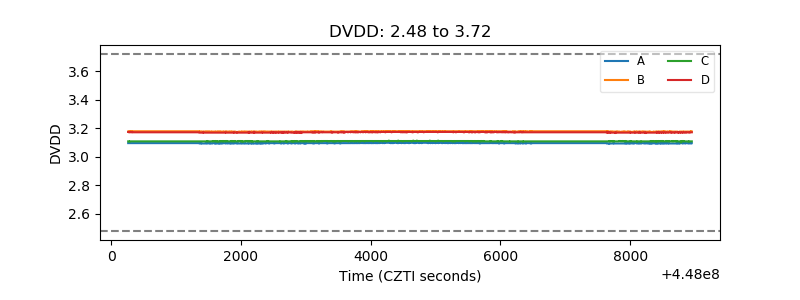 |
| Temperature 1 | 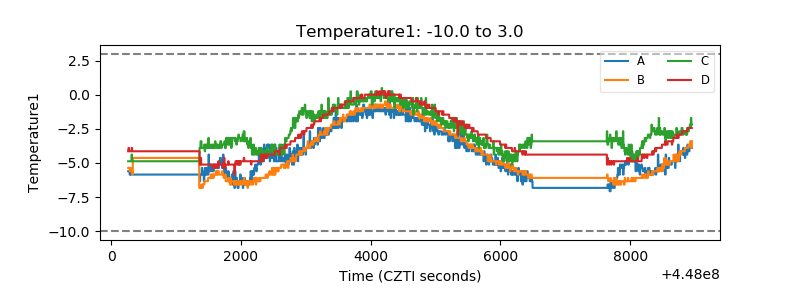 |
| Veto HV Monitor | 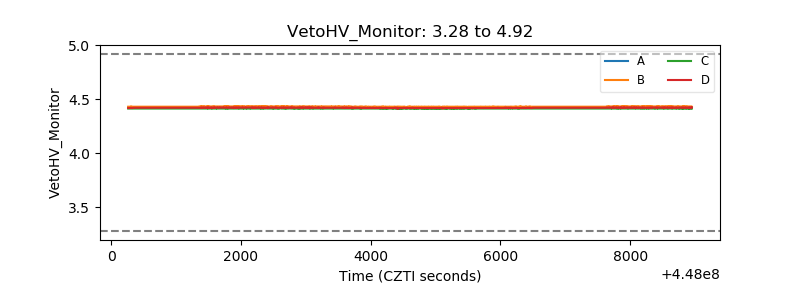 |
| Veto LLD | 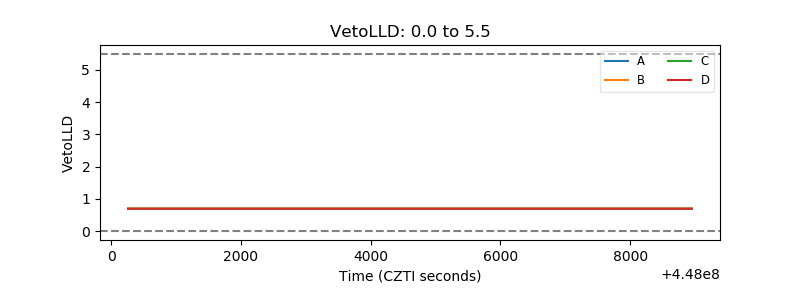 |
| Alpha Counter | 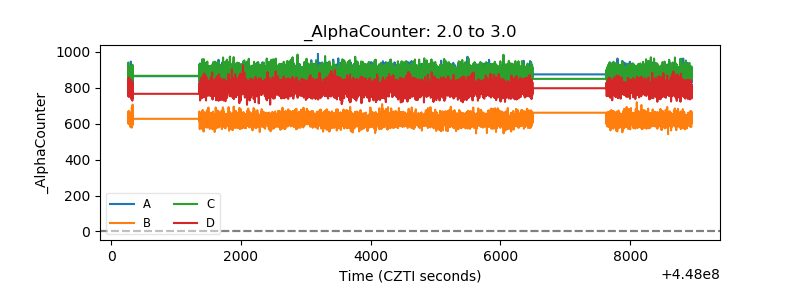 |
| _CPM_Rate | 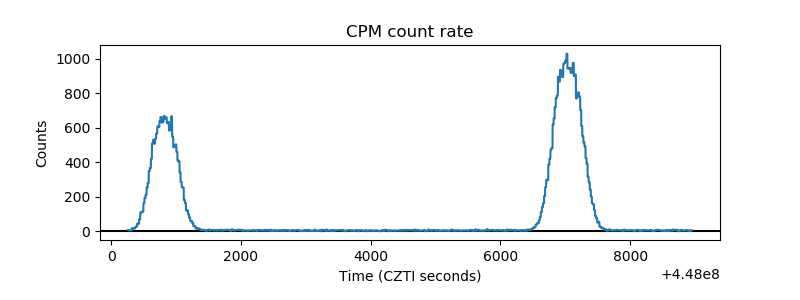 |
| CZT Counter | 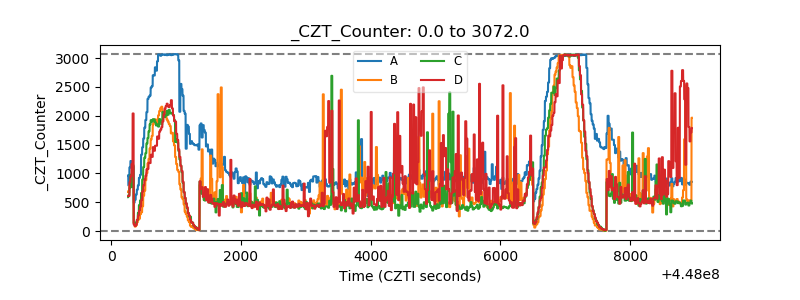 |
| +2.5 Volts monitor | 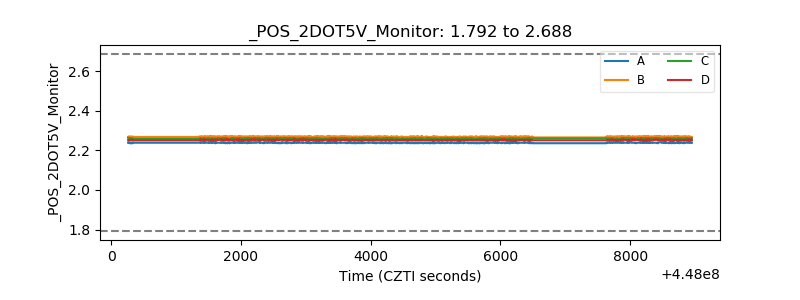 |
| +5 Volts monitor | 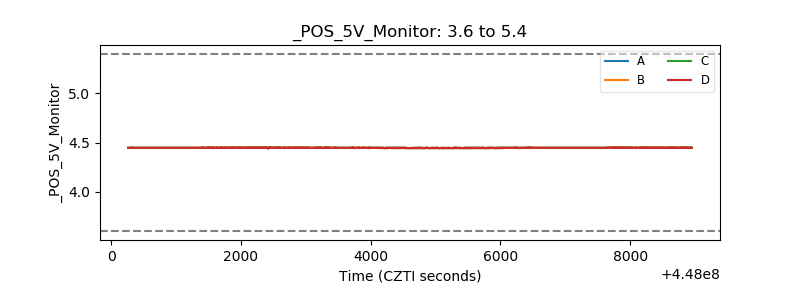 |
| _ROLL_ROT | 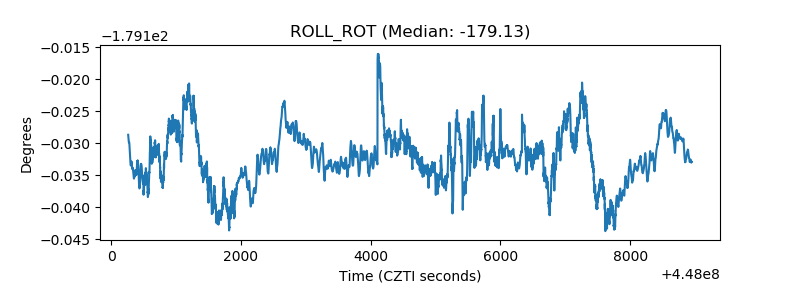 |
| _Roll_DEC | 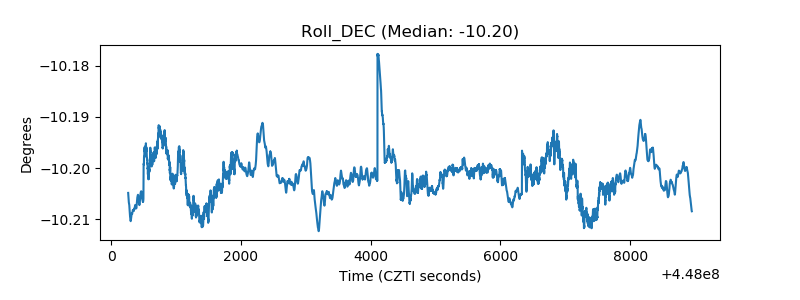 |
| _Roll_RA | 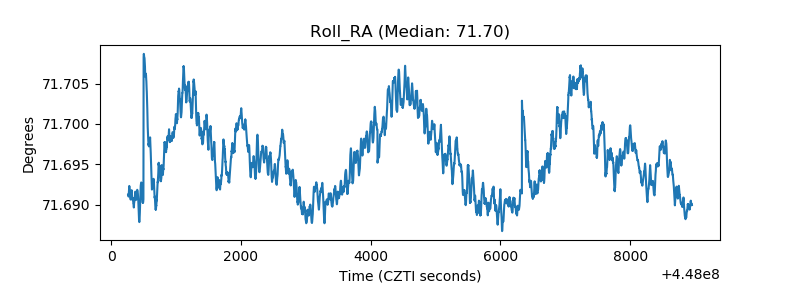 |
| Veto Counter | 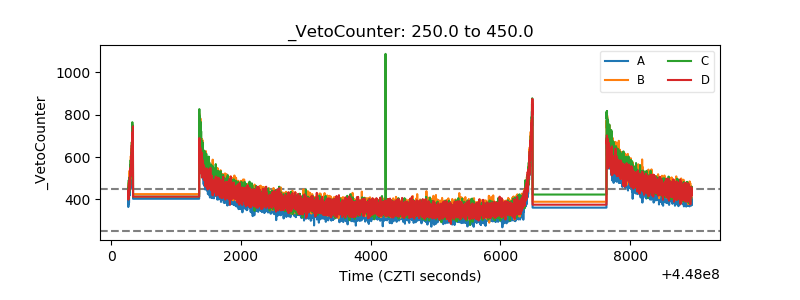 |