| Param | Original file | Final file |
|---|---|---|
| Filename | modeM0/AS1T05_183T01_9000006124_45734cztM0_level2.fits | modeM0/AS1T05_183T01_9000006124_45734cztM0_level2_quad_clean.evt |
| Size (bytes) | 594,155,520 | 112,875,840 |
| Size | 566.6 MB | 107.6 MB |
| Events in quadrant A | 6,275,427 | 771,130 |
| Events in quadrant B | 4,391,406 | 797,815 |
| Events in quadrant C | 3,852,223 | 773,014 |
| Events in quadrant D | 6,973,738 | 624,665 |
| Mode SS | |||
|---|---|---|---|
| Quadrant | BADHDUFLAG | Total packets | Discarded packets |
| A | 0 | 132 | 0 |
| B | 0 | 132 | 0 |
| C | 0 | 132 | 0 |
| D | 0 | 132 | 0 |
| Mode M0 | |||
|---|---|---|---|
| Quadrant | BADHDUFLAG | Total packets | Discarded packets |
| A | 0 | 22609 | 4 |
| B | 0 | 17115 | 2 |
| C | 0 | 15560 | 2 |
| D | 0 | 25093 | 2 |
| Mode M9 | |||
|---|---|---|---|
| Quadrant | BADHDUFLAG | Total packets | Discarded packets |
| A | 0 | 16 | 0 |
| B | 0 | 17 | 0 |
| C | 0 | 17 | 0 |
| D | 0 | 17 | 0 |
| Quadrant | Total seconds | Saturated seconds | Saturation percentage |
|---|---|---|---|
| A | 6469 | 324 | 5.008502% |
| B | 6469 | 294 | 4.544752% |
| C | 6469 | 258 | 3.988252% |
| D | 6469 | 1094 | 16.911424% |
Noise dominated data is calculated using 1-second bins in cleaned event files. If a bin has >2000 counts, and if more than 50% of those come from <1% of pixels, then it is considered to be noise-dominated and hence unusable.
| Quadrant | # 1 sec bins | Bins with >0 counts | Bins with >2000 counts | High rate bins dominated by noise | Noise dominated (total time) | Noise dominated (detector-on time) | Marked lightcurve |
|---|---|---|---|---|---|---|---|
| A | 7609 | 6470 | 40 | 40 | 0.53% | 0.62% | 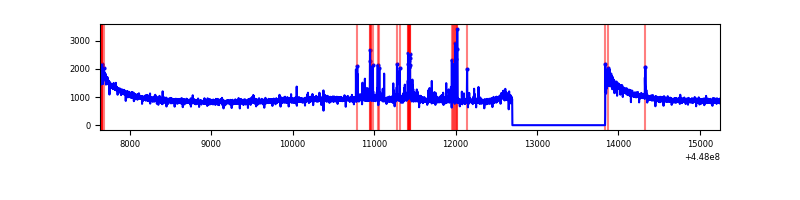 |
| B | 7609 | 6470 | 83 | 83 | 1.09% | 1.28% | 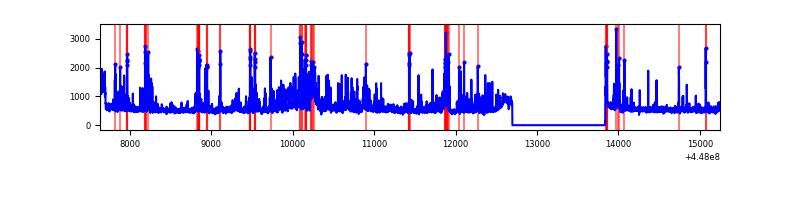 |
| C | 7609 | 6470 | 182 | 182 | 2.39% | 2.81% | 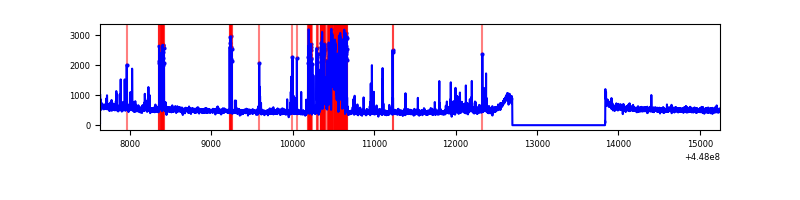 |
| D | 7609 | 6470 | 1090 | 1090 | 14.33% | 16.85% | 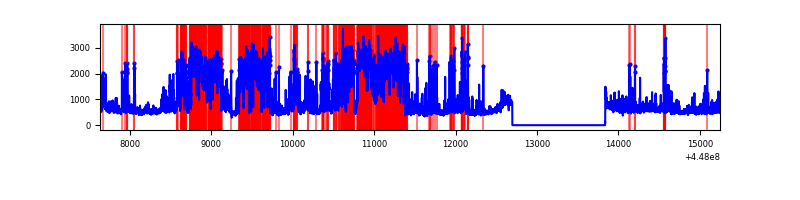 |
Top three noisy pixels from each quadrant. If the there are fewer than three noisy pixels in the level2.evt file, extra rows are filled as -1
| Pixel properties | Quadrant properties | ||||||
|---|---|---|---|---|---|---|---|
| Quadrant | DetID | PixID | Counts | Sigma | Mean | Median | Sigma |
| A | 10 | 83 | 2991264 | 17989.36 | 802 | 787 | 166.2 |
| A | 9 | 191 | 148078 | 886.04 | 802 | 787 | 166.2 |
| A | 13 | 254 | 10976 | 61.29 | 802 | 787 | 166.2 |
| B | 3 | 112 | 426923 | 2742.3 | 796 | 774 | 155.4 |
| B | 5 | 172 | 337706 | 2168.18 | 796 | 774 | 155.4 |
| B | 5 | 255 | 121899 | 779.45 | 796 | 774 | 155.4 |
| C | 14 | 254 | 655057 | 3567.76 | 785 | 792 | 183.4 |
| C | 0 | 207 | 63798 | 343.57 | 785 | 792 | 183.4 |
| C | 3 | 233 | 29544 | 156.78 | 785 | 792 | 183.4 |
| D | 1 | 52 | 3502240 | 18570.11 | 752 | 730 | 188.6 |
| D | 13 | 249 | 156482 | 826.02 | 752 | 730 | 188.6 |
| D | 2 | 249 | 119158 | 628.08 | 752 | 730 | 188.6 |
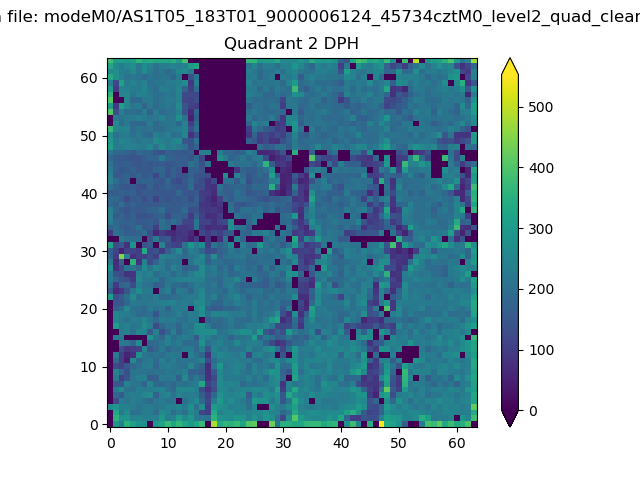
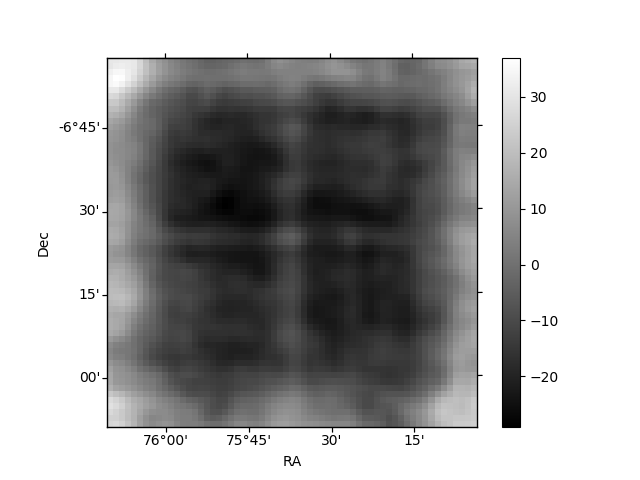
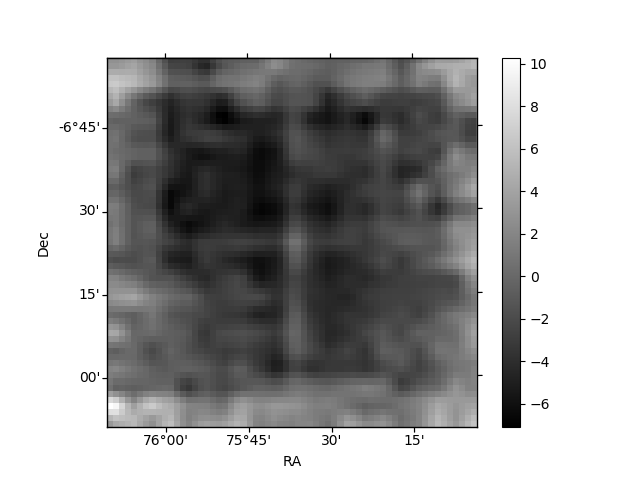
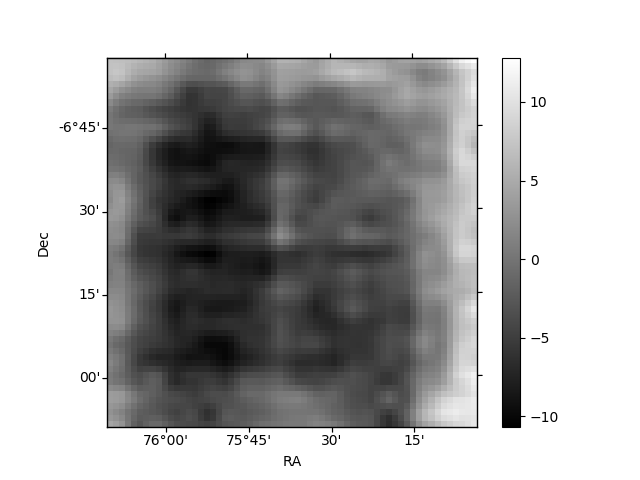
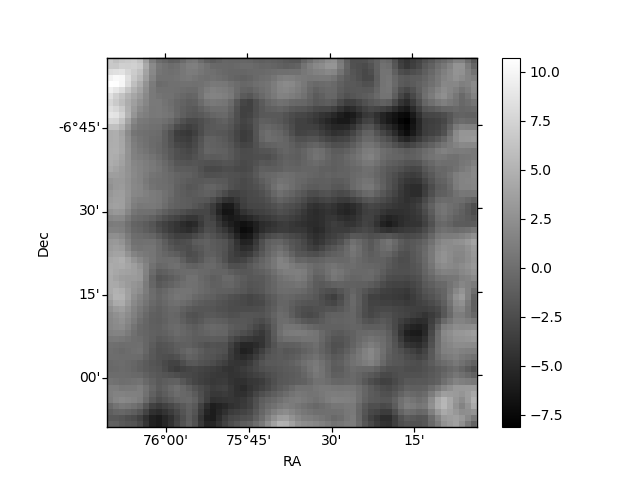
Histogram calculated using DETX and DETY for each event in the final _common_clean file
| Quadrant A | 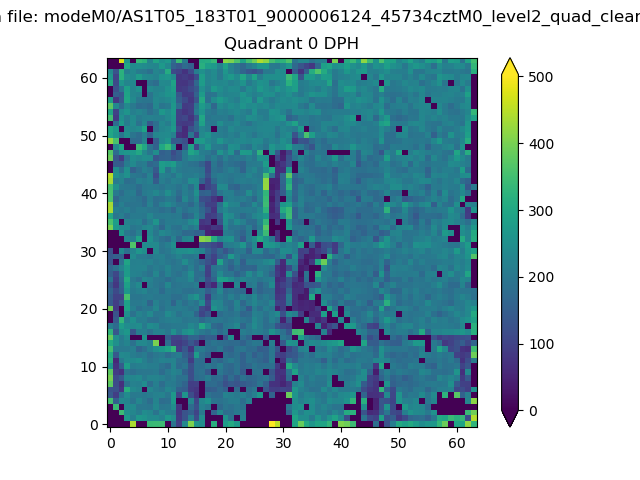 |
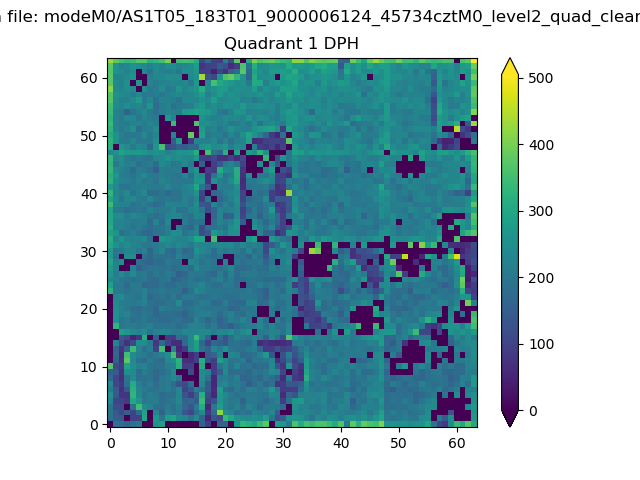 |
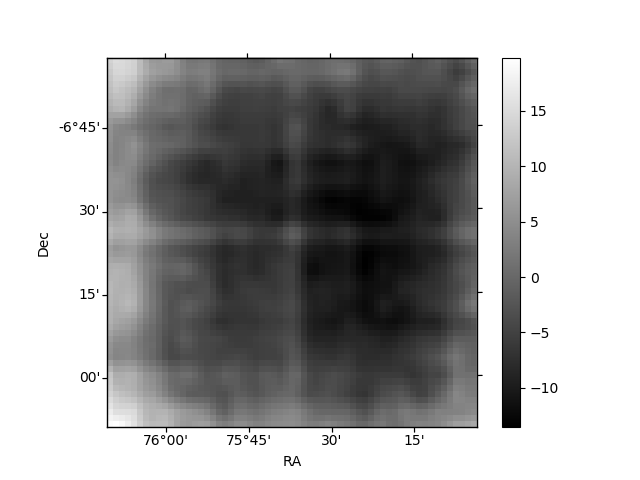
Quadrant B |
|---|---|---|---|
| Quadrant D | 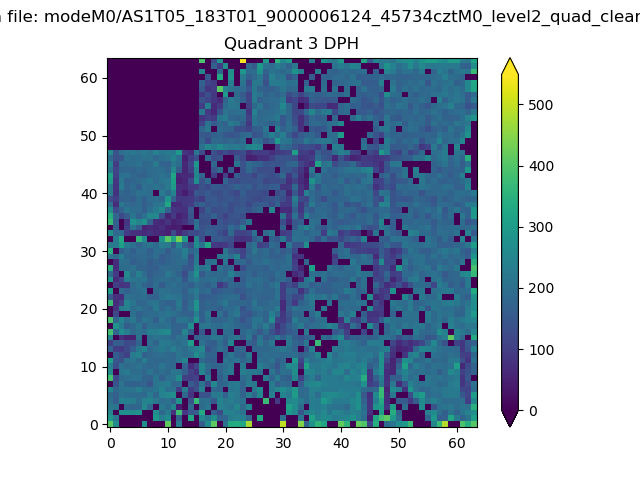 |
 |
Quadrant C |
| Plot type | Count rate plots | Images |
|---|---|---|
| Comparison with Poisson distribution Blue bars denote a histogram of data divided into 1 sec bins. Red curve is a Poisson curve with rate = median count rate of data. |
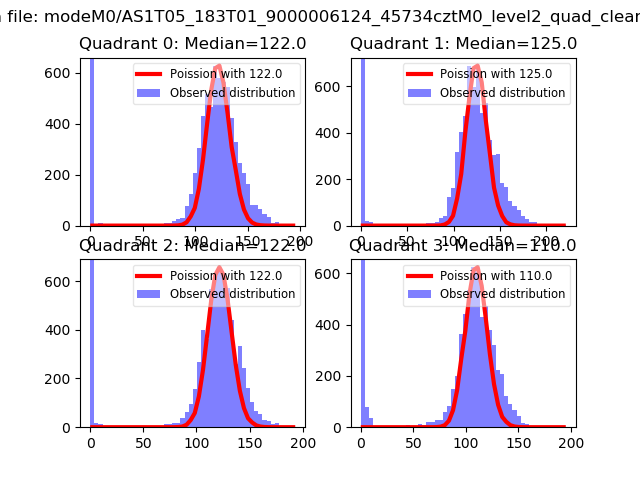 |
 |
| Quadrant-wise count rates Data is divided into 100 sec bins |
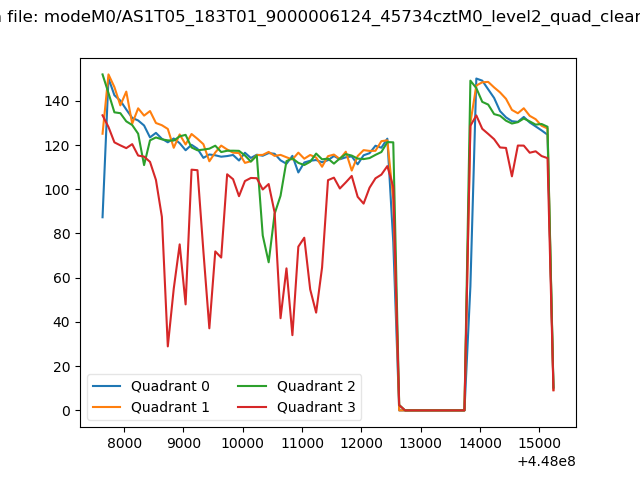 |
|
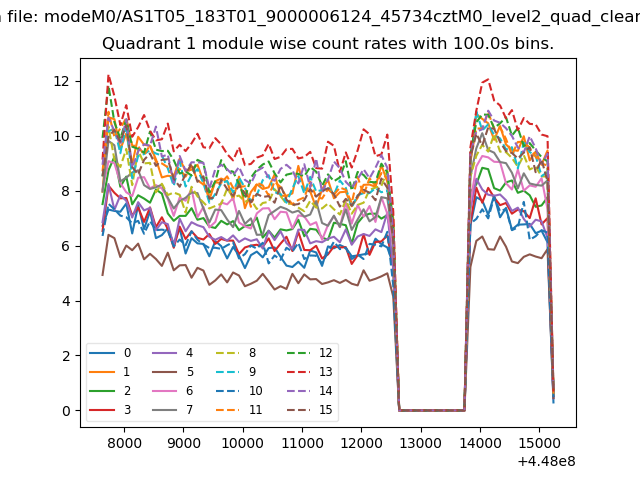
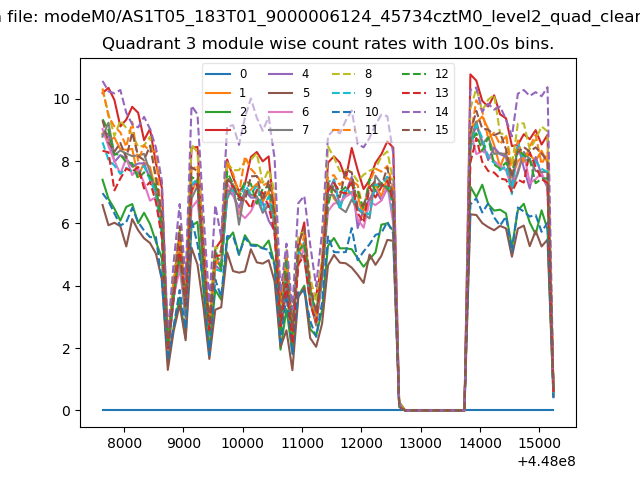
| Module-wise count rates for Quadrant A Data is divided into 100 sec bins |
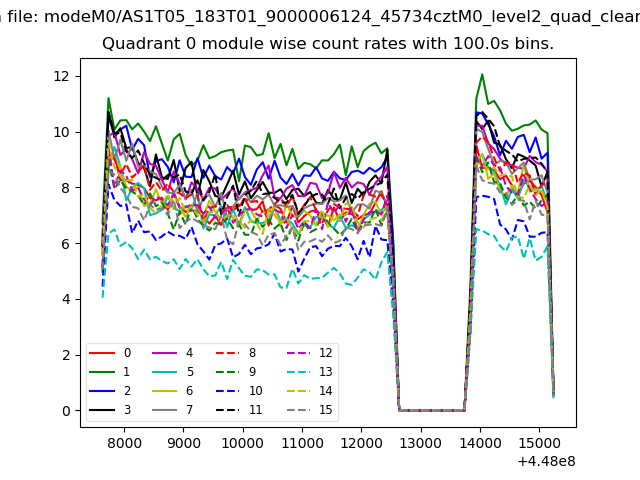 |
 |
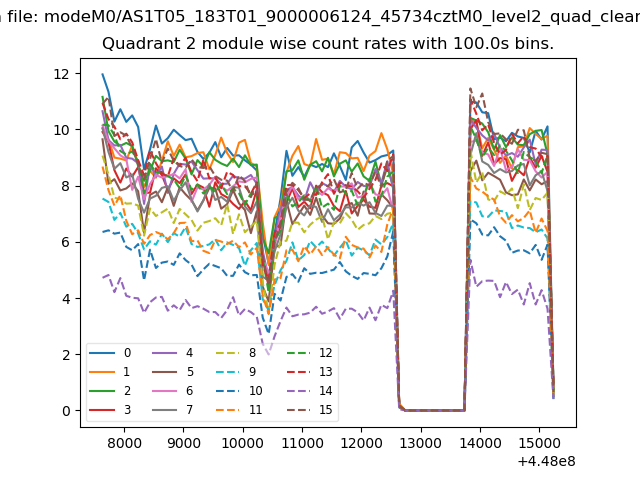
| Module-wise count rates for Quadrant B Data is divided into 100 sec bins |
 |
 |
| Module-wise count rates for Quadrant C Data is divided into 100 sec bins |
 |
 |
| Module-wise count rates for Quadrant D Data is divided into 100 sec bins |
 |
 |
| Parameter | Plot |
|---|---|
| CZT HV Monitor | 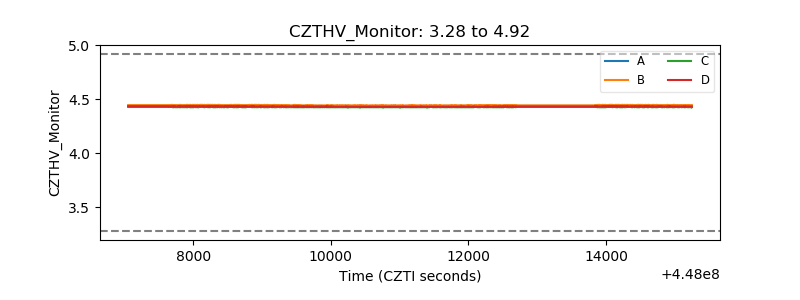 |
| D_VDD | 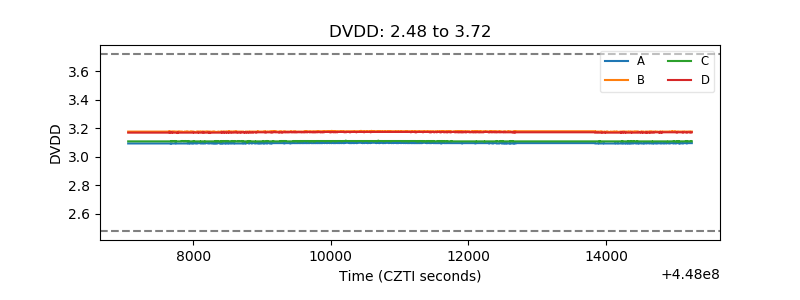 |
| Temperature 1 | 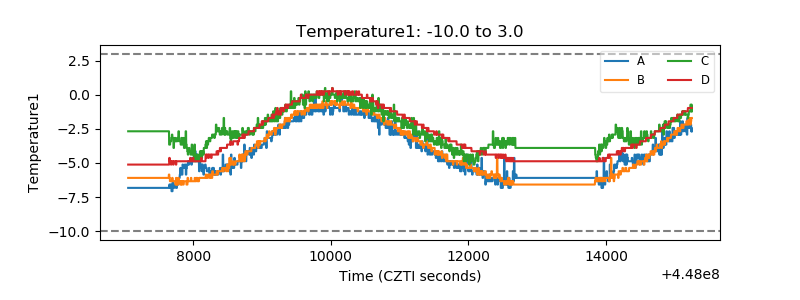 |
| Veto HV Monitor |  |
| Veto LLD | 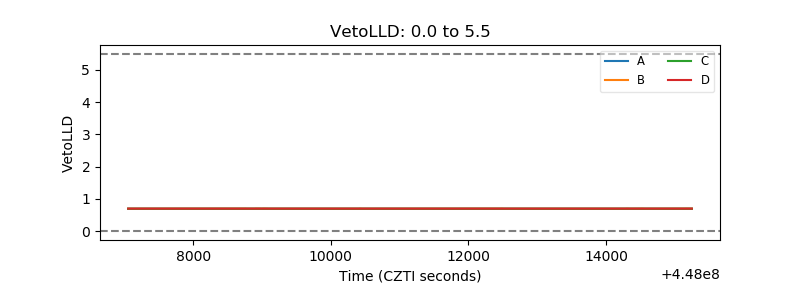 |
| Alpha Counter | 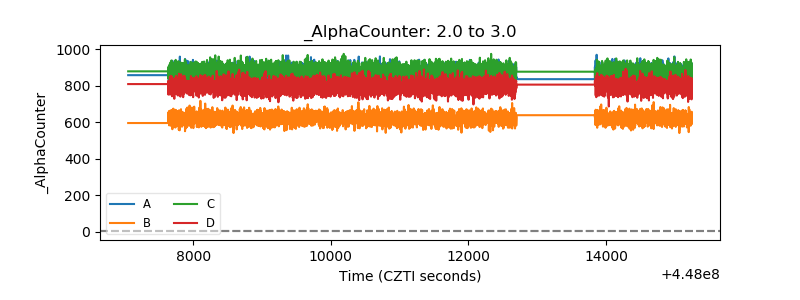 |
| _CPM_Rate |  |
| CZT Counter | 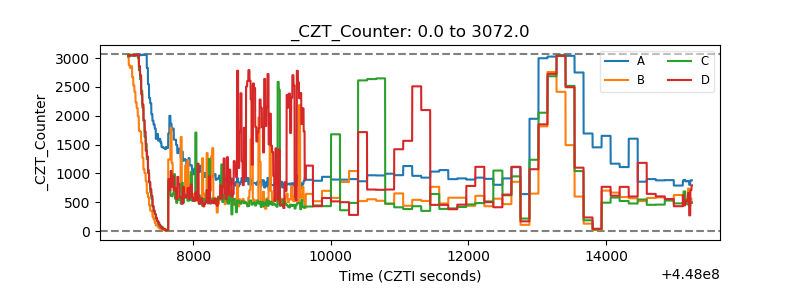 |
| +2.5 Volts monitor | 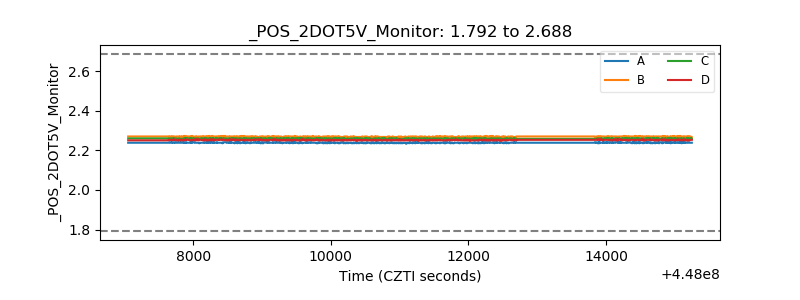 |
| +5 Volts monitor | 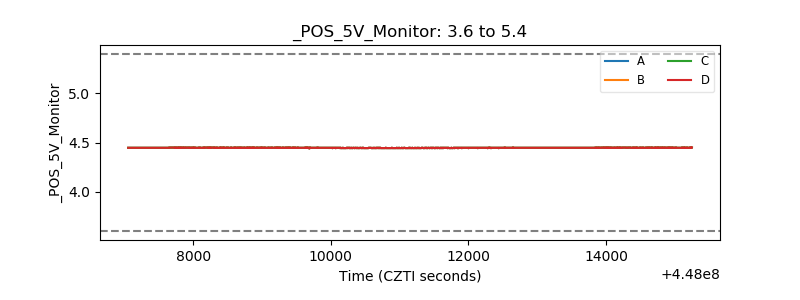 |
| _ROLL_ROT | 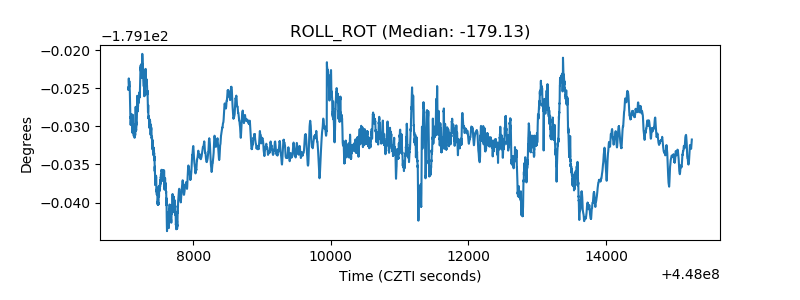 |
| _Roll_DEC | 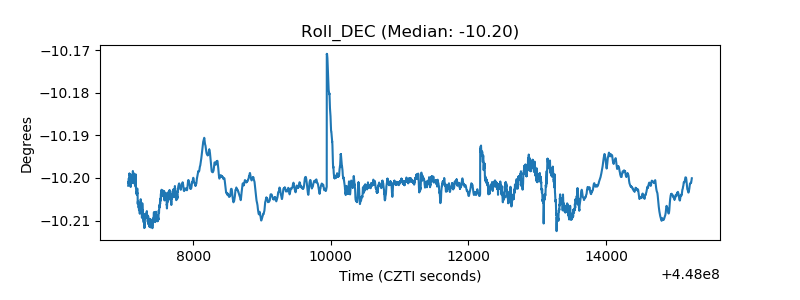 |
| _Roll_RA | 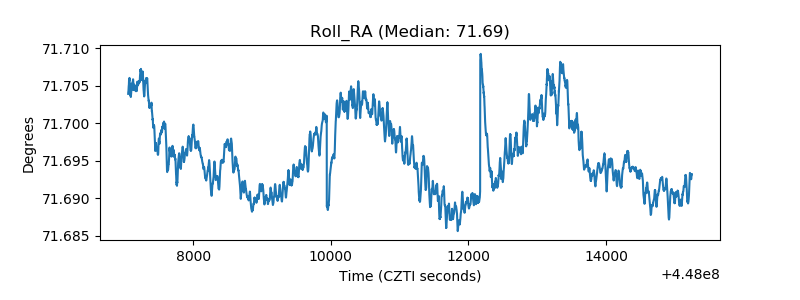 |
| Veto Counter | 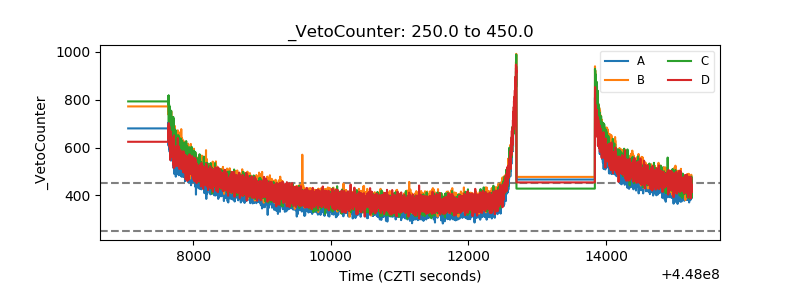 |