| Param | Original file | Final file |
|---|---|---|
| Filename | modeM0/AS1T05_183T01_9000006124_45736cztM0_level2.fits | modeM0/AS1T05_183T01_9000006124_45736cztM0_level2_quad_clean.evt |
| Size (bytes) | 509,126,400 | 106,479,360 |
| Size | 485.5 MB | 101.5 MB |
| Events in quadrant A | 5,744,954 | 716,824 |
| Events in quadrant B | 4,655,565 | 726,029 |
| Events in quadrant C | 3,000,038 | 727,860 |
| Events in quadrant D | 4,972,436 | 627,620 |
| Mode SS | |||
|---|---|---|---|
| Quadrant | BADHDUFLAG | Total packets | Discarded packets |
| A | 0 | 122 | 0 |
| B | 0 | 122 | 0 |
| C | 0 | 122 | 0 |
| D | 0 | 122 | 0 |
| Mode M0 | |||
|---|---|---|---|
| Quadrant | BADHDUFLAG | Total packets | Discarded packets |
| A | 0 | 20681 | 1 |
| B | 0 | 17913 | 1 |
| C | 0 | 13025 | 1 |
| D | 0 | 18842 | 1 |
| Mode M9 | |||
|---|---|---|---|
| Quadrant | BADHDUFLAG | Total packets | Discarded packets |
| A | 0 | 12 | 0 |
| B | 0 | 12 | 0 |
| C | 0 | 12 | 0 |
| D | 0 | 12 | 0 |
| Quadrant | Total seconds | Saturated seconds | Saturation percentage |
|---|---|---|---|
| A | 6105 | 234 | 3.832924% |
| B | 6106 | 334 | 5.470029% |
| C | 6106 | 58 | 0.949885% |
| D | 6106 | 468 | 7.664592% |
Noise dominated data is calculated using 1-second bins in cleaned event files. If a bin has >2000 counts, and if more than 50% of those come from <1% of pixels, then it is considered to be noise-dominated and hence unusable.
| Quadrant | # 1 sec bins | Bins with >0 counts | Bins with >2000 counts | High rate bins dominated by noise | Noise dominated (total time) | Noise dominated (detector-on time) | Marked lightcurve |
|---|---|---|---|---|---|---|---|
| A | 7270 | 6106 | 20 | 20 | 0.28% | 0.33% | 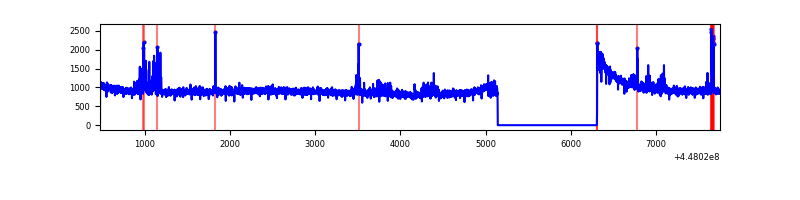 |
| B | 7271 | 6107 | 195 | 195 | 2.68% | 3.19% | 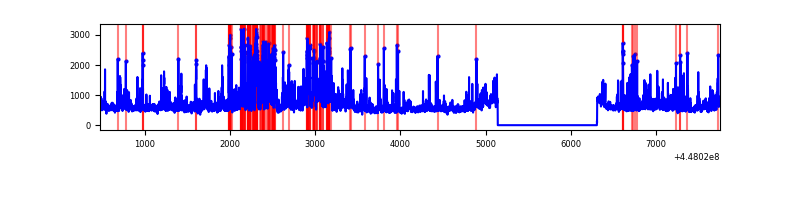 |
| C | 7271 | 6107 | 13 | 13 | 0.18% | 0.21% | 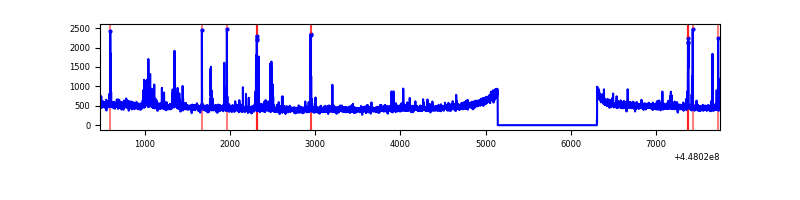 |
| D | 7271 | 6107 | 399 | 399 | 5.49% | 6.53% | 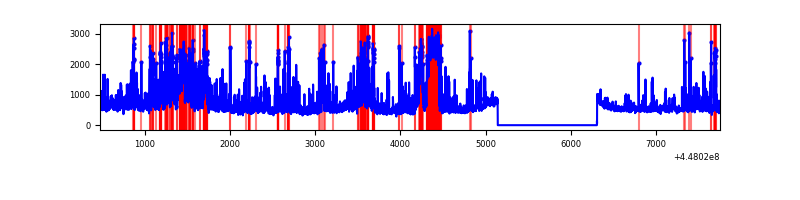 |
Top three noisy pixels from each quadrant. If the there are fewer than three noisy pixels in the level2.evt file, extra rows are filled as -1
| Pixel properties | Quadrant properties | ||||||
|---|---|---|---|---|---|---|---|
| Quadrant | DetID | PixID | Counts | Sigma | Mean | Median | Sigma |
| A | 10 | 83 | 2700949 | 17747.21 | 737 | 723 | 152.1 |
| A | 13 | 248 | 134808 | 881.27 | 737 | 723 | 152.1 |
| A | 14 | 235 | 46800 | 302.84 | 737 | 723 | 152.1 |
| B | 3 | 112 | 1032954 | 7231.72 | 724 | 704 | 142.7 |
| B | 5 | 172 | 394974 | 2762.17 | 724 | 704 | 142.7 |
| B | 5 | 255 | 104324 | 725.94 | 724 | 704 | 142.7 |
| C | 14 | 254 | 123521 | 723.29 | 721 | 725 | 169.8 |
| C | 12 | 2 | 21344 | 121.45 | 721 | 725 | 169.8 |
| C | 11 | 16 | 12088 | 66.93 | 721 | 725 | 169.8 |
| D | 1 | 52 | 1478470 | 8342.36 | 712 | 692 | 177.1 |
| D | 13 | 249 | 294664 | 1659.53 | 712 | 692 | 177.1 |
| D | 2 | 249 | 260065 | 1464.21 | 712 | 692 | 177.1 |
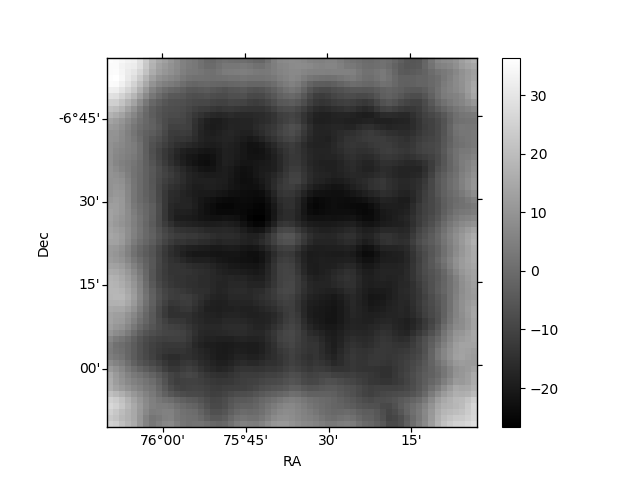
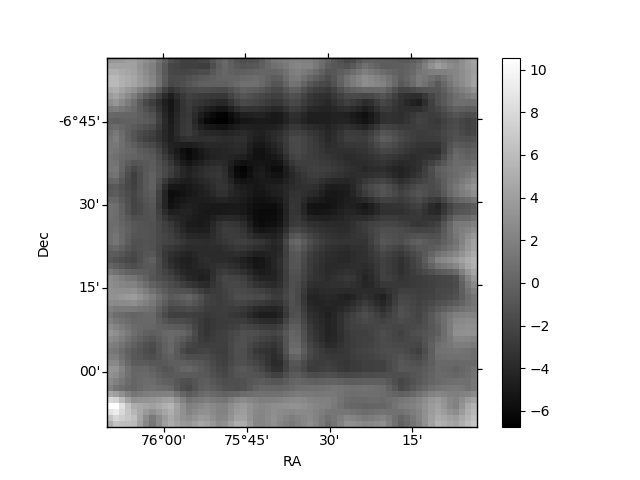
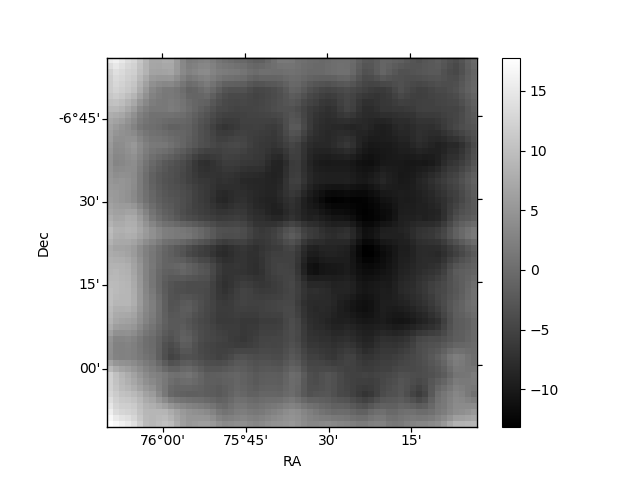
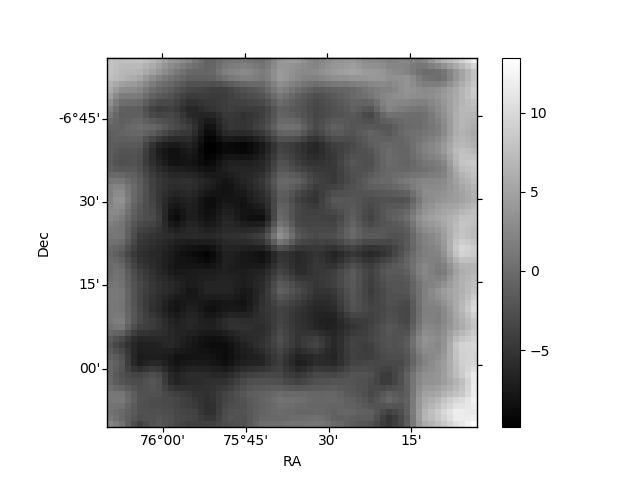
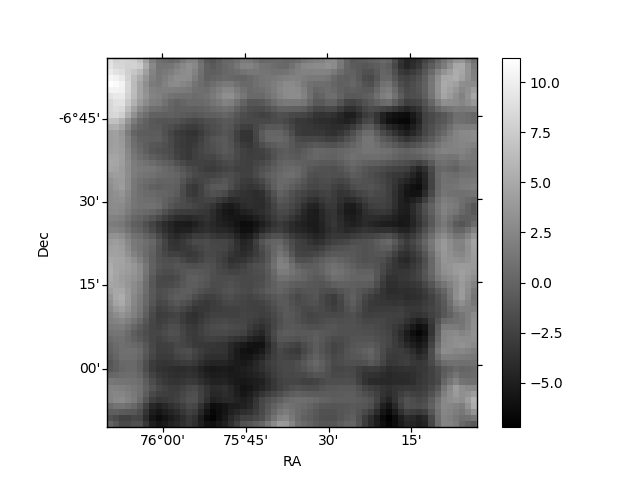
Histogram calculated using DETX and DETY for each event in the final _common_clean file
| Quadrant A | 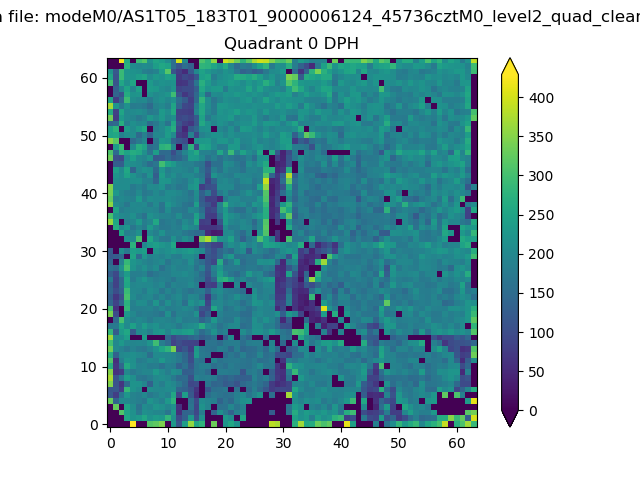 |
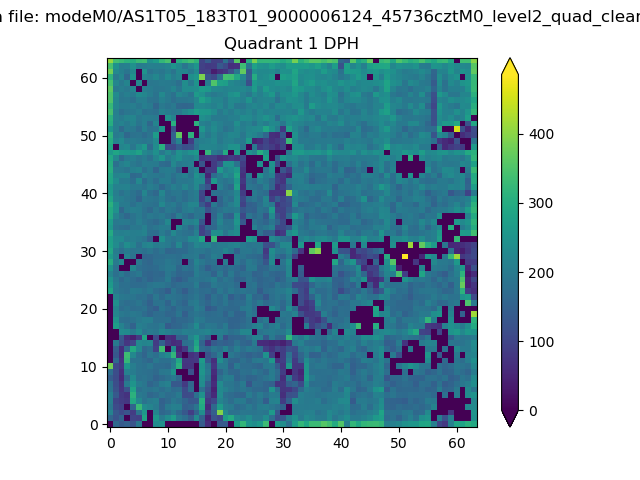 |
Quadrant B |
|---|---|---|---|
| Quadrant D |  |
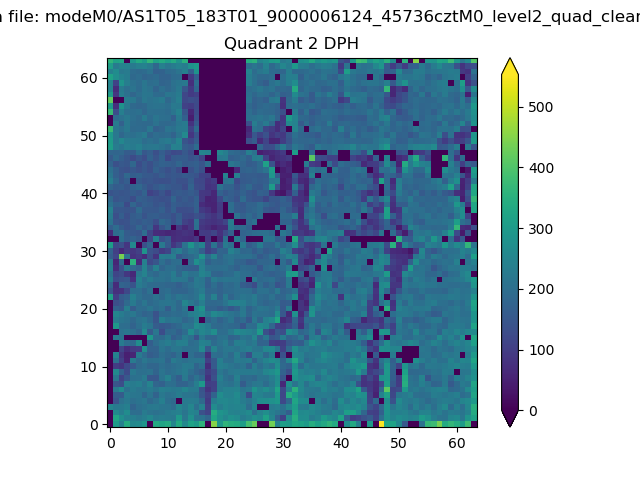 |
Quadrant C |
| Plot type | Count rate plots | Images |
|---|---|---|
| Comparison with Poisson distribution Blue bars denote a histogram of data divided into 1 sec bins. Red curve is a Poisson curve with rate = median count rate of data. |
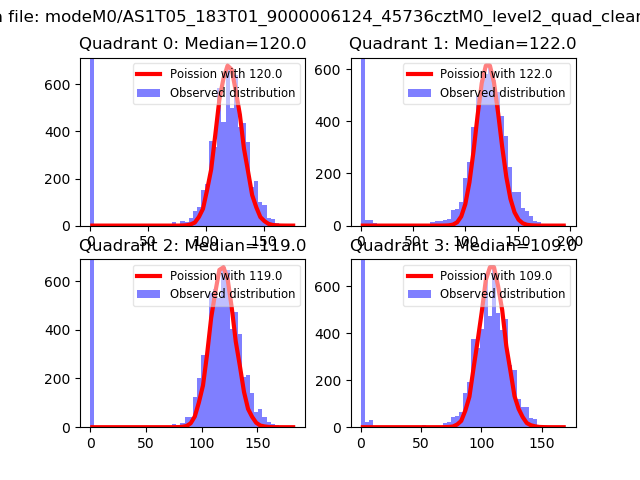 |
 |
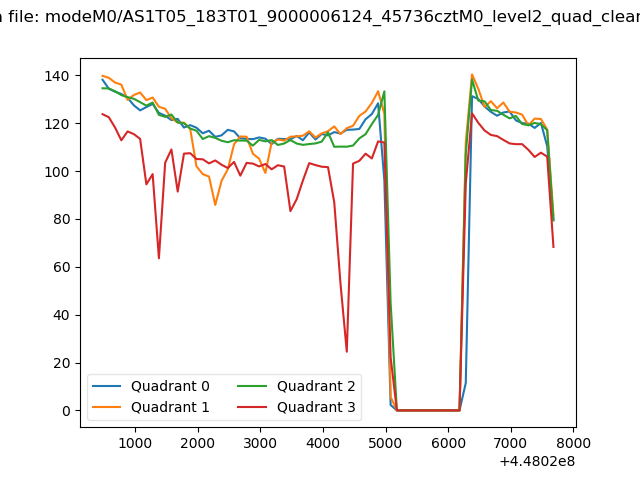
| Quadrant-wise count rates Data is divided into 100 sec bins |
 |
|
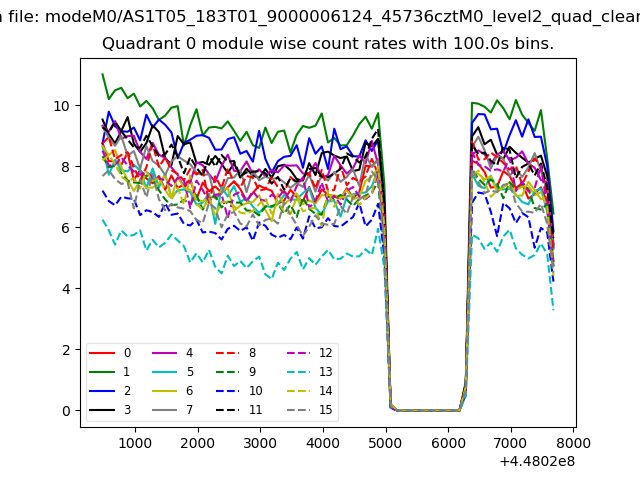
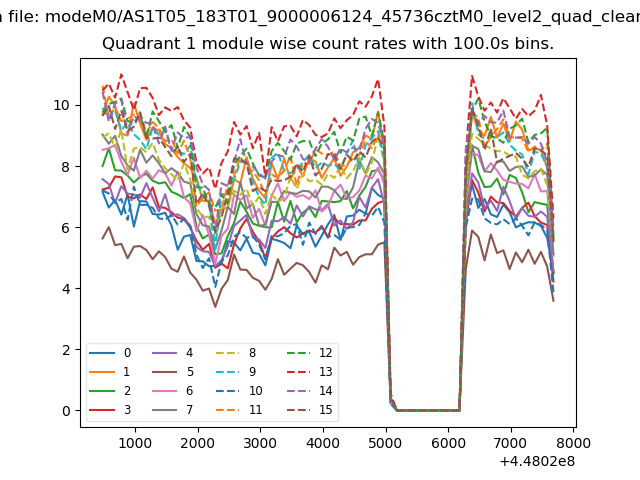
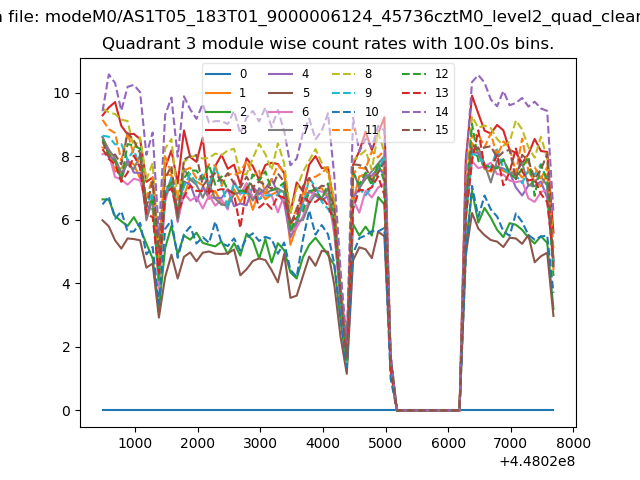
| Module-wise count rates for Quadrant A Data is divided into 100 sec bins |
 |
 |
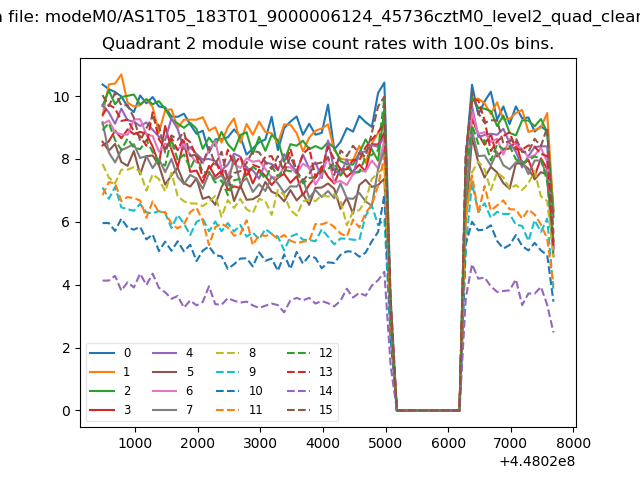
| Module-wise count rates for Quadrant B Data is divided into 100 sec bins |
 |
 |
| Module-wise count rates for Quadrant C Data is divided into 100 sec bins |
 |
 |
| Module-wise count rates for Quadrant D Data is divided into 100 sec bins |
 |
 |
| Parameter | Plot |
|---|---|
| CZT HV Monitor | 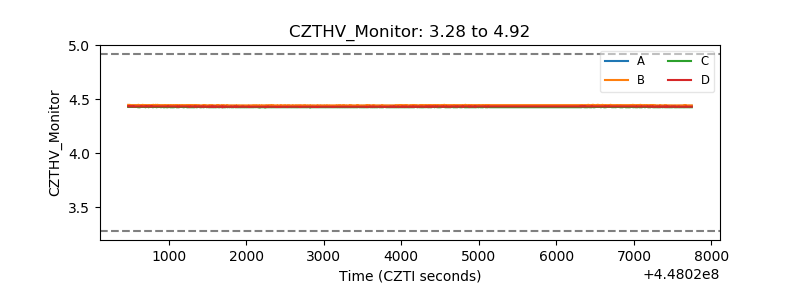 |
| D_VDD | 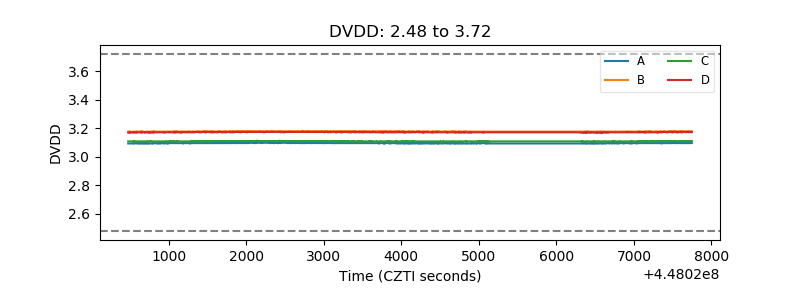 |
| Temperature 1 | 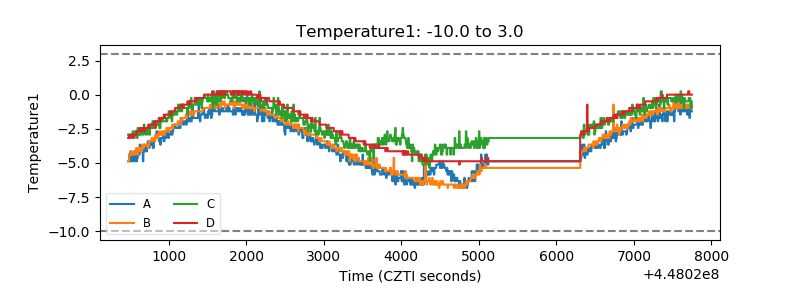 |
| Veto HV Monitor |  |
| Veto LLD | 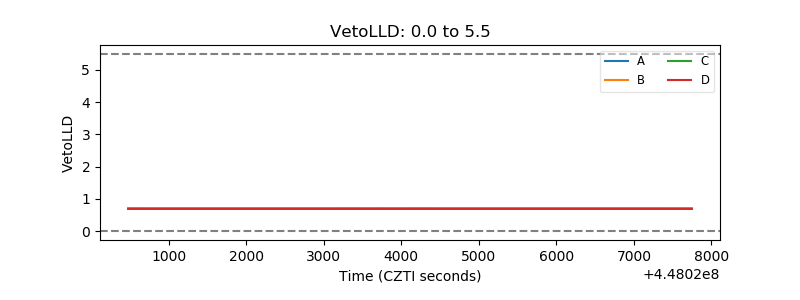 |
| Alpha Counter |  |
| _CPM_Rate | 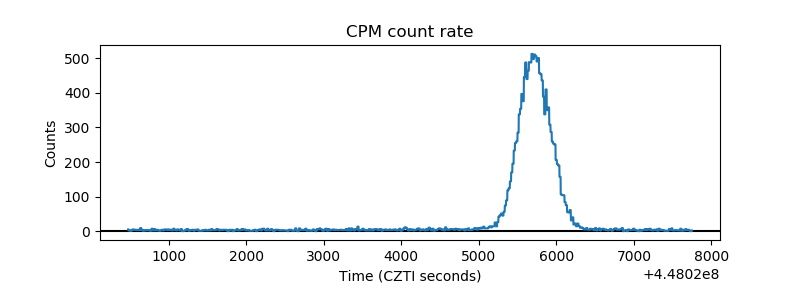 |
| CZT Counter | 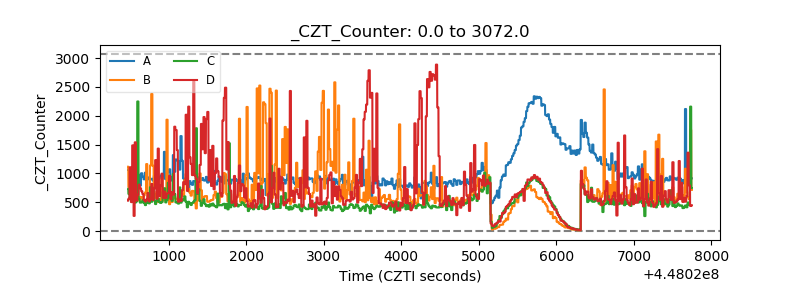 |
| +2.5 Volts monitor | 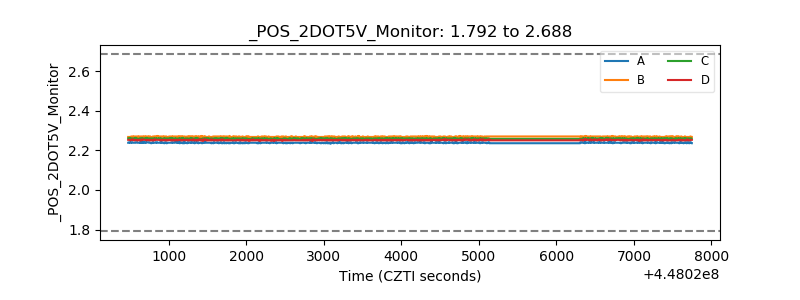 |
| +5 Volts monitor | 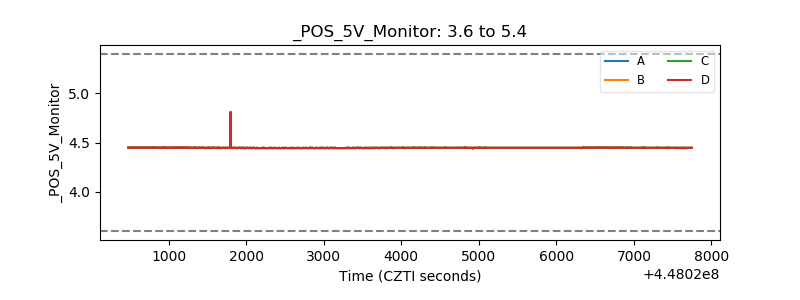 |
| _ROLL_ROT | 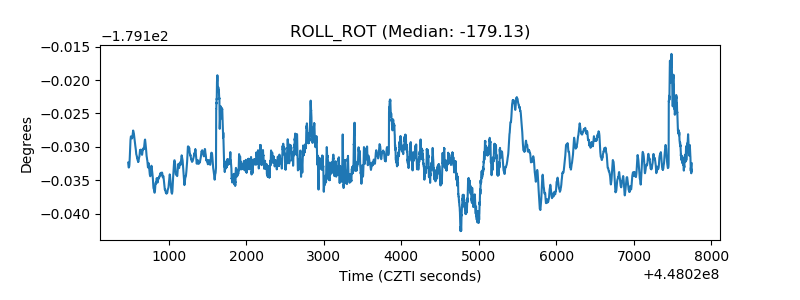 |
| _Roll_DEC | 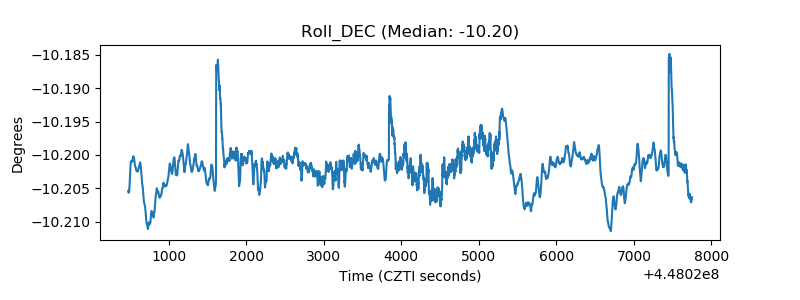 |
| _Roll_RA | 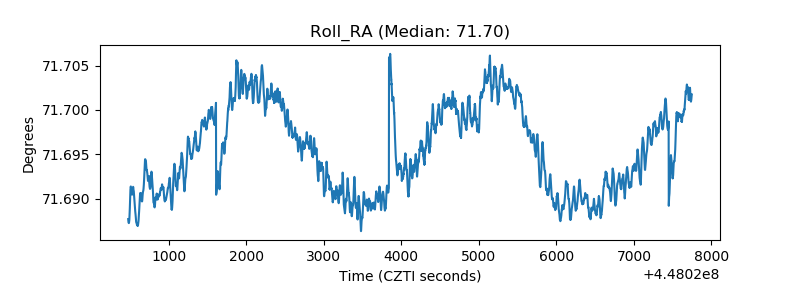 |
| Veto Counter | 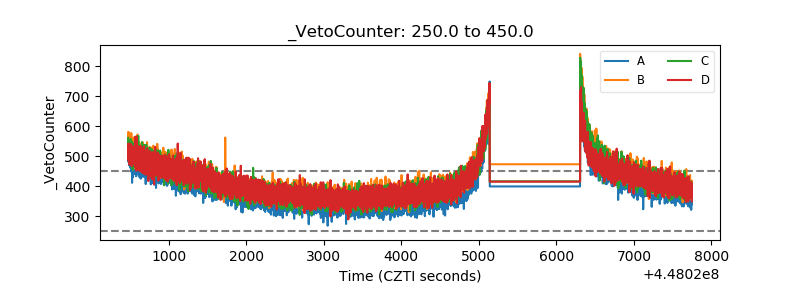 |