| Param | Original file | Final file |
|---|---|---|
| Filename | modeM0/AS1T05_183T01_9000006124_45739cztM0_level2.fits | modeM0/AS1T05_183T01_9000006124_45739cztM0_level2_quad_clean.evt |
| Size (bytes) | 627,609,600 | 128,571,840 |
| Size | 598.5 MB | 122.6 MB |
| Events in quadrant A | 7,512,277 | 851,993 |
| Events in quadrant B | 5,225,507 | 875,531 |
| Events in quadrant C | 4,553,434 | 848,677 |
| Events in quadrant D | 5,331,484 | 769,048 |
| Mode SS | |||
|---|---|---|---|
| Quadrant | BADHDUFLAG | Total packets | Discarded packets |
| A | 0 | 158 | 0 |
| B | 0 | 158 | 0 |
| C | 0 | 158 | 0 |
| D | 0 | 158 | 0 |
| Mode M0 | |||
|---|---|---|---|
| Quadrant | BADHDUFLAG | Total packets | Discarded packets |
| A | 0 | 27735 | 4 |
| B | 0 | 20758 | 1 |
| C | 0 | 19227 | 1 |
| D | 0 | 21278 | 1 |
| Mode M9 | |||
|---|---|---|---|
| Quadrant | BADHDUFLAG | Total packets | Discarded packets |
| A | 1 | 140551912679464 | 140548509794350 |
| B | 1 | -1 | -1 |
| C | 1 | -1 | -1 |
| D | 1 | -1 | -1 |
| Quadrant | Total seconds | Saturated seconds | Saturation percentage |
|---|---|---|---|
| A | 7870 | 299 | 3.799238% |
| B | 7870 | 293 | 3.722999% |
| C | 7870 | 278 | 3.532402% |
| D | 7870 | 310 | 3.939009% |
Noise dominated data is calculated using 1-second bins in cleaned event files. If a bin has >2000 counts, and if more than 50% of those come from <1% of pixels, then it is considered to be noise-dominated and hence unusable.
| Quadrant | # 1 sec bins | Bins with >0 counts | Bins with >2000 counts | High rate bins dominated by noise | Noise dominated (total time) | Noise dominated (detector-on time) | Marked lightcurve |
|---|---|---|---|---|---|---|---|
| A | 7870 | 7870 | 13 | 13 | 0.17% | 0.17% | 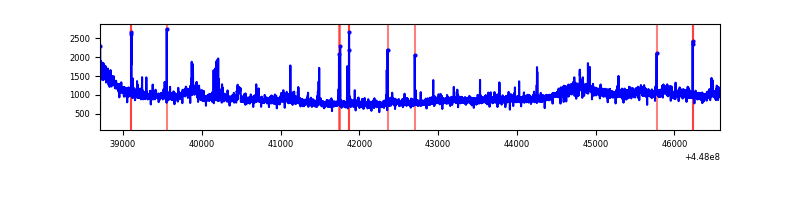 |
| B | 7870 | 7870 | 76 | 76 | 0.97% | 0.97% | 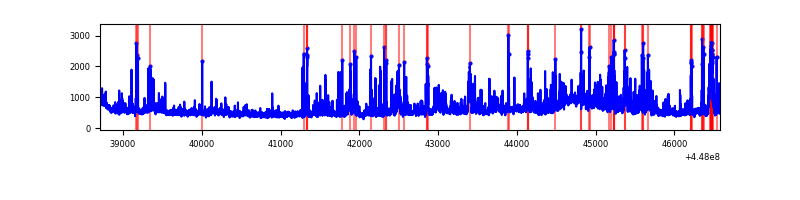 |
| C | 7870 | 7870 | 189 | 189 | 2.40% | 2.40% | 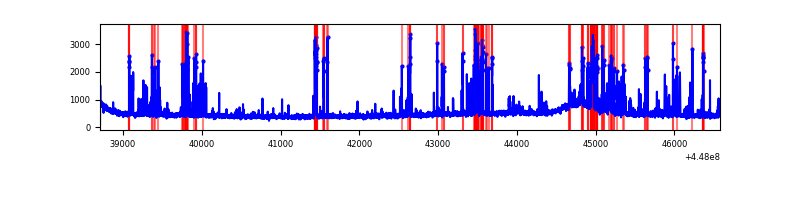 |
| D | 7870 | 7870 | 248 | 248 | 3.15% | 3.15% | 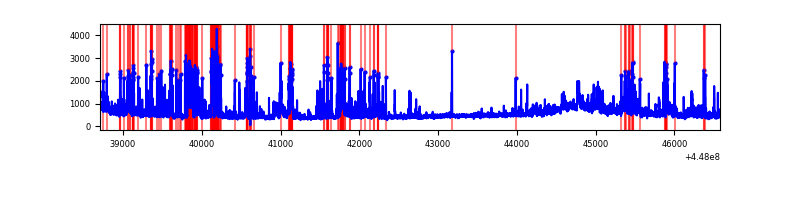 |
Top three noisy pixels from each quadrant. If the there are fewer than three noisy pixels in the level2.evt file, extra rows are filled as -1
| Pixel properties | Quadrant properties | ||||||
|---|---|---|---|---|---|---|---|
| Quadrant | DetID | PixID | Counts | Sigma | Mean | Median | Sigma |
| A | 10 | 83 | 3603381 | 18527.85 | 924 | 904 | 194.4 |
| A | 12 | 189 | 151482 | 774.44 | 924 | 904 | 194.4 |
| A | 13 | 248 | 63620 | 322.55 | 924 | 904 | 194.4 |
| B | 3 | 112 | 578108 | 3117.93 | 923 | 895 | 185.1 |
| B | 4 | 171 | 412630 | 2224.06 | 923 | 895 | 185.1 |
| B | 5 | 172 | 112804 | 604.5 | 923 | 895 | 185.1 |
| C | 14 | 254 | 436877 | 2035.32 | 902 | 909 | 214.2 |
| C | 12 | 2 | 427702 | 1992.48 | 902 | 909 | 214.2 |
| C | 2 | 14 | 43275 | 197.79 | 902 | 909 | 214.2 |
| D | 1 | 52 | 1081293 | 4661.9 | 905 | 874 | 231.8 |
| D | 1 | 47 | 194605 | 835.93 | 905 | 874 | 231.8 |
| D | 13 | 249 | 168315 | 722.49 | 905 | 874 | 231.8 |
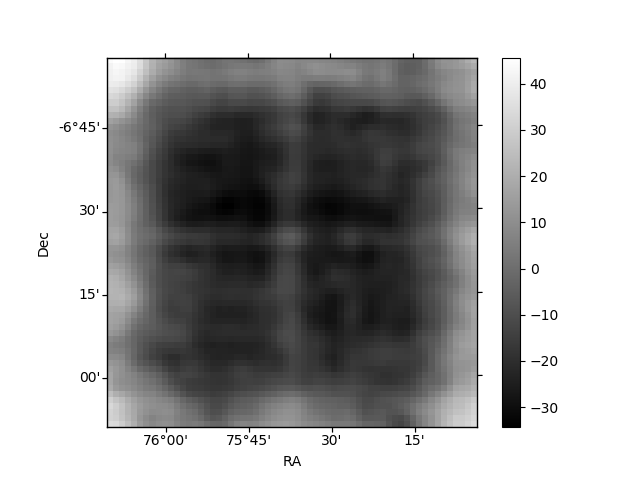
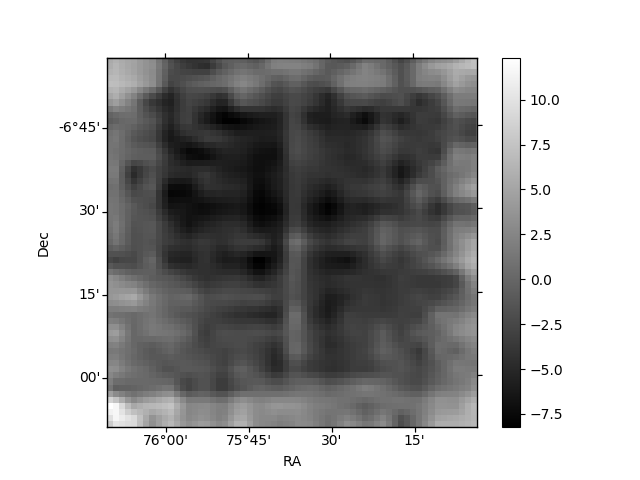
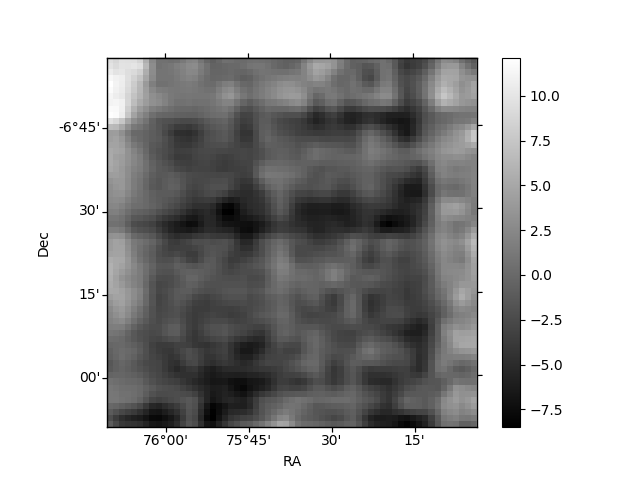
Histogram calculated using DETX and DETY for each event in the final _common_clean file
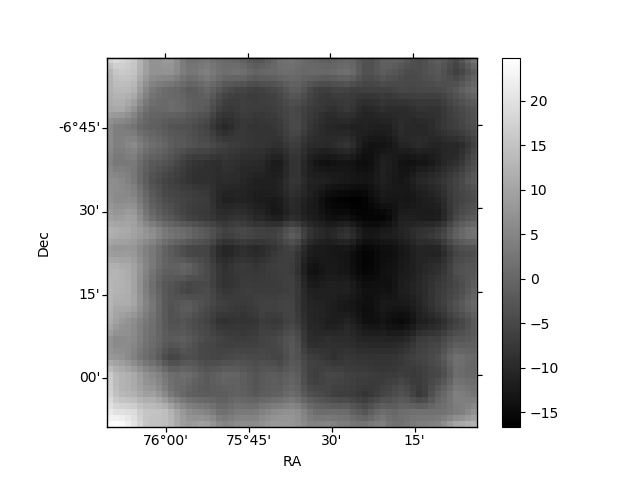
| Quadrant A | 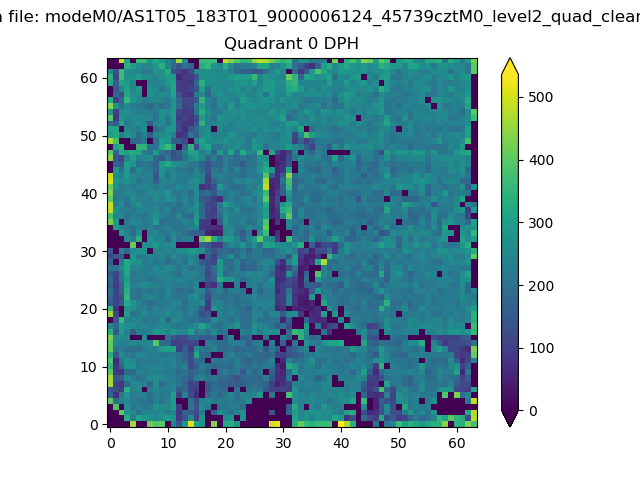 |
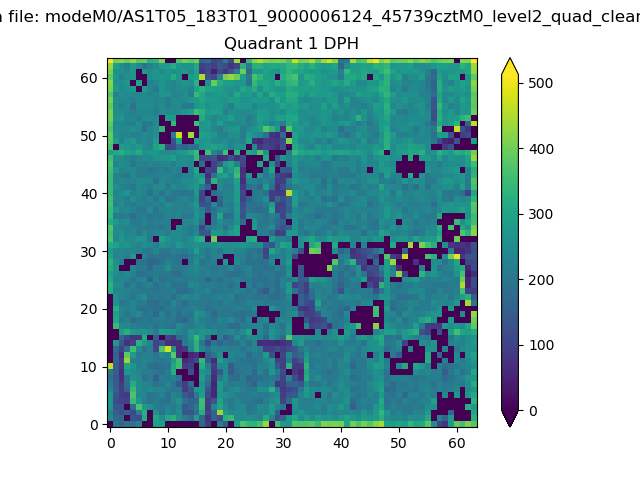 |
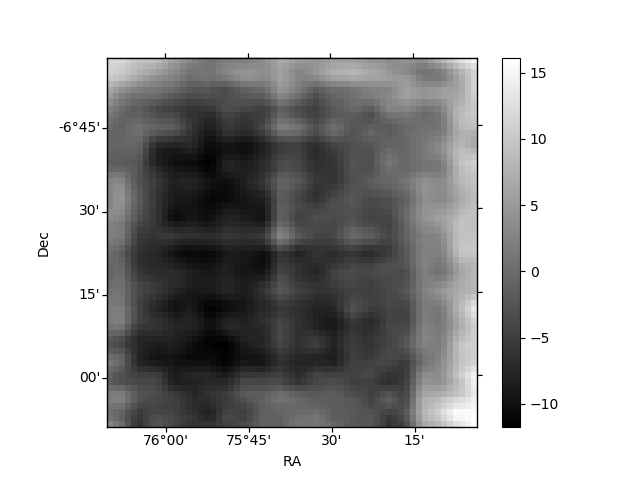
Quadrant B |
|---|---|---|---|
| Quadrant D | 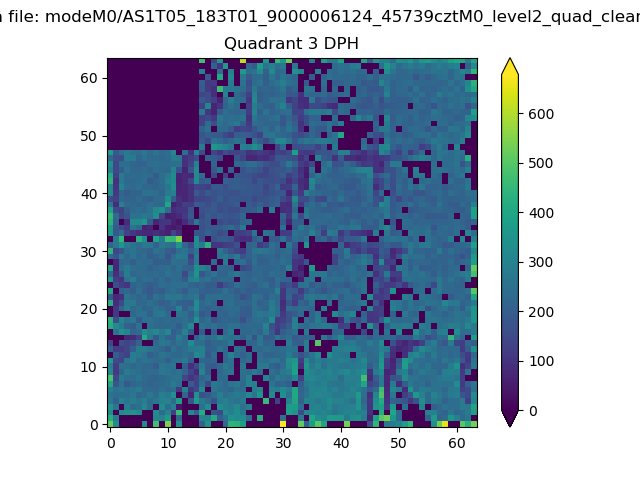 |
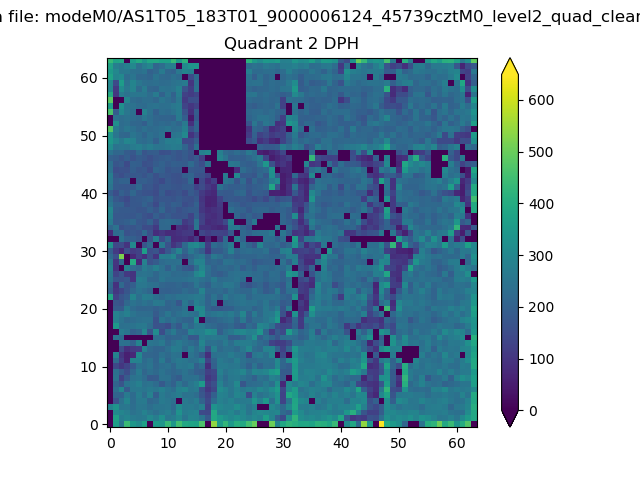 |
Quadrant C |
| Plot type | Count rate plots | Images |
|---|---|---|
| Comparison with Poisson distribution Blue bars denote a histogram of data divided into 1 sec bins. Red curve is a Poisson curve with rate = median count rate of data. |
 |
 |
| Quadrant-wise count rates Data is divided into 100 sec bins |
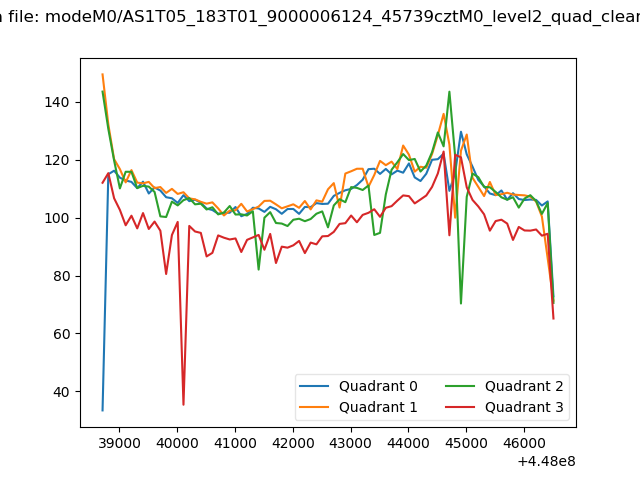 |
|
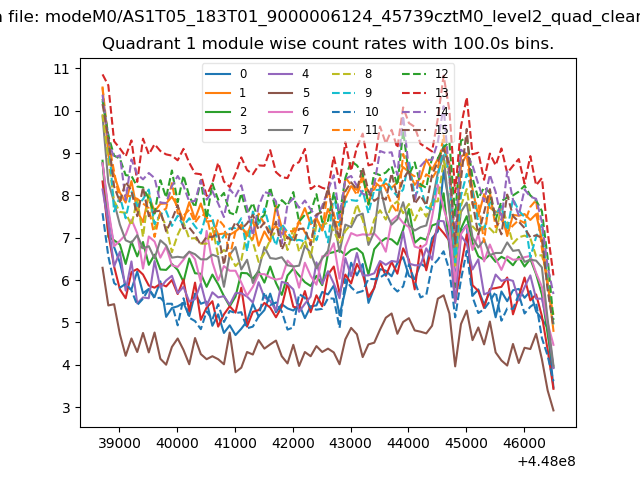
| Module-wise count rates for Quadrant A Data is divided into 100 sec bins |
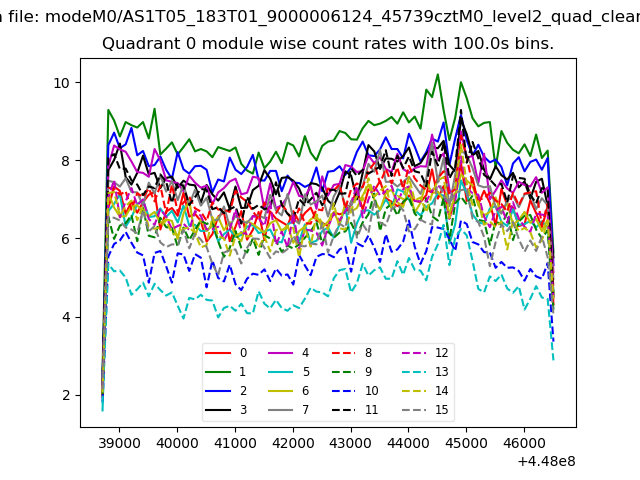 |
 |
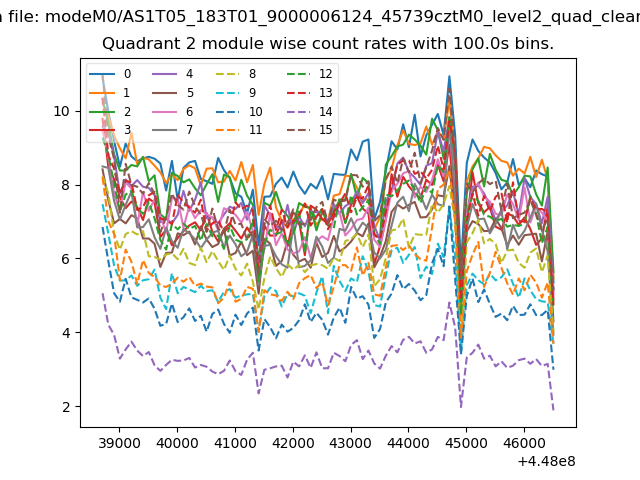
| Module-wise count rates for Quadrant B Data is divided into 100 sec bins |
 |
 |
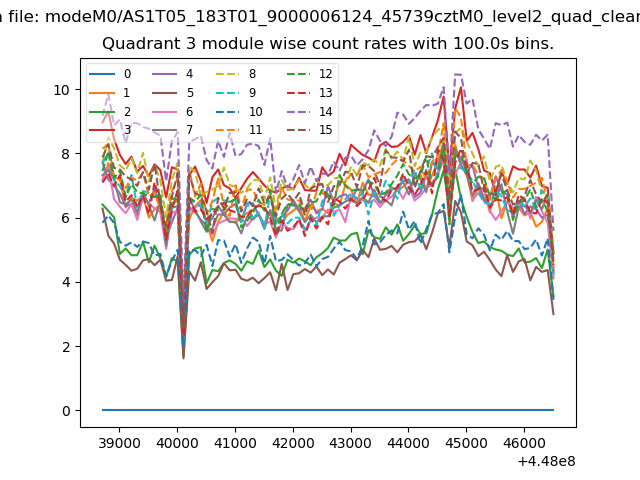
| Module-wise count rates for Quadrant C Data is divided into 100 sec bins |
 |
 |
| Module-wise count rates for Quadrant D Data is divided into 100 sec bins |
 |
 |
| Parameter | Plot |
|---|---|
| CZT HV Monitor | 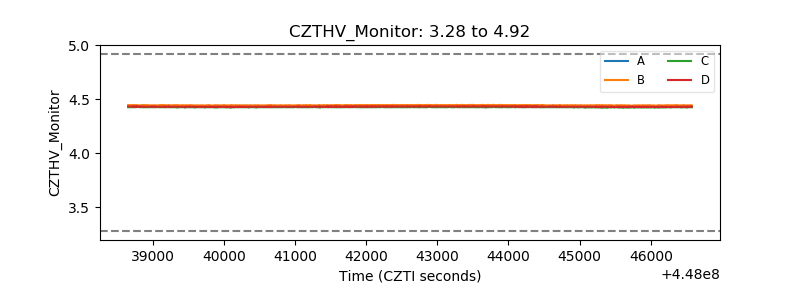 |
| D_VDD | 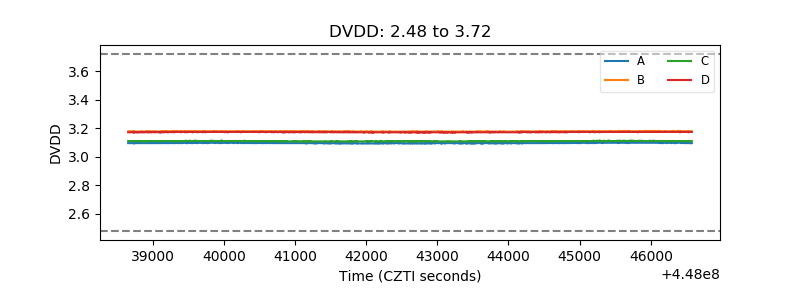 |
| Temperature 1 | 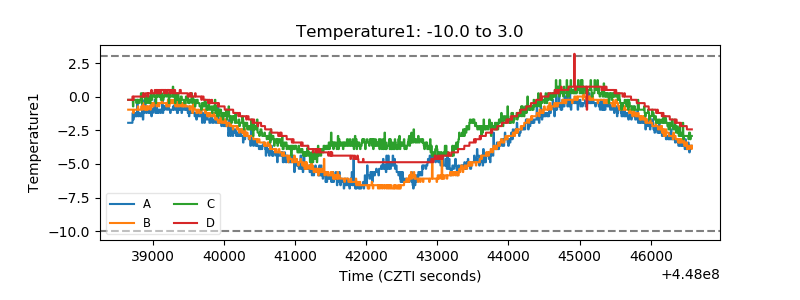 |
| Veto HV Monitor | 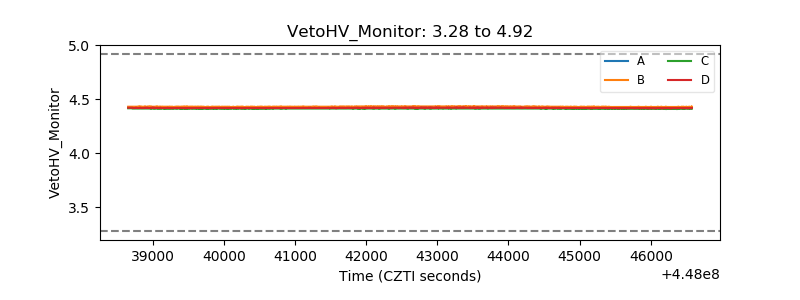 |
| Veto LLD | 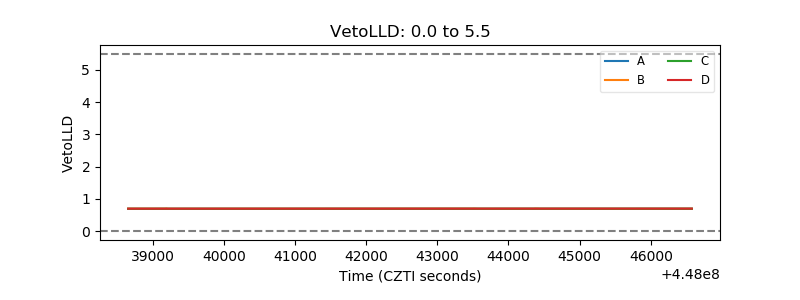 |
| Alpha Counter | 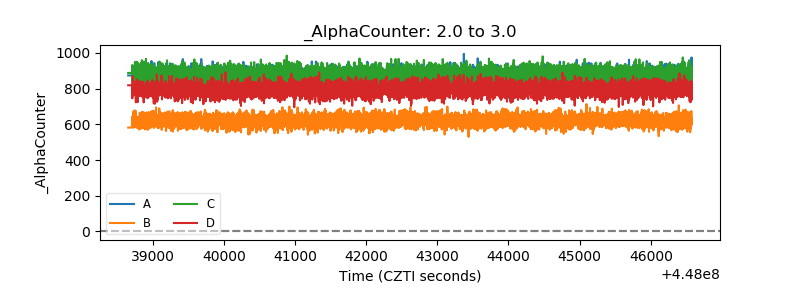 |
| _CPM_Rate | 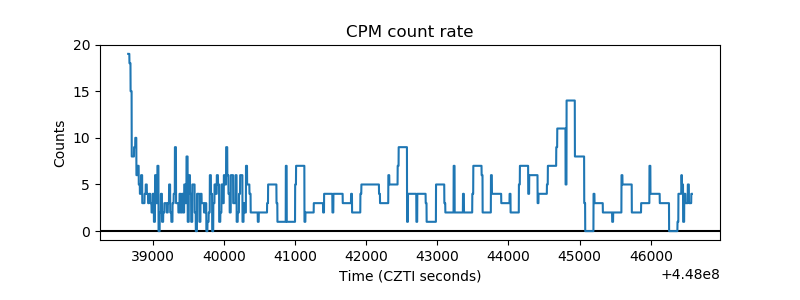 |
| CZT Counter | 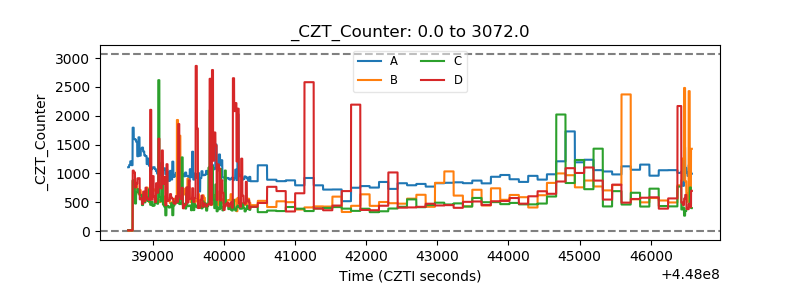 |
| +2.5 Volts monitor | 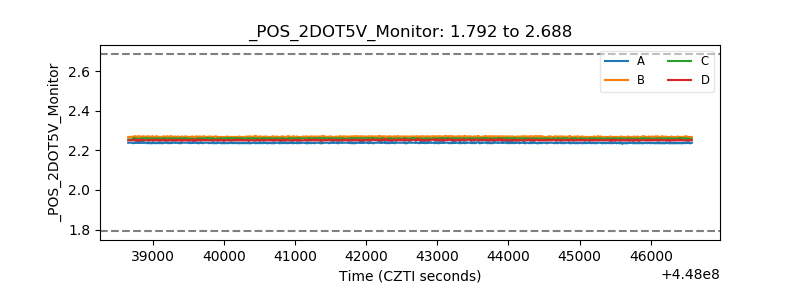 |
| +5 Volts monitor | 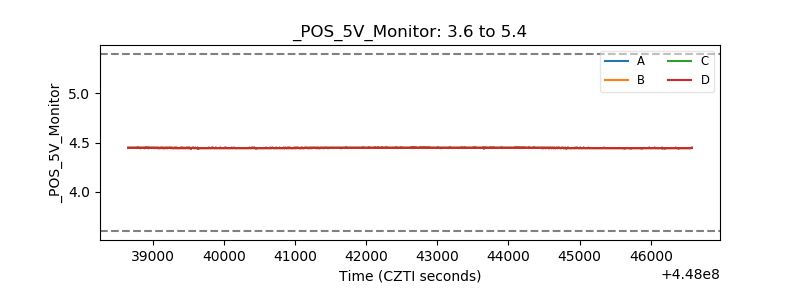 |
| _ROLL_ROT | 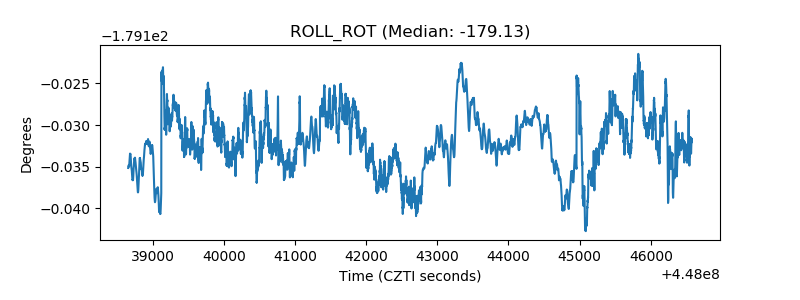 |
| _Roll_DEC | 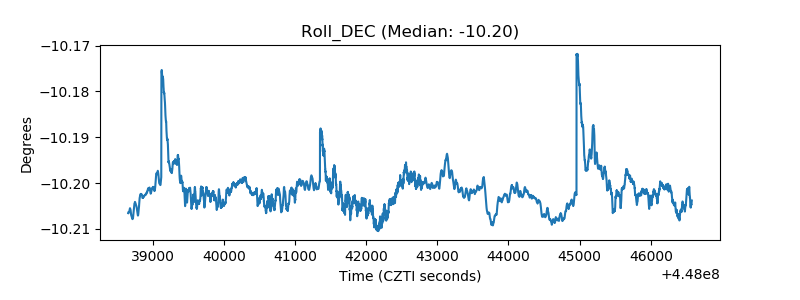 |
| _Roll_RA | 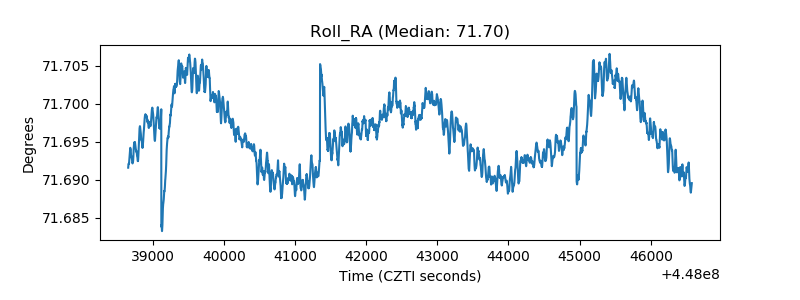 |
| Veto Counter | 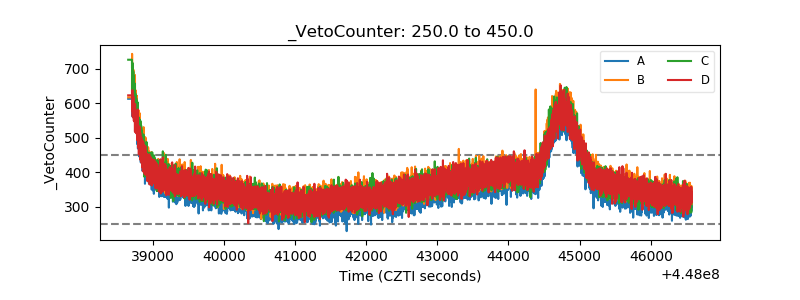 |