| Param | Original file | Final file |
|---|---|---|
| Filename | modeM0/AS1T05_183T01_9000006124_45740cztM0_level2.fits | modeM0/AS1T05_183T01_9000006124_45740cztM0_level2_quad_clean.evt |
| Size (bytes) | 614,543,040 | 126,869,760 |
| Size | 586.1 MB | 121.0 MB |
| Events in quadrant A | 7,440,938 | 846,350 |
| Events in quadrant B | 5,218,520 | 851,267 |
| Events in quadrant C | 4,434,337 | 830,073 |
| Events in quadrant D | 5,046,605 | 766,986 |
| Mode SS | |||
|---|---|---|---|
| Quadrant | BADHDUFLAG | Total packets | Discarded packets |
| A | 0 | 158 | 0 |
| B | 0 | 158 | 0 |
| C | 0 | 158 | 0 |
| D | 0 | 158 | 0 |
| Mode M0 | |||
|---|---|---|---|
| Quadrant | BADHDUFLAG | Total packets | Discarded packets |
| A | 0 | 27735 | 2 |
| B | 0 | 20625 | 0 |
| C | 0 | 18715 | 0 |
| D | 0 | 20347 | 0 |
| Quadrant | Total seconds | Saturated seconds | Saturation percentage |
|---|---|---|---|
| A | 7855 | 106 | 1.349459% |
| B | 7855 | 283 | 3.602801% |
| C | 7855 | 244 | 3.106302% |
| D | 7855 | 149 | 1.896881% |
Noise dominated data is calculated using 1-second bins in cleaned event files. If a bin has >2000 counts, and if more than 50% of those come from <1% of pixels, then it is considered to be noise-dominated and hence unusable.
| Quadrant | # 1 sec bins | Bins with >0 counts | Bins with >2000 counts | High rate bins dominated by noise | Noise dominated (total time) | Noise dominated (detector-on time) | Marked lightcurve |
|---|---|---|---|---|---|---|---|
| A | 7855 | 7855 | 36 | 36 | 0.46% | 0.46% | 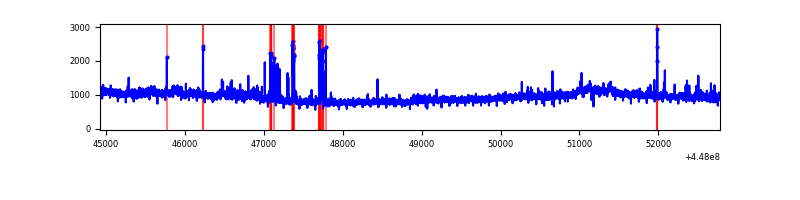 |
| B | 7855 | 7855 | 149 | 149 | 1.90% | 1.90% | 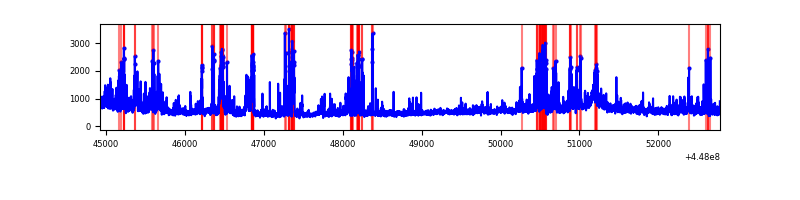 |
| C | 7855 | 7855 | 185 | 185 | 2.36% | 2.36% | 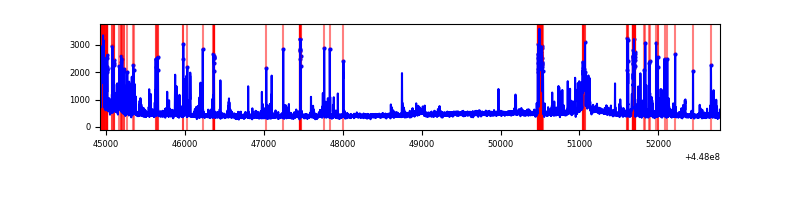 |
| D | 7855 | 7855 | 123 | 123 | 1.57% | 1.57% | 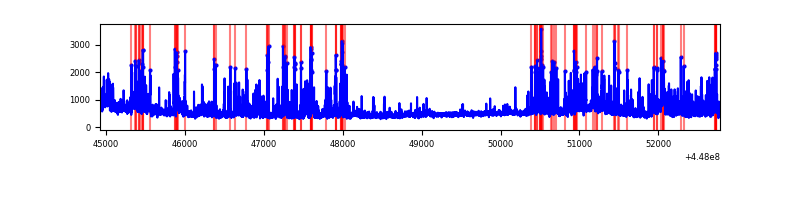 |
Top three noisy pixels from each quadrant. If the there are fewer than three noisy pixels in the level2.evt file, extra rows are filled as -1
| Pixel properties | Quadrant properties | ||||||
|---|---|---|---|---|---|---|---|
| Quadrant | DetID | PixID | Counts | Sigma | Mean | Median | Sigma |
| A | 10 | 83 | 3595044 | 19051.55 | 895 | 877 | 188.7 |
| A | 14 | 235 | 143634 | 756.71 | 895 | 877 | 188.7 |
| A | 12 | 189 | 115919 | 609.8 | 895 | 877 | 188.7 |
| B | 3 | 112 | 658648 | 3766.11 | 888 | 861 | 174.7 |
| B | 5 | 172 | 280204 | 1599.36 | 888 | 861 | 174.7 |
| B | 5 | 255 | 212217 | 1210.1 | 888 | 861 | 174.7 |
| C | 14 | 254 | 485126 | 2357.06 | 872 | 879 | 205.4 |
| C | 12 | 2 | 345359 | 1676.75 | 872 | 879 | 205.4 |
| C | 15 | 208 | 76249 | 366.86 | 872 | 879 | 205.4 |
| D | 1 | 52 | 566262 | 2537.21 | 877 | 849 | 222.8 |
| D | 13 | 249 | 253258 | 1132.65 | 877 | 849 | 222.8 |
| D | 2 | 249 | 182814 | 816.54 | 877 | 849 | 222.8 |
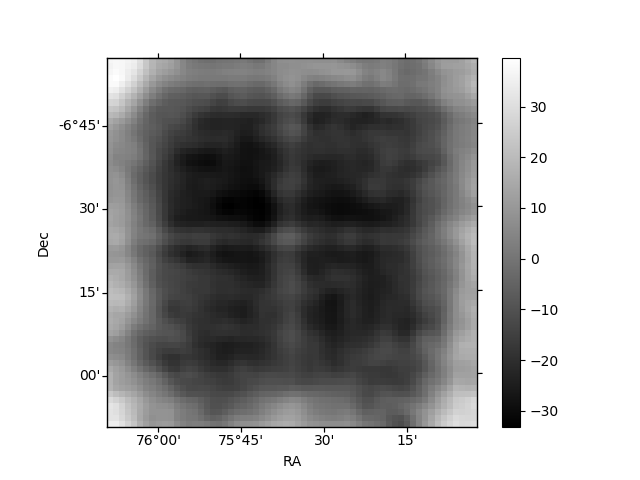
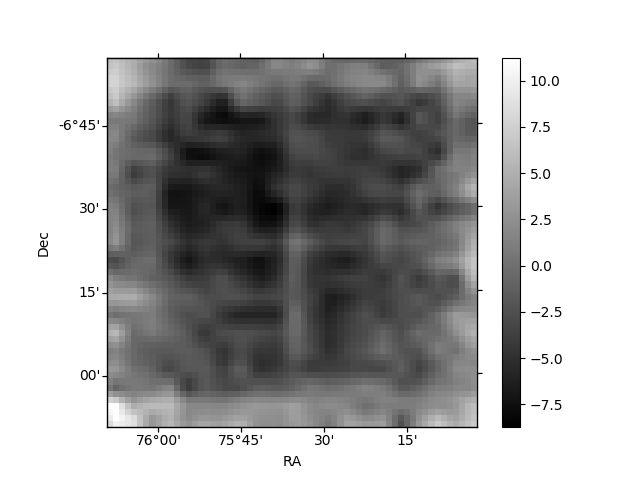
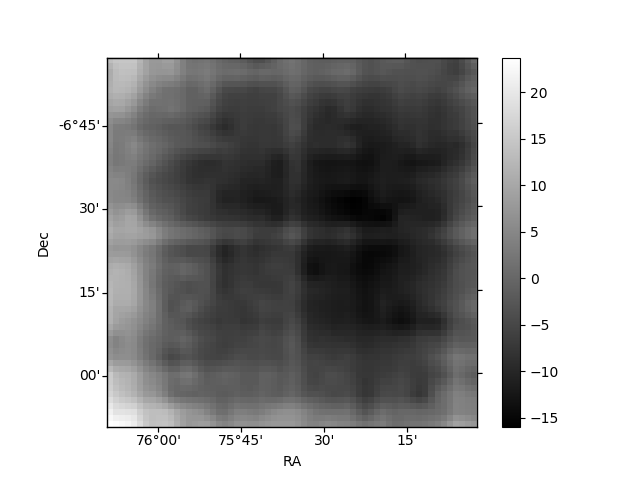
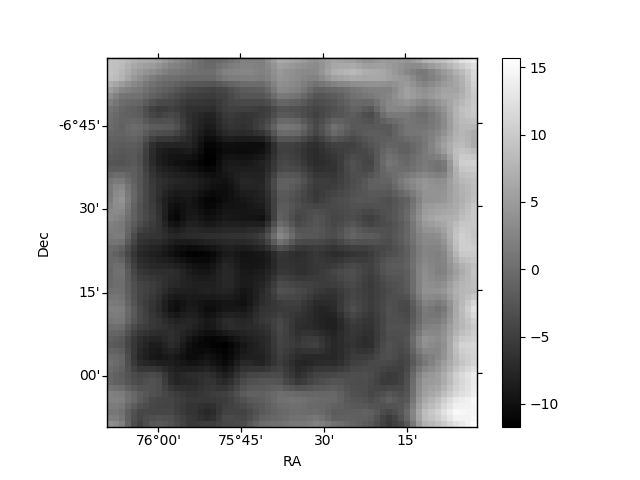
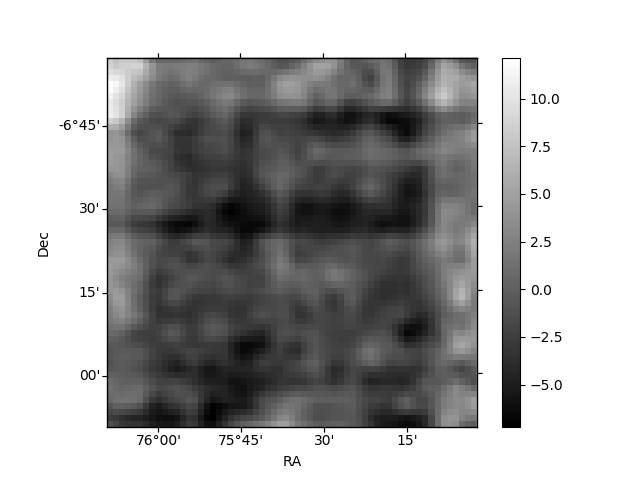
Histogram calculated using DETX and DETY for each event in the final _common_clean file
| Quadrant A | 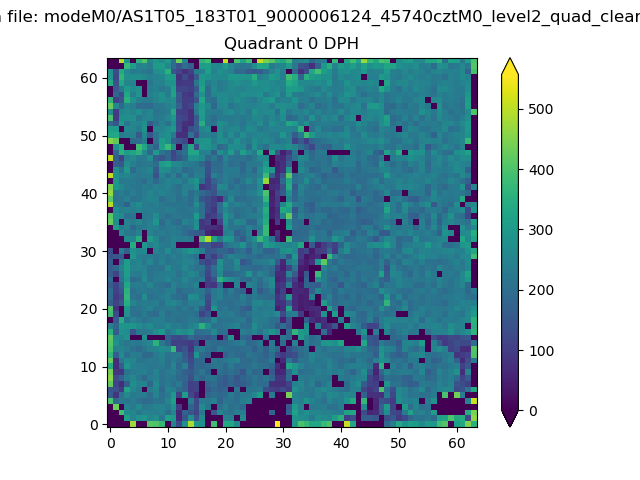 |
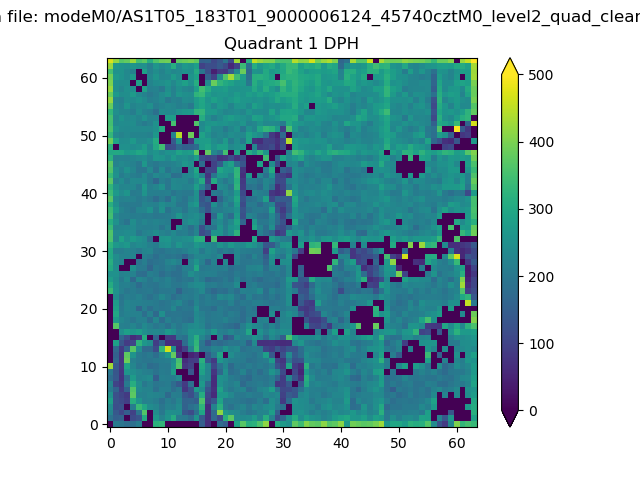 |
Quadrant B |
|---|---|---|---|
| Quadrant D | 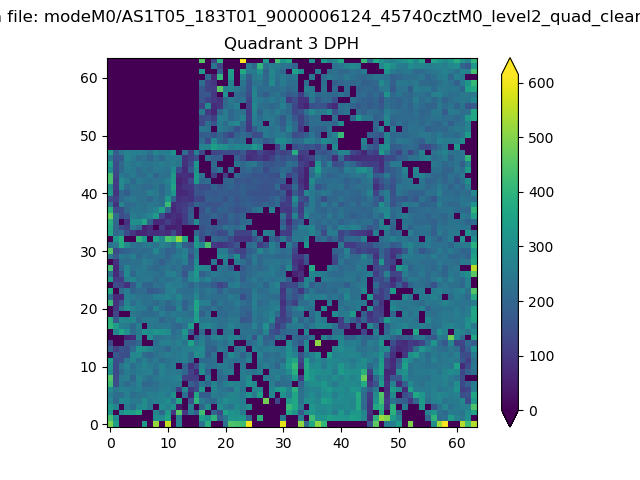 |
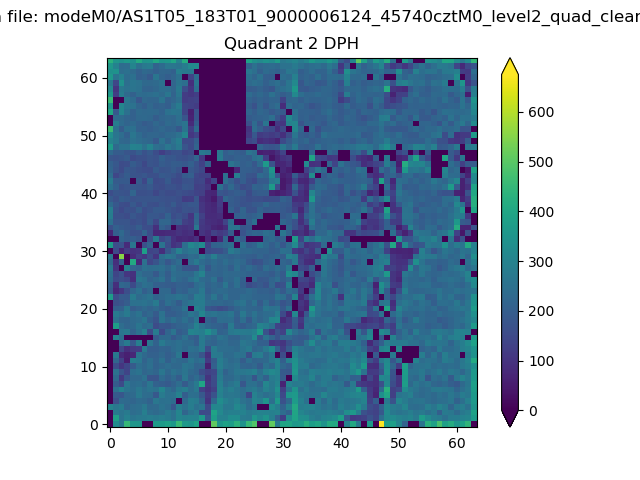 |
Quadrant C |
| Plot type | Count rate plots | Images |
|---|---|---|
| Comparison with Poisson distribution Blue bars denote a histogram of data divided into 1 sec bins. Red curve is a Poisson curve with rate = median count rate of data. |
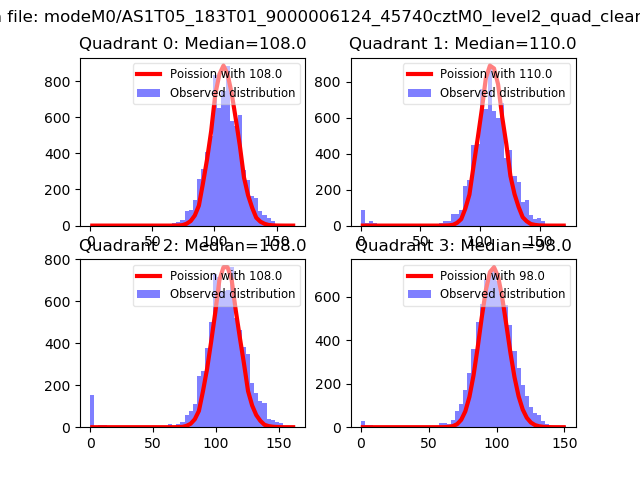 |
 |
| Quadrant-wise count rates Data is divided into 100 sec bins |
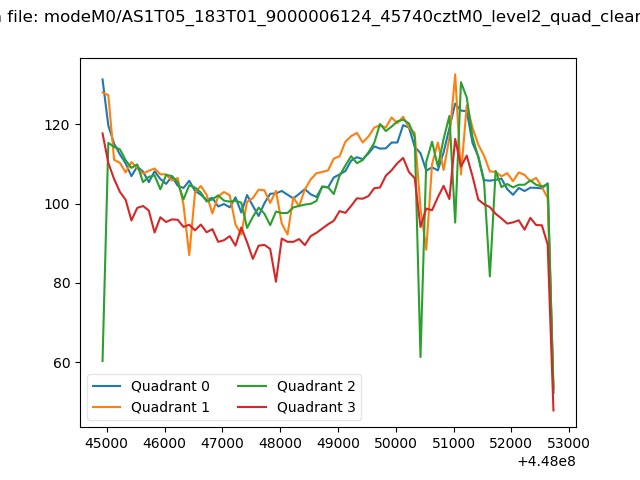 |
|
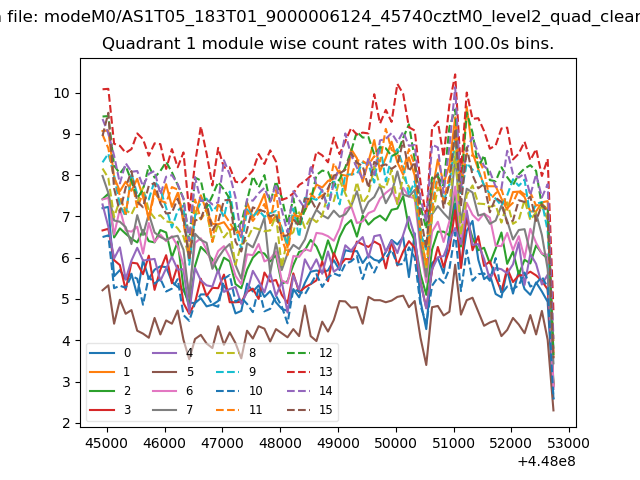
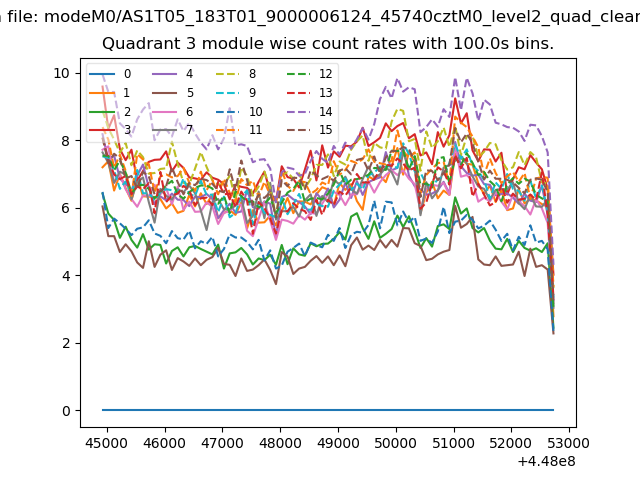
| Module-wise count rates for Quadrant A Data is divided into 100 sec bins |
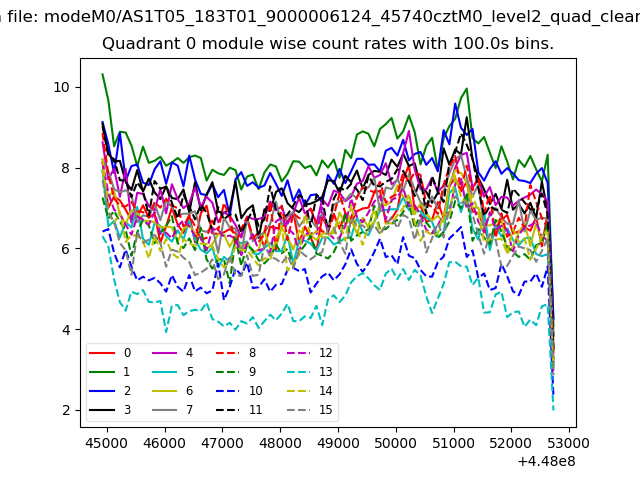 |
 |
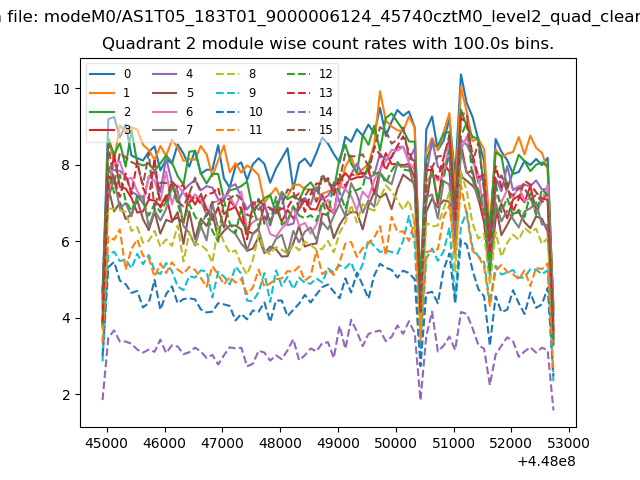
| Module-wise count rates for Quadrant B Data is divided into 100 sec bins |
 |
 |
| Module-wise count rates for Quadrant C Data is divided into 100 sec bins |
 |
 |
| Module-wise count rates for Quadrant D Data is divided into 100 sec bins |
 |
 |
| Parameter | Plot |
|---|---|
| CZT HV Monitor | 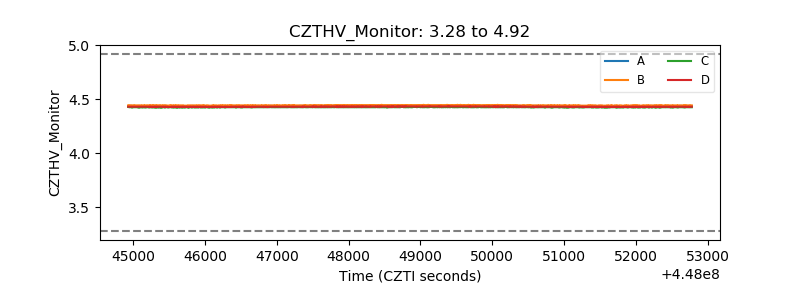 |
| D_VDD | 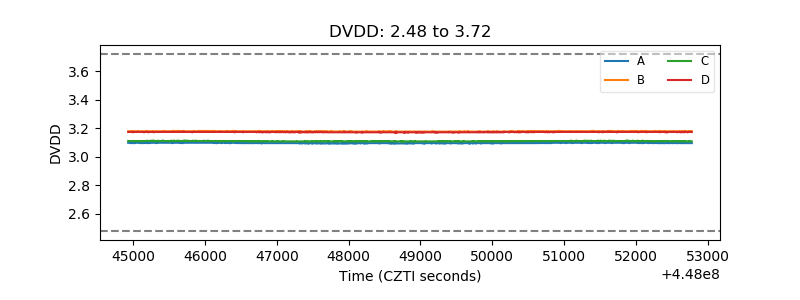 |
| Temperature 1 | 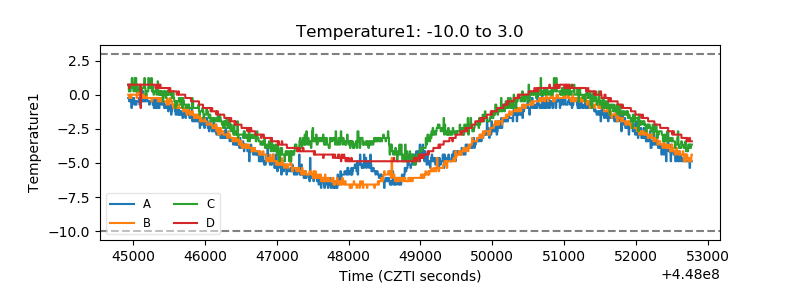 |
| Veto HV Monitor | 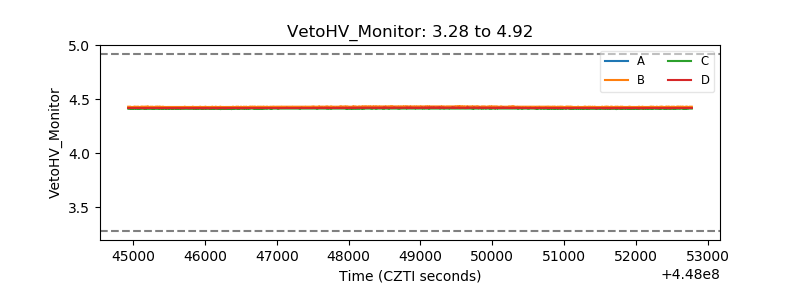 |
| Veto LLD | 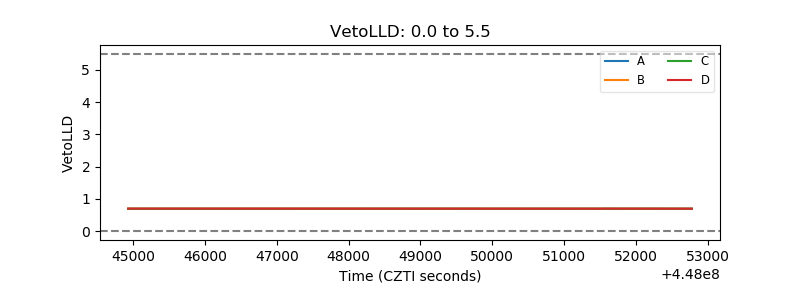 |
| Alpha Counter | 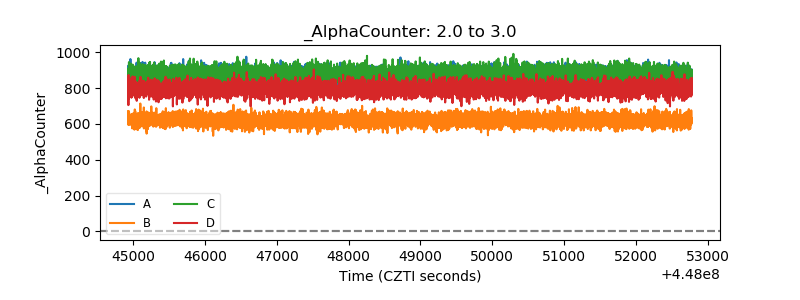 |
| _CPM_Rate | 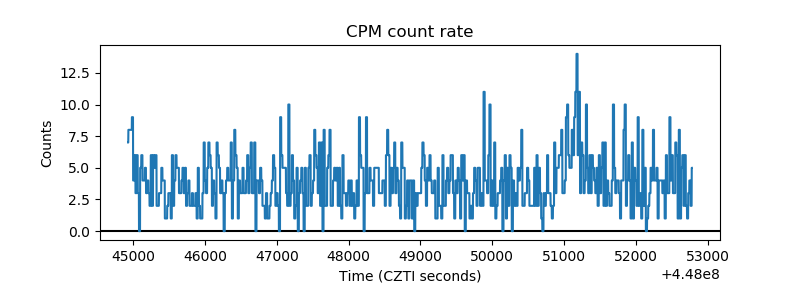 |
| CZT Counter | 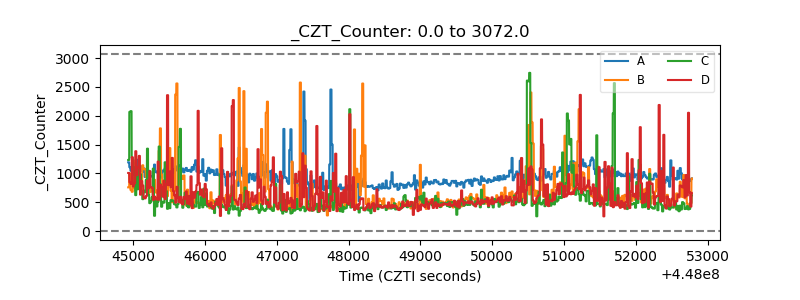 |
| +2.5 Volts monitor | 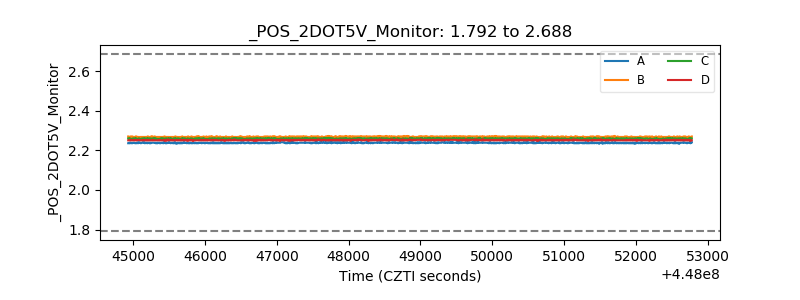 |
| +5 Volts monitor | 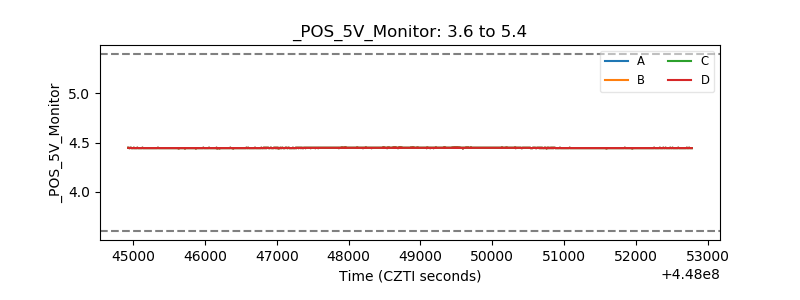 |
| _ROLL_ROT | 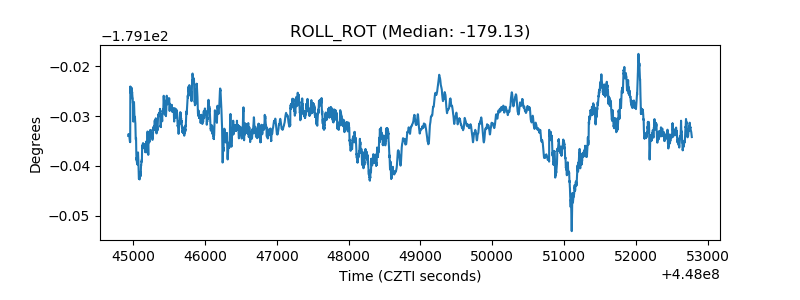 |
| _Roll_DEC | 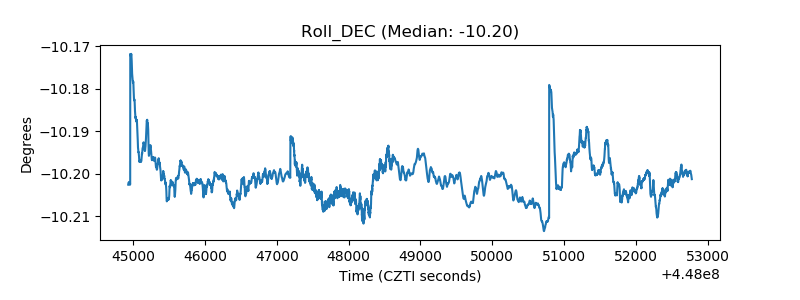 |
| _Roll_RA | 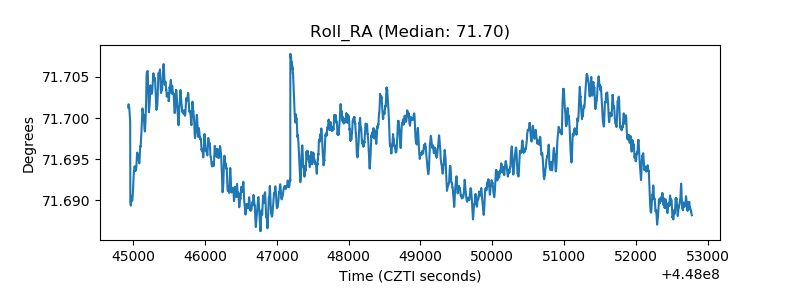 |
| Veto Counter | 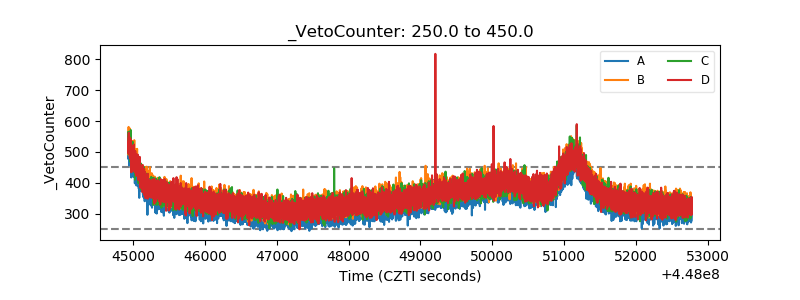 |