| Param | Original file | Final file |
|---|---|---|
| Filename | modeM0/AS1T05_183T01_9000006124_45741cztM0_level2.fits | modeM0/AS1T05_183T01_9000006124_45741cztM0_level2_quad_clean.evt |
| Size (bytes) | 604,903,680 | 124,663,680 |
| Size | 576.9 MB | 118.9 MB |
| Events in quadrant A | 7,037,472 | 827,763 |
| Events in quadrant B | 5,365,900 | 831,727 |
| Events in quadrant C | 3,877,784 | 833,258 |
| Events in quadrant D | 5,506,560 | 739,203 |
| Mode SS | |||
|---|---|---|---|
| Quadrant | BADHDUFLAG | Total packets | Discarded packets |
| A | 0 | 156 | 0 |
| B | 0 | 156 | 0 |
| C | 0 | 156 | 0 |
| D | 0 | 156 | 0 |
| Mode M0 | |||
|---|---|---|---|
| Quadrant | BADHDUFLAG | Total packets | Discarded packets |
| A | 0 | 26161 | 0 |
| B | 0 | 21078 | 0 |
| C | 0 | 17184 | 0 |
| D | 0 | 21799 | 0 |
| Quadrant | Total seconds | Saturated seconds | Saturation percentage |
|---|---|---|---|
| A | 7797 | 159 | 2.039246% |
| B | 7797 | 342 | 4.386302% |
| C | 7798 | 99 | 1.269556% |
| D | 7797 | 349 | 4.476081% |
Noise dominated data is calculated using 1-second bins in cleaned event files. If a bin has >2000 counts, and if more than 50% of those come from <1% of pixels, then it is considered to be noise-dominated and hence unusable.
| Quadrant | # 1 sec bins | Bins with >0 counts | Bins with >2000 counts | High rate bins dominated by noise | Noise dominated (total time) | Noise dominated (detector-on time) | Marked lightcurve |
|---|---|---|---|---|---|---|---|
| A | 7797 | 7797 | 13 | 13 | 0.17% | 0.17% | 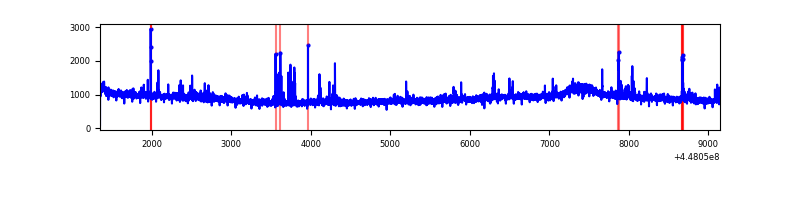 |
| B | 7797 | 7797 | 145 | 145 | 1.86% | 1.86% | 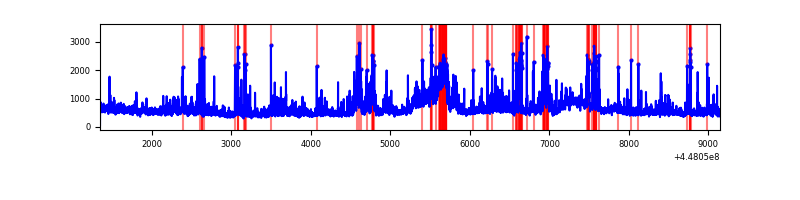 |
| C | 7798 | 7798 | 77 | 77 | 0.99% | 0.99% | 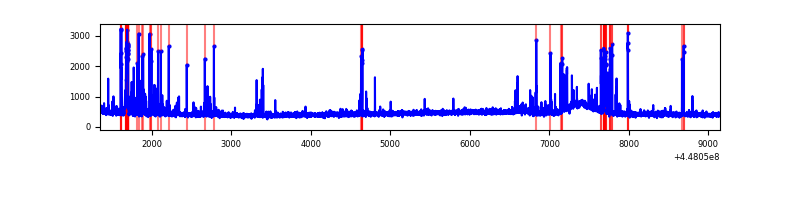 |
| D | 7797 | 7797 | 289 | 289 | 3.71% | 3.71% | 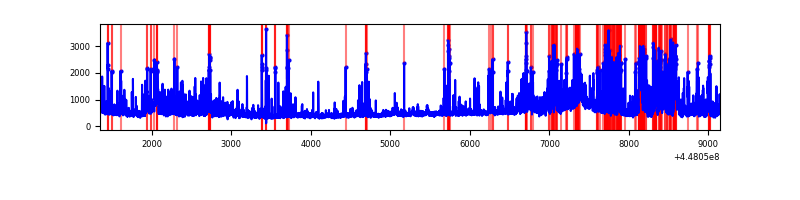 |
Top three noisy pixels from each quadrant. If the there are fewer than three noisy pixels in the level2.evt file, extra rows are filled as -1
| Pixel properties | Quadrant properties | ||||||
|---|---|---|---|---|---|---|---|
| Quadrant | DetID | PixID | Counts | Sigma | Mean | Median | Sigma |
| A | 10 | 83 | 3398314 | 18198.52 | 882 | 862 | 186.7 |
| A | 14 | 235 | 95227 | 505.47 | 882 | 862 | 186.7 |
| A | 0 | 243 | 48433 | 254.81 | 882 | 862 | 186.7 |
| B | 3 | 112 | 799213 | 4603.15 | 874 | 849 | 173.4 |
| B | 15 | 201 | 375521 | 2160.26 | 874 | 849 | 173.4 |
| B | 5 | 172 | 234833 | 1349.09 | 874 | 849 | 173.4 |
| C | 14 | 254 | 274007 | 1331.82 | 868 | 872 | 205.1 |
| C | 12 | 2 | 123427 | 597.58 | 868 | 872 | 205.1 |
| C | 15 | 208 | 43120 | 206.0 | 868 | 872 | 205.1 |
| D | 1 | 52 | 1306480 | 5931.63 | 855 | 825 | 220.1 |
| D | 2 | 249 | 365209 | 1655.41 | 855 | 825 | 220.1 |
| D | 1 | 47 | 110003 | 496.0 | 855 | 825 | 220.1 |
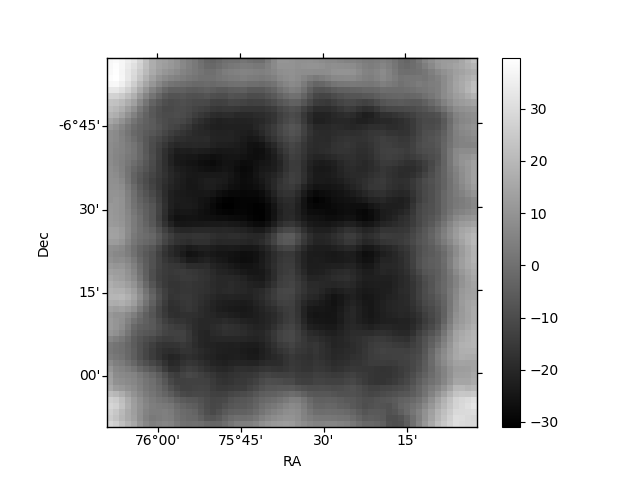
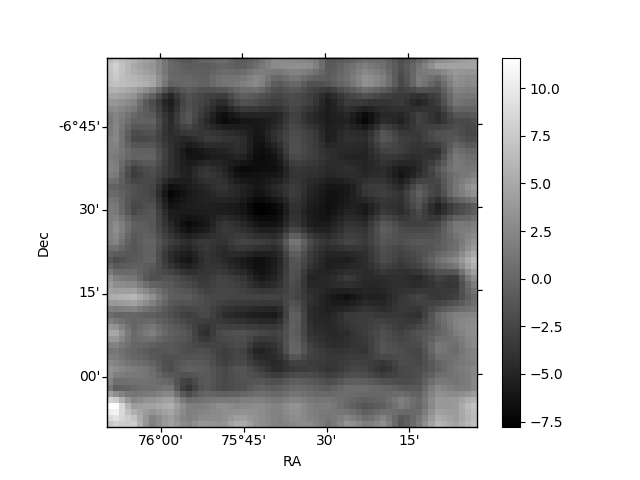
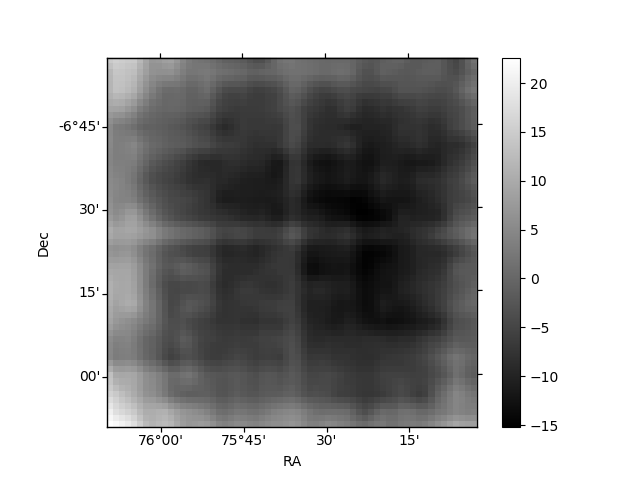
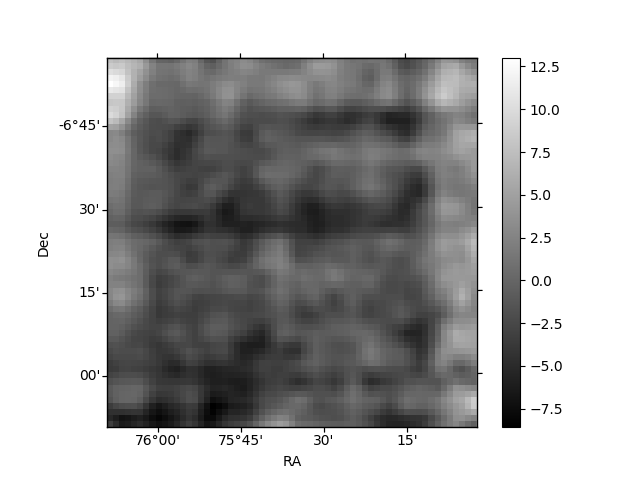
Histogram calculated using DETX and DETY for each event in the final _common_clean file
| Quadrant A | 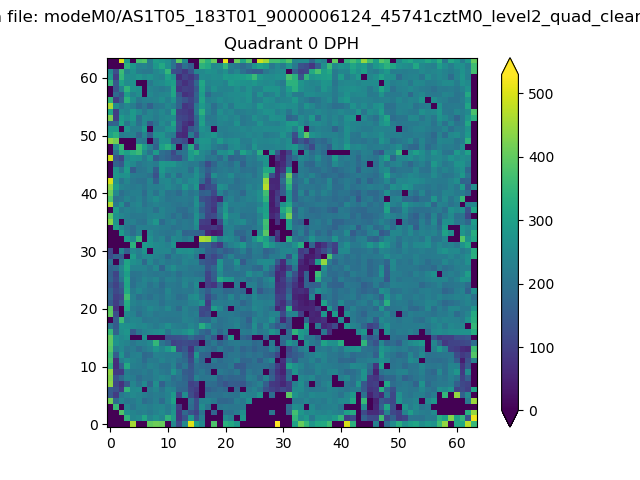 |
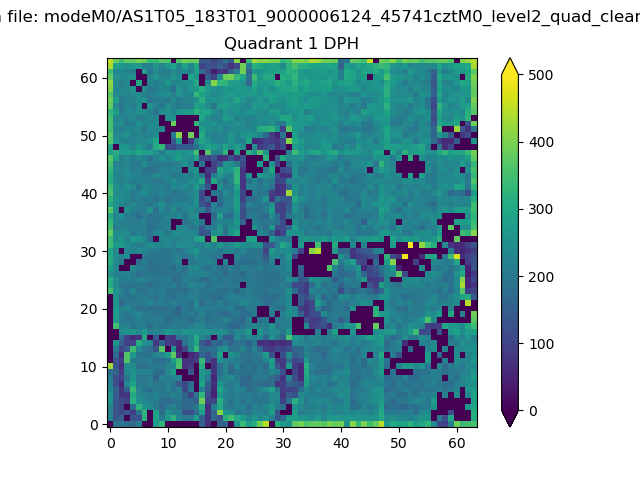 |
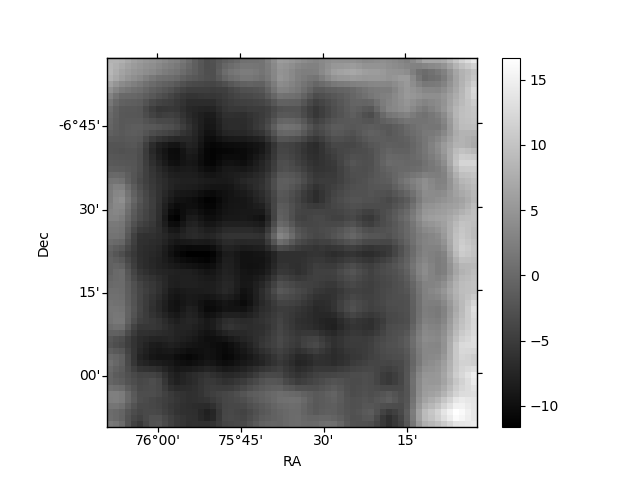
Quadrant B |
|---|---|---|---|
| Quadrant D | 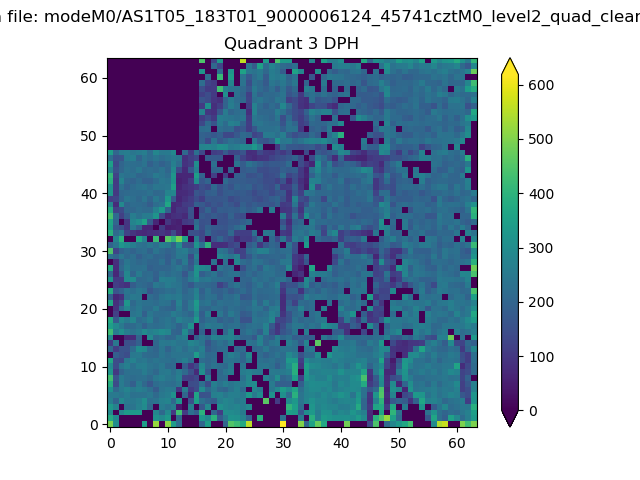 |
 |
Quadrant C |
| Plot type | Count rate plots | Images |
|---|---|---|
| Comparison with Poisson distribution Blue bars denote a histogram of data divided into 1 sec bins. Red curve is a Poisson curve with rate = median count rate of data. |
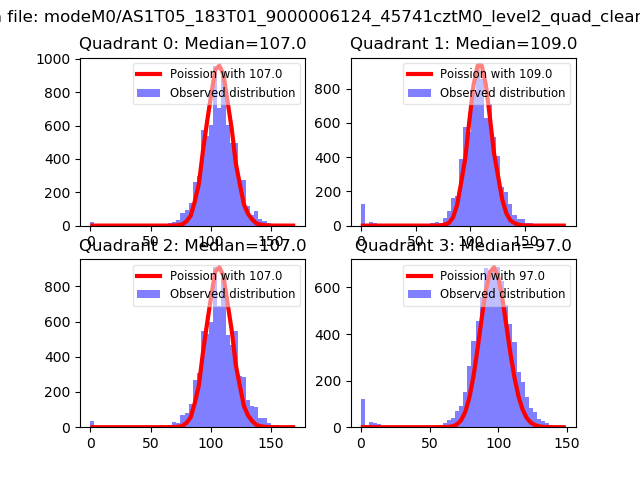 |
 |
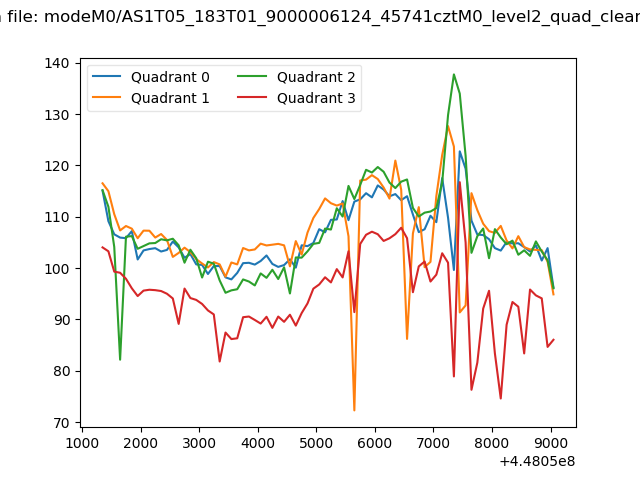
| Quadrant-wise count rates Data is divided into 100 sec bins |
 |
|
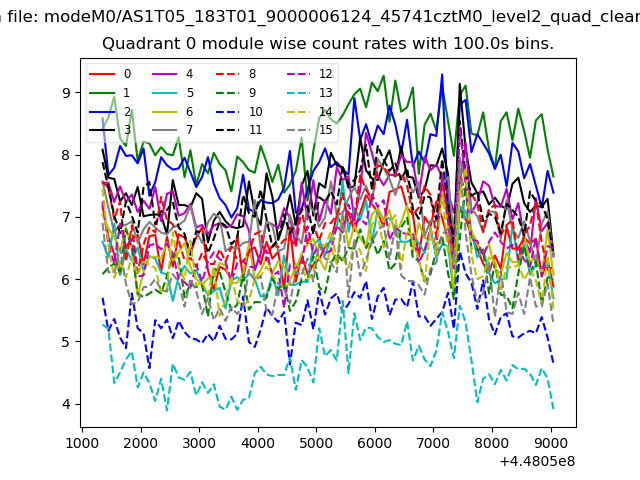
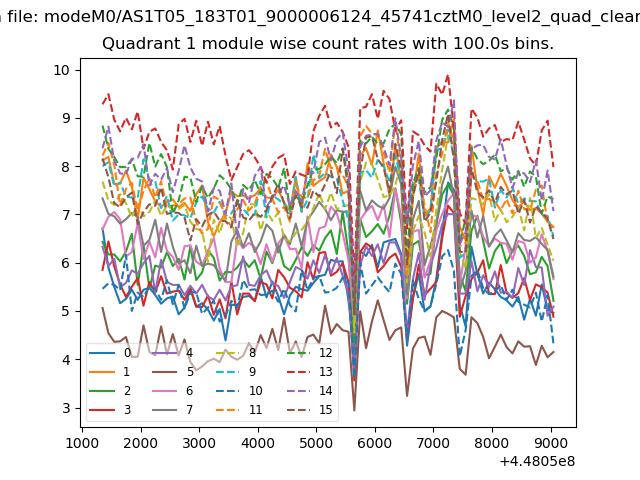
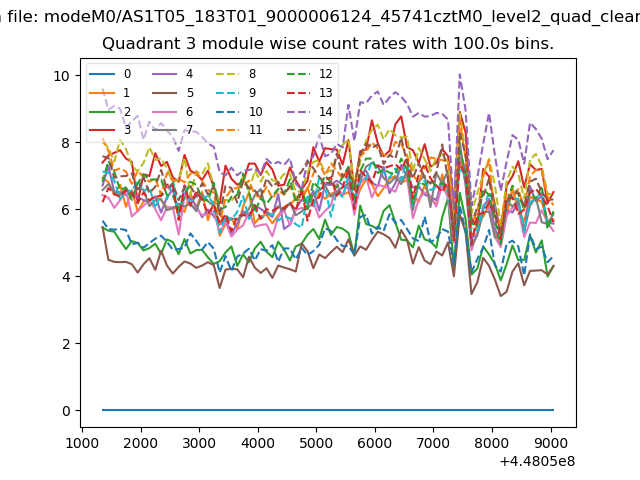
| Module-wise count rates for Quadrant A Data is divided into 100 sec bins |
 |
 |
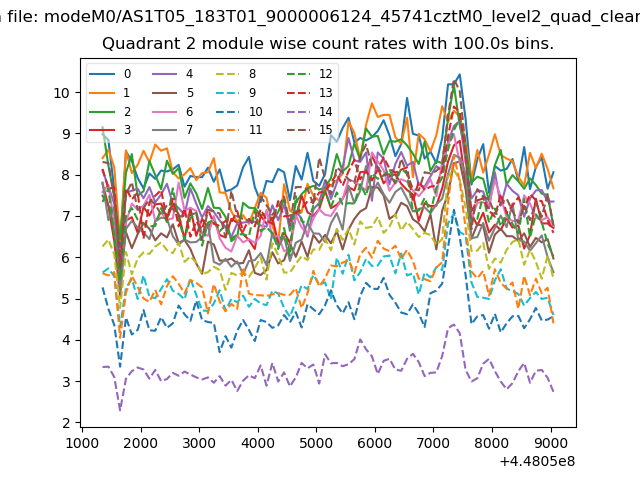
| Module-wise count rates for Quadrant B Data is divided into 100 sec bins |
 |
 |
| Module-wise count rates for Quadrant C Data is divided into 100 sec bins |
 |
 |
| Module-wise count rates for Quadrant D Data is divided into 100 sec bins |
 |
 |
| Parameter | Plot |
|---|---|
| CZT HV Monitor | 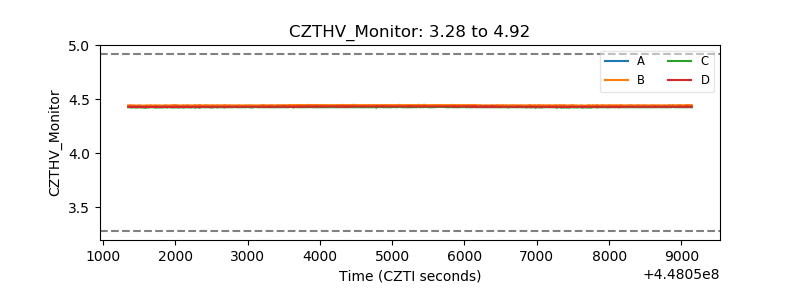 |
| D_VDD | 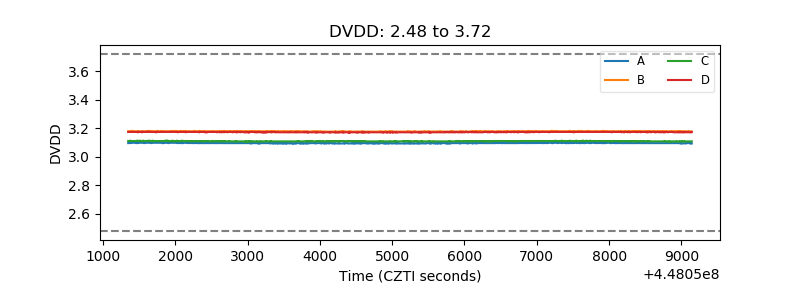 |
| Temperature 1 | 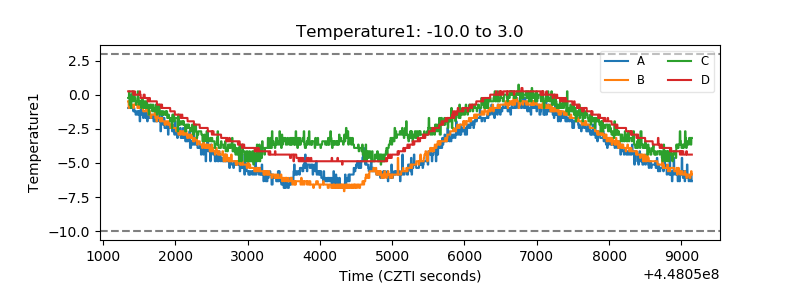 |
| Veto HV Monitor | 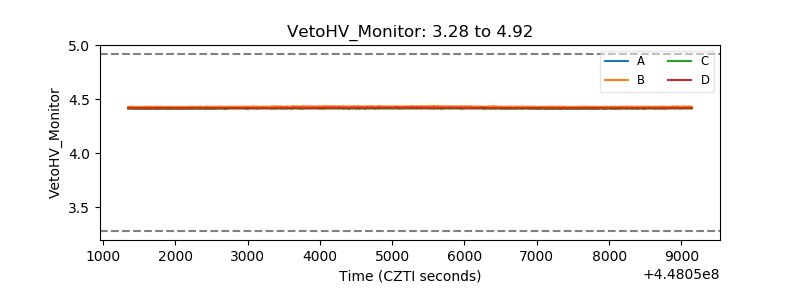 |
| Veto LLD | 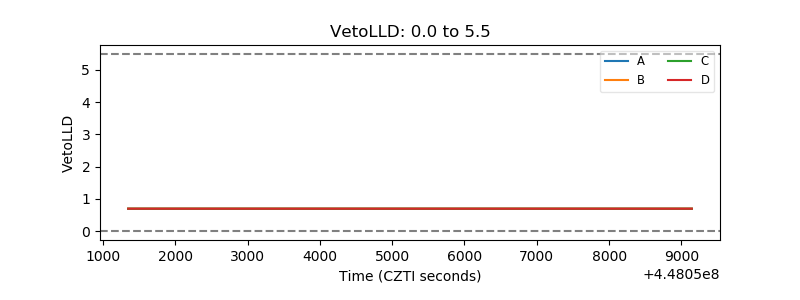 |
| Alpha Counter | 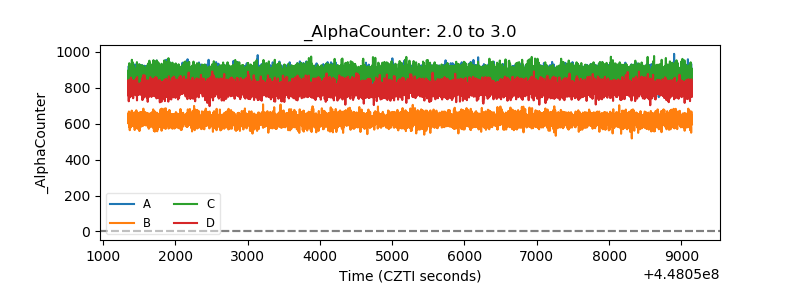 |
| _CPM_Rate | 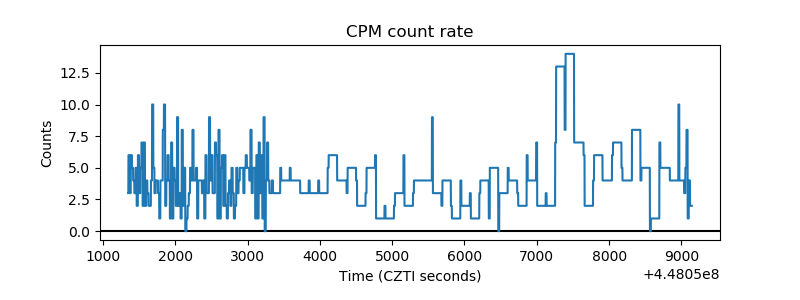 |
| CZT Counter | 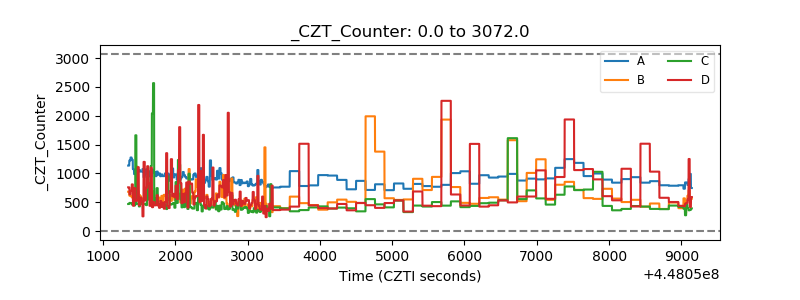 |
| +2.5 Volts monitor | 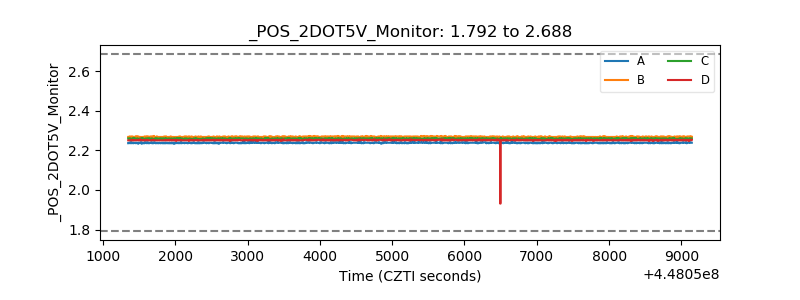 |
| +5 Volts monitor | 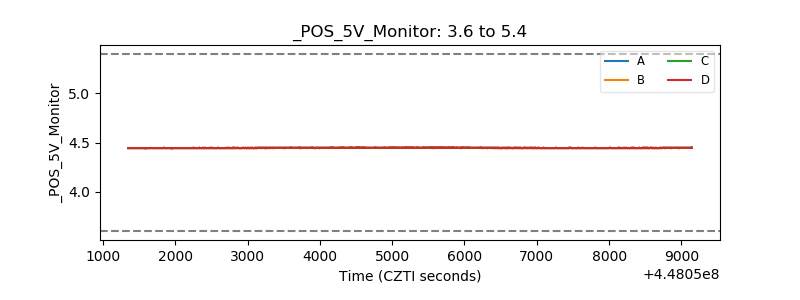 |
| _ROLL_ROT | 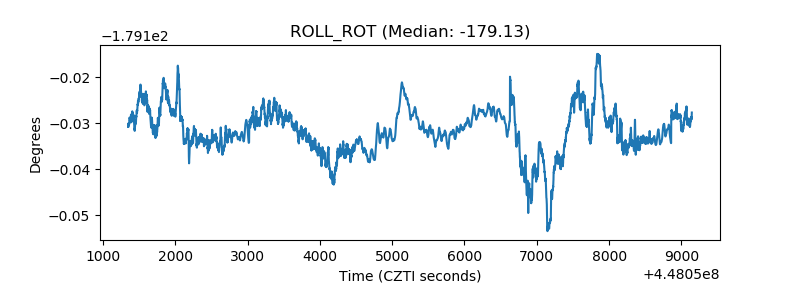 |
| _Roll_DEC | 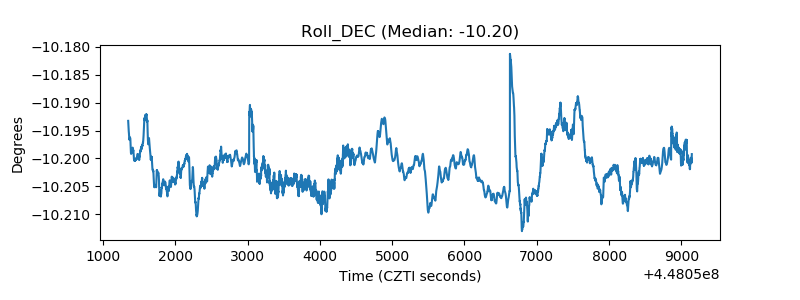 |
| _Roll_RA | 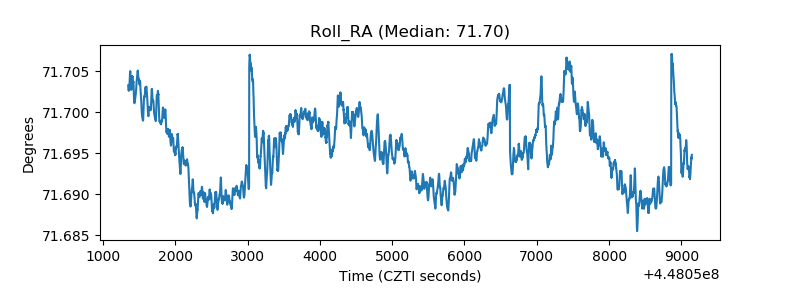 |
| Veto Counter | 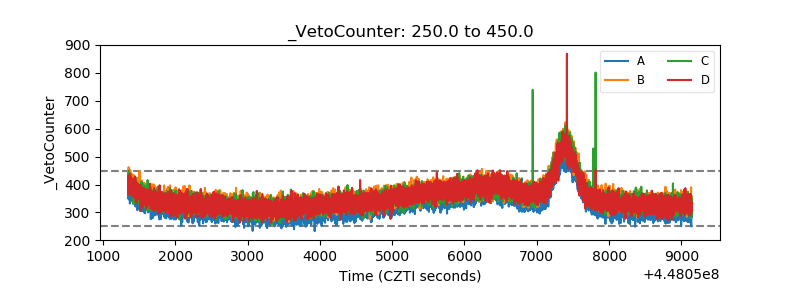 |