| Param | Original file | Final file |
|---|---|---|
| Filename | modeM0/AS1T05_183T01_9000006124_45744cztM0_level2.fits | modeM0/AS1T05_183T01_9000006124_45744cztM0_level2_quad_clean.evt |
| Size (bytes) | 614,905,920 | 116,864,640 |
| Size | 586.4 MB | 111.5 MB |
| Events in quadrant A | 7,080,502 | 767,659 |
| Events in quadrant B | 5,282,430 | 796,348 |
| Events in quadrant C | 3,893,147 | 783,998 |
| Events in quadrant D | 5,925,930 | 669,167 |
| Mode SS | |||
|---|---|---|---|
| Quadrant | BADHDUFLAG | Total packets | Discarded packets |
| A | 0 | 154 | 0 |
| B | 0 | 154 | 0 |
| C | 0 | 154 | 0 |
| D | 0 | 154 | 0 |
| Mode M0 | |||
|---|---|---|---|
| Quadrant | BADHDUFLAG | Total packets | Discarded packets |
| A | 0 | 25916 | 4 |
| B | 0 | 20622 | 2 |
| C | 0 | 16873 | 2 |
| D | 0 | 22817 | 2 |
| Mode M9 | |||
|---|---|---|---|
| Quadrant | BADHDUFLAG | Total packets | Discarded packets |
| A | 0 | 14 | 0 |
| B | 0 | 14 | 0 |
| C | 0 | 14 | 0 |
| D | 0 | 14 | 0 |
| Quadrant | Total seconds | Saturated seconds | Saturation percentage |
|---|---|---|---|
| A | 7485 | 316 | 4.221777% |
| B | 7486 | 324 | 4.328079% |
| C | 7486 | 159 | 2.123965% |
| D | 7486 | 730 | 9.751536% |
Noise dominated data is calculated using 1-second bins in cleaned event files. If a bin has >2000 counts, and if more than 50% of those come from <1% of pixels, then it is considered to be noise-dominated and hence unusable.
| Quadrant | # 1 sec bins | Bins with >0 counts | Bins with >2000 counts | High rate bins dominated by noise | Noise dominated (total time) | Noise dominated (detector-on time) | Marked lightcurve |
|---|---|---|---|---|---|---|---|
| A | 8835 | 7487 | 118 | 118 | 1.34% | 1.58% | 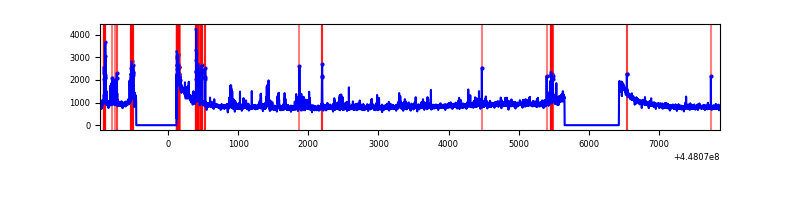 |
| B | 8836 | 7488 | 118 | 118 | 1.34% | 1.58% | 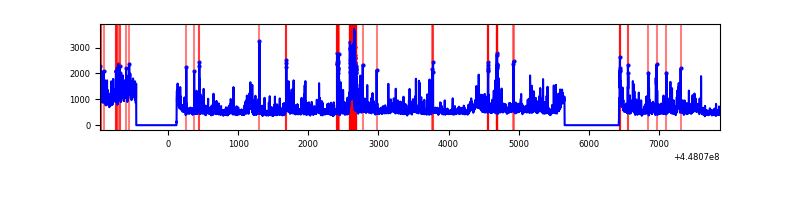 |
| C | 8836 | 7488 | 97 | 97 | 1.10% | 1.30% | 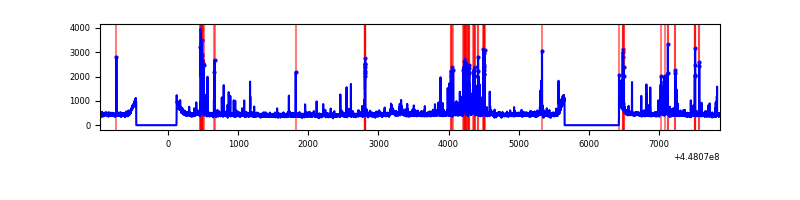 |
| D | 8836 | 7488 | 689 | 689 | 7.80% | 9.20% | 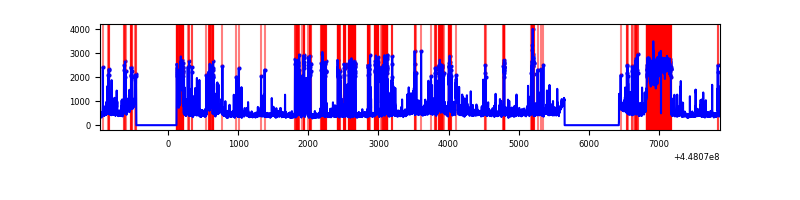 |
Top three noisy pixels from each quadrant. If the there are fewer than three noisy pixels in the level2.evt file, extra rows are filled as -1
| Pixel properties | Quadrant properties | ||||||
|---|---|---|---|---|---|---|---|
| Quadrant | DetID | PixID | Counts | Sigma | Mean | Median | Sigma |
| A | 10 | 83 | 3227488 | 18513.22 | 837 | 819 | 174.3 |
| A | 7 | 191 | 220695 | 1261.55 | 837 | 819 | 174.3 |
| A | 13 | 248 | 178315 | 1018.39 | 837 | 819 | 174.3 |
| B | 3 | 112 | 1206879 | 7178.91 | 845 | 819 | 168.0 |
| B | 5 | 172 | 249137 | 1478.08 | 845 | 819 | 168.0 |
| B | 5 | 32 | 199994 | 1185.56 | 845 | 819 | 168.0 |
| C | 14 | 254 | 401463 | 2012.59 | 840 | 844 | 199.1 |
| C | 0 | 239 | 178503 | 892.51 | 840 | 844 | 199.1 |
| C | 3 | 233 | 33837 | 165.75 | 840 | 844 | 199.1 |
| D | 1 | 52 | 1603219 | 7801.94 | 810 | 787 | 205.4 |
| D | 7 | 38 | 751955 | 3657.29 | 810 | 787 | 205.4 |
| D | 2 | 249 | 122107 | 590.68 | 810 | 787 | 205.4 |
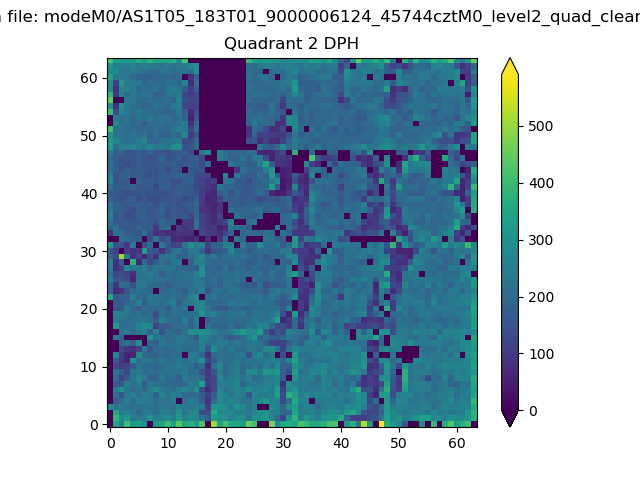
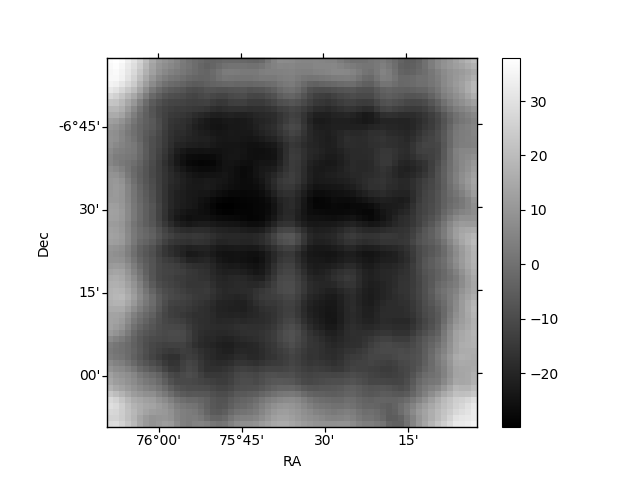
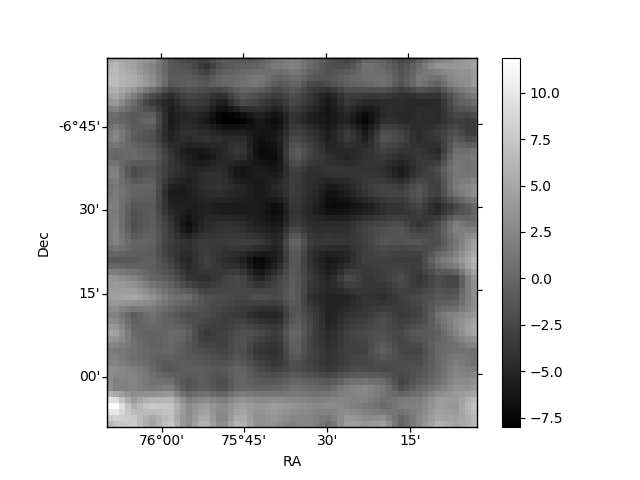
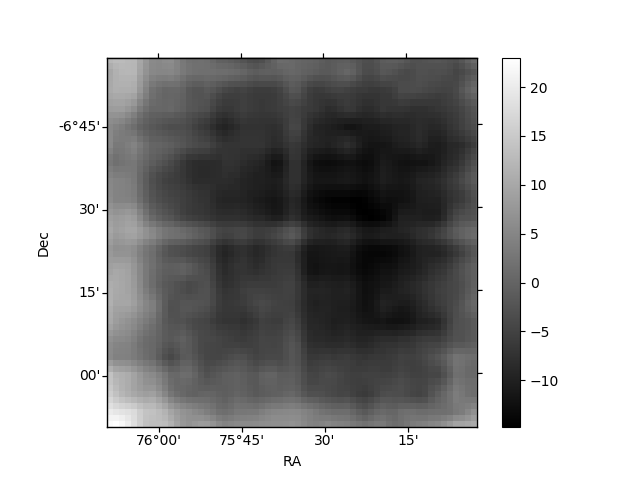
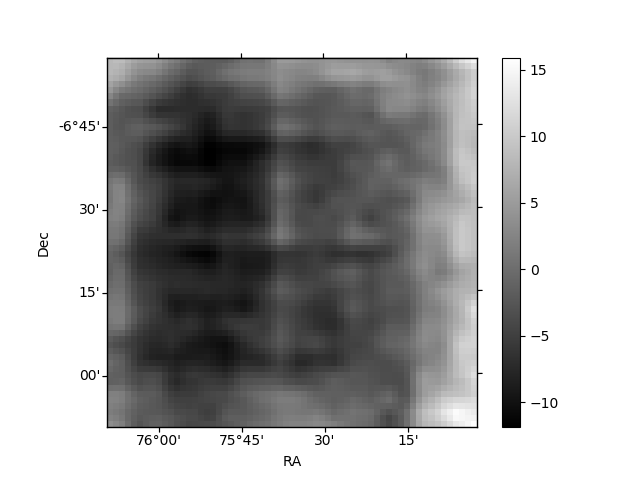
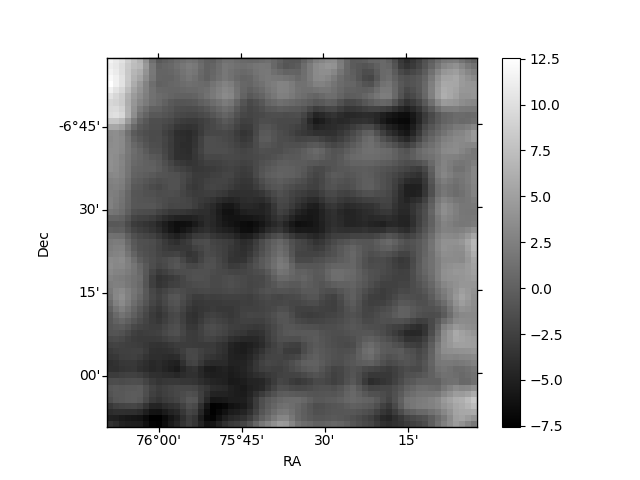
Histogram calculated using DETX and DETY for each event in the final _common_clean file
| Quadrant A | 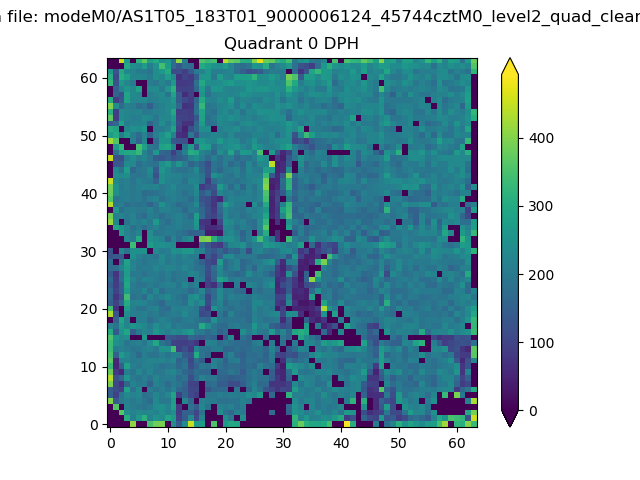 |
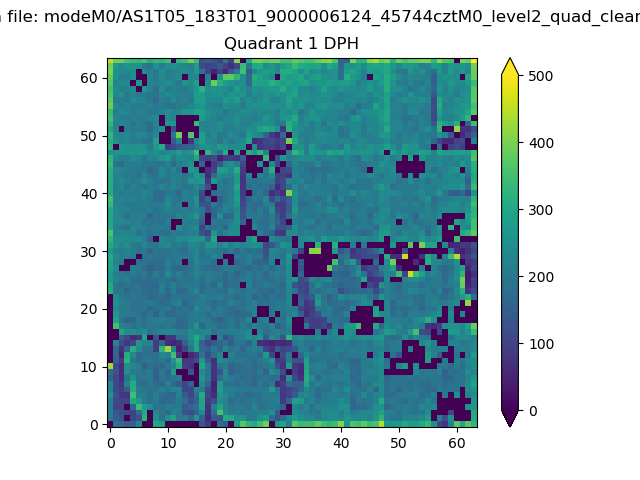 |
Quadrant B |
|---|---|---|---|
| Quadrant D | 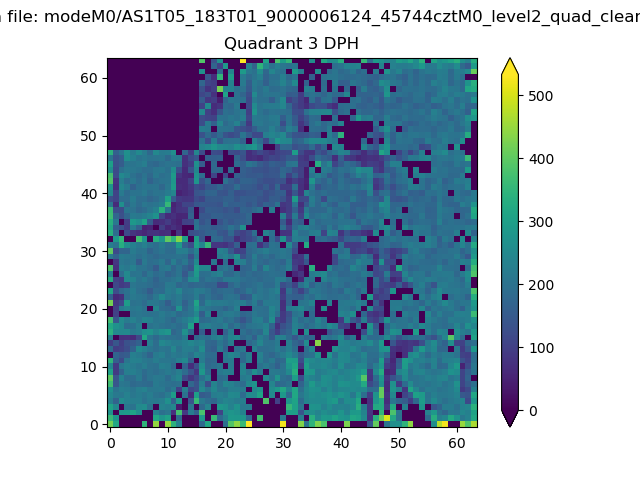 |
 |
Quadrant C |
| Plot type | Count rate plots | Images |
|---|---|---|
| Comparison with Poisson distribution Blue bars denote a histogram of data divided into 1 sec bins. Red curve is a Poisson curve with rate = median count rate of data. |
 |
 |
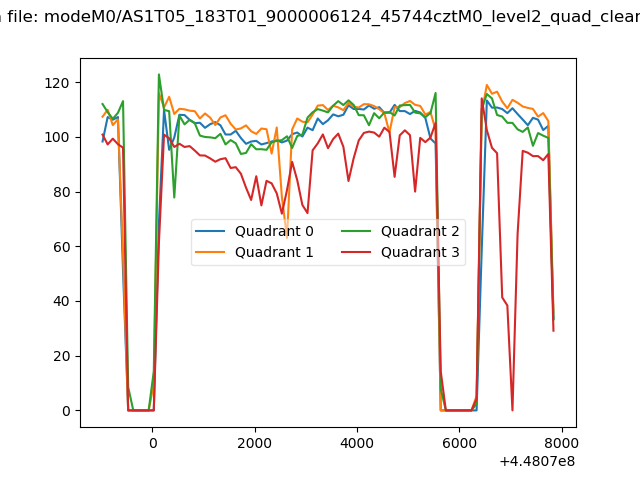
| Quadrant-wise count rates Data is divided into 100 sec bins |
 |
|
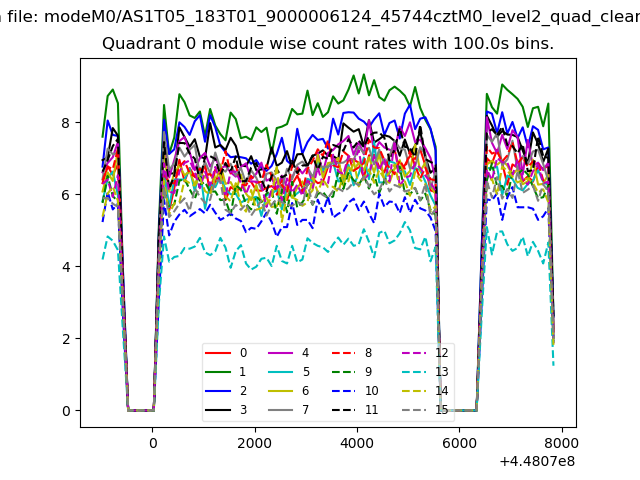
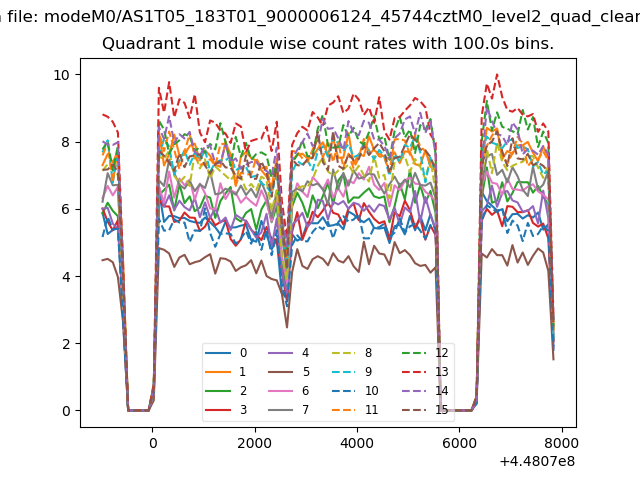
| Module-wise count rates for Quadrant A Data is divided into 100 sec bins |
 |
 |
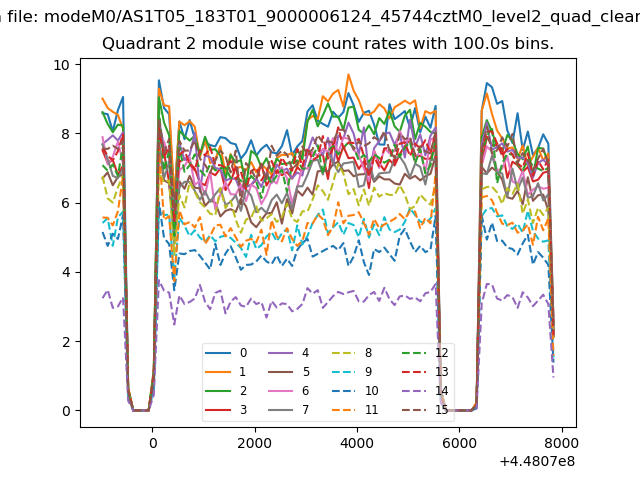
| Module-wise count rates for Quadrant B Data is divided into 100 sec bins |
 |
 |
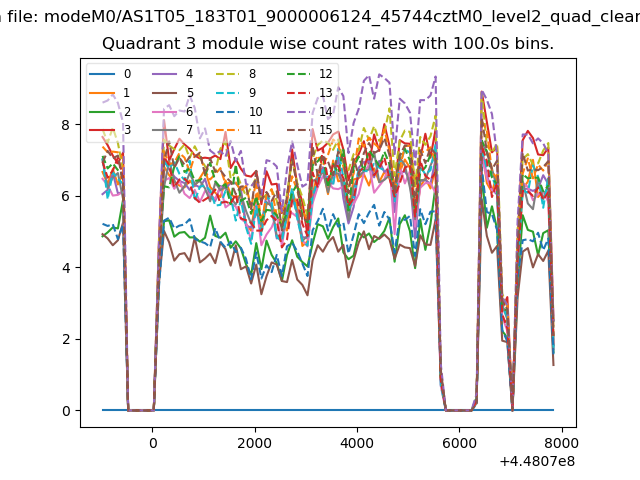
| Module-wise count rates for Quadrant C Data is divided into 100 sec bins |
 |
 |
| Module-wise count rates for Quadrant D Data is divided into 100 sec bins |
 |
 |
| Parameter | Plot |
|---|---|
| CZT HV Monitor | 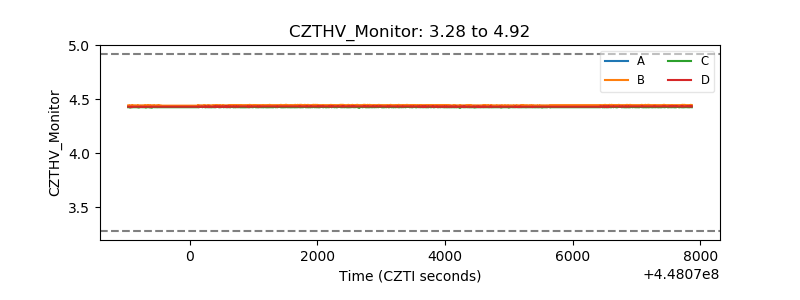 |
| D_VDD | 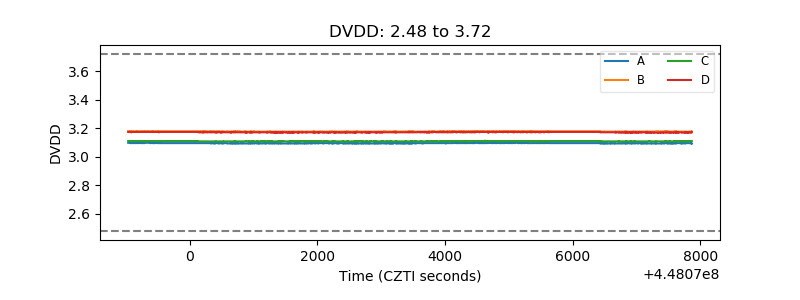 |
| Temperature 1 | 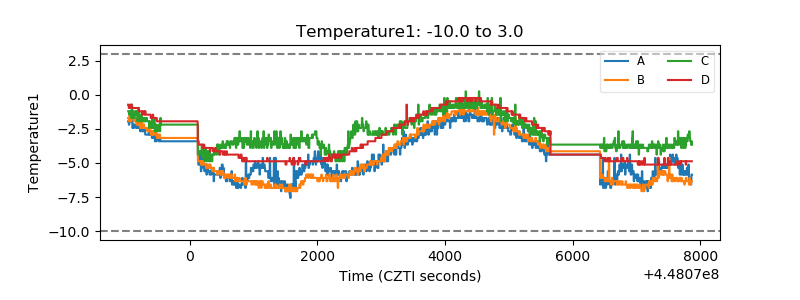 |
| Veto HV Monitor | 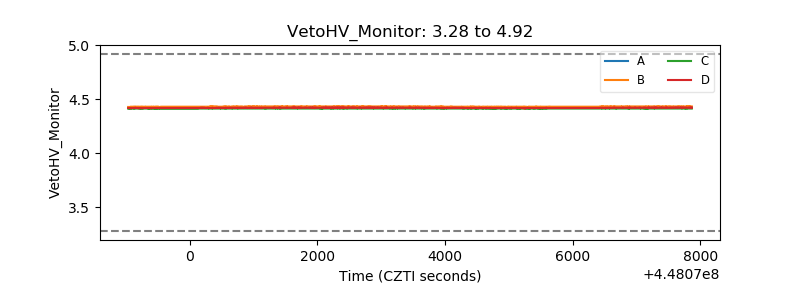 |
| Veto LLD | 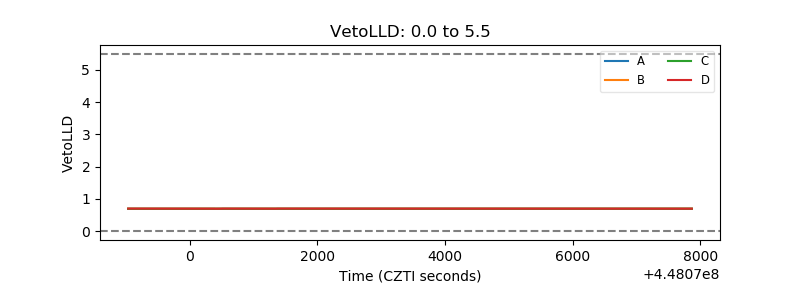 |
| Alpha Counter | 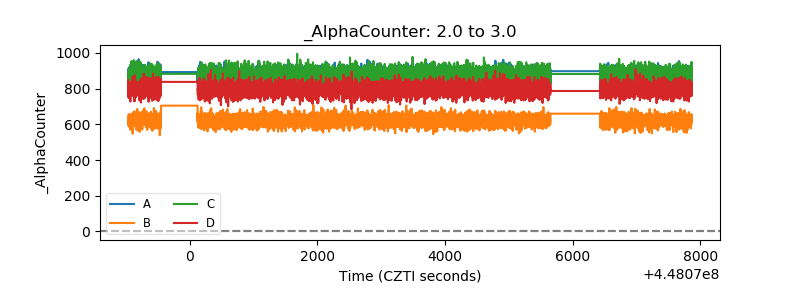 |
| _CPM_Rate | 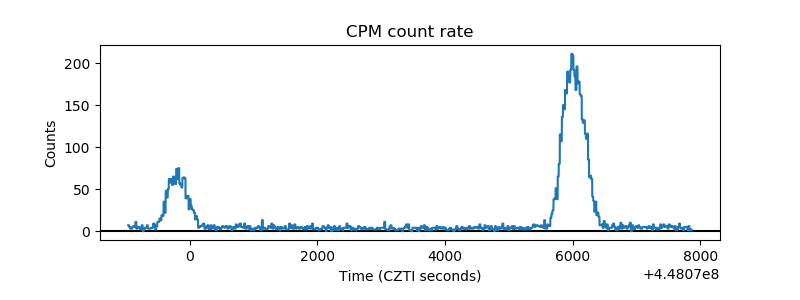 |
| CZT Counter | 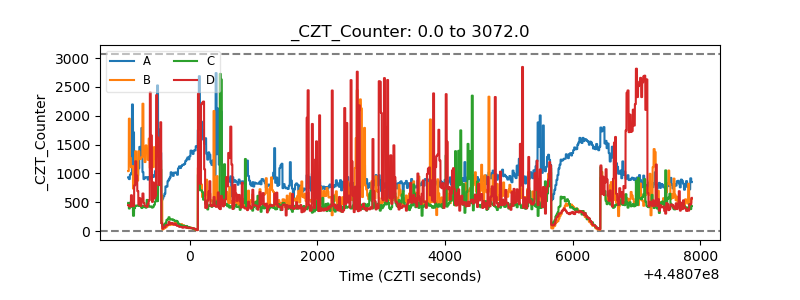 |
| +2.5 Volts monitor | 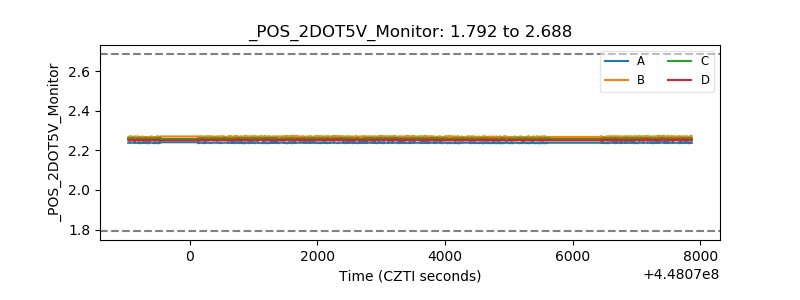 |
| +5 Volts monitor | 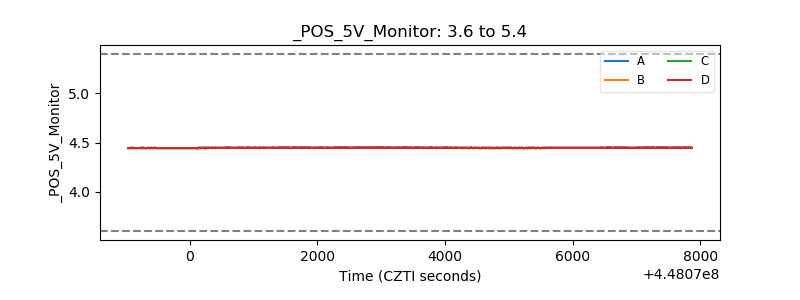 |
| _ROLL_ROT | 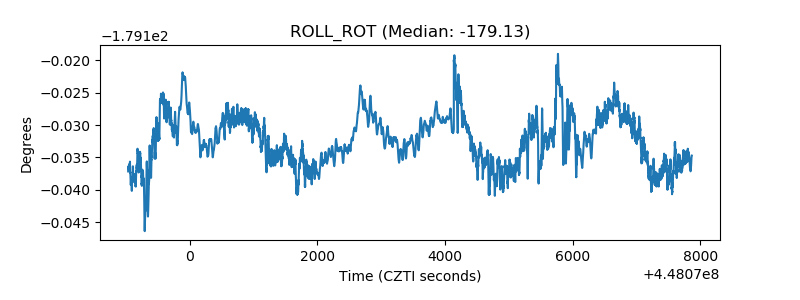 |
| _Roll_DEC | 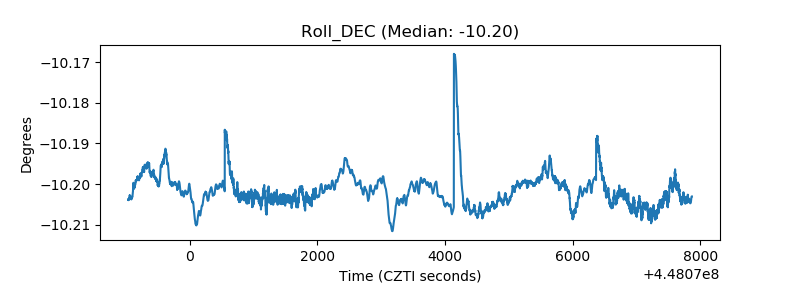 |
| _Roll_RA | 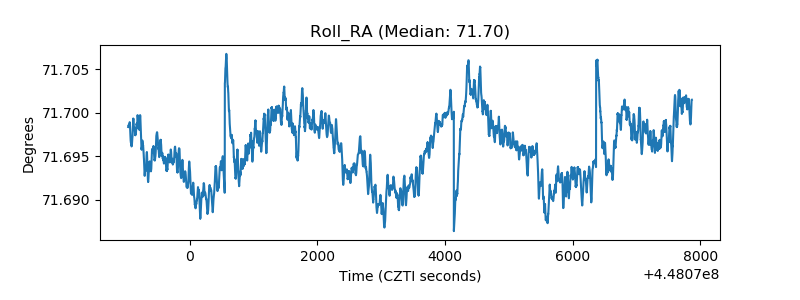 |
| Veto Counter | 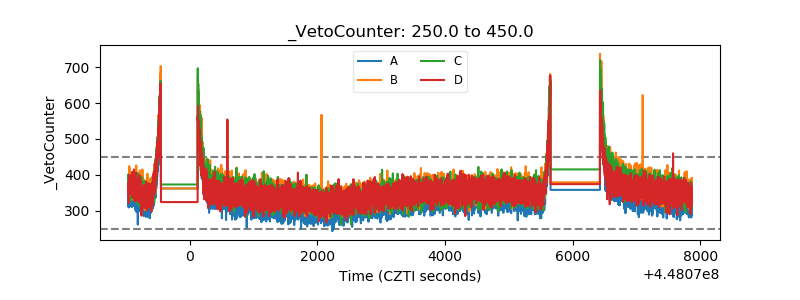 |