| Param | Original file | Final file |
|---|---|---|
| Filename | modeM0/AS1T05_183T01_9000006124_45745cztM0_level2.fits | modeM0/AS1T05_183T01_9000006124_45745cztM0_level2_quad_clean.evt |
| Size (bytes) | 576,155,520 | 105,220,800 |
| Size | 549.5 MB | 100.3 MB |
| Events in quadrant A | 6,056,160 | 709,876 |
| Events in quadrant B | 4,502,192 | 738,630 |
| Events in quadrant C | 3,767,505 | 705,129 |
| Events in quadrant D | 6,480,508 | 563,114 |
| Mode SS | |||
|---|---|---|---|
| Quadrant | BADHDUFLAG | Total packets | Discarded packets |
| A | 0 | 138 | 0 |
| B | 0 | 138 | 0 |
| C | 0 | 138 | 0 |
| D | 0 | 138 | 0 |
| Mode M0 | |||
|---|---|---|---|
| Quadrant | BADHDUFLAG | Total packets | Discarded packets |
| A | 0 | 22216 | 2 |
| B | 0 | 17847 | 2 |
| C | 0 | 15853 | 2 |
| D | 0 | 23915 | 2 |
| Mode M9 | |||
|---|---|---|---|
| Quadrant | BADHDUFLAG | Total packets | Discarded packets |
| A | 0 | 12 | 0 |
| B | 0 | 13 | 0 |
| C | 0 | 13 | 0 |
| D | 0 | 13 | 0 |
| Quadrant | Total seconds | Saturated seconds | Saturation percentage |
|---|---|---|---|
| A | 6723 | 220 | 3.272349% |
| B | 6723 | 215 | 3.197977% |
| C | 6723 | 242 | 3.599584% |
| D | 6723 | 1099 | 16.346869% |
Noise dominated data is calculated using 1-second bins in cleaned event files. If a bin has >2000 counts, and if more than 50% of those come from <1% of pixels, then it is considered to be noise-dominated and hence unusable.
| Quadrant | # 1 sec bins | Bins with >0 counts | Bins with >2000 counts | High rate bins dominated by noise | Noise dominated (total time) | Noise dominated (detector-on time) | Marked lightcurve |
|---|---|---|---|---|---|---|---|
| A | 7638 | 6724 | 3 | 3 | 0.04% | 0.04% | 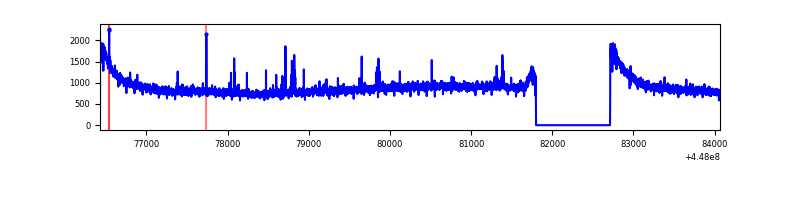 |
| B | 7638 | 6724 | 57 | 57 | 0.75% | 0.85% | 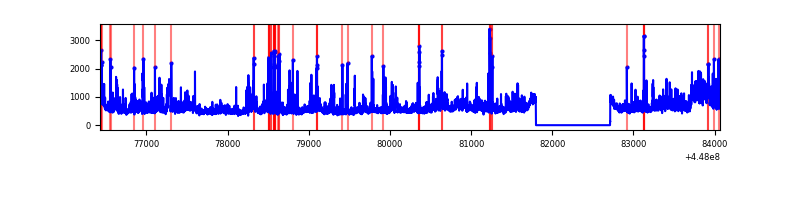 |
| C | 7638 | 6724 | 131 | 131 | 1.72% | 1.95% | 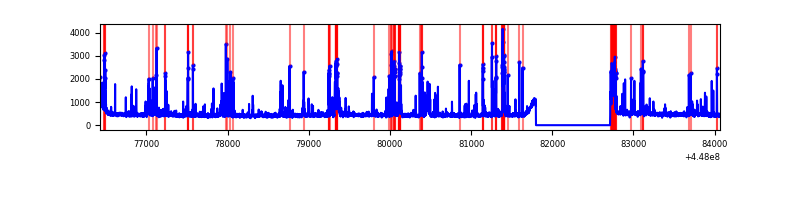 |
| D | 7638 | 6724 | 1099 | 1099 | 14.39% | 16.34% | 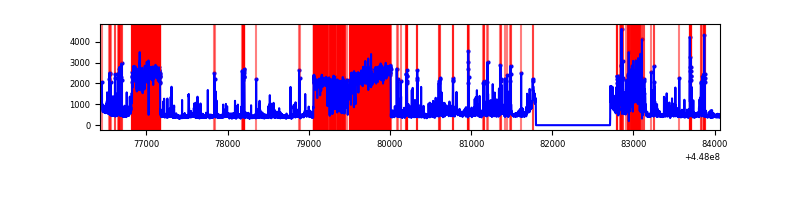 |
Top three noisy pixels from each quadrant. If the there are fewer than three noisy pixels in the level2.evt file, extra rows are filled as -1
| Pixel properties | Quadrant properties | ||||||
|---|---|---|---|---|---|---|---|
| Quadrant | DetID | PixID | Counts | Sigma | Mean | Median | Sigma |
| A | 10 | 83 | 2991644 | 18697.28 | 768 | 752 | 160.0 |
| A | 14 | 235 | 44333 | 272.44 | 768 | 752 | 160.0 |
| A | 10 | 255 | 20591 | 124.02 | 768 | 752 | 160.0 |
| B | 3 | 112 | 1044010 | 6861.09 | 770 | 748 | 152.1 |
| B | 15 | 201 | 85054 | 554.44 | 770 | 748 | 152.1 |
| B | 5 | 255 | 84742 | 552.39 | 770 | 748 | 152.1 |
| C | 14 | 254 | 785412 | 4406.1 | 757 | 762 | 178.1 |
| C | 12 | 249 | 10345 | 53.81 | 757 | 762 | 178.1 |
| C | 3 | 233 | 8016 | 40.73 | 757 | 762 | 178.1 |
| D | 7 | 38 | 2221179 | 12190.81 | 720 | 697 | 182.1 |
| D | 1 | 52 | 582325 | 3193.23 | 720 | 697 | 182.1 |
| D | 1 | 47 | 263034 | 1440.27 | 720 | 697 | 182.1 |
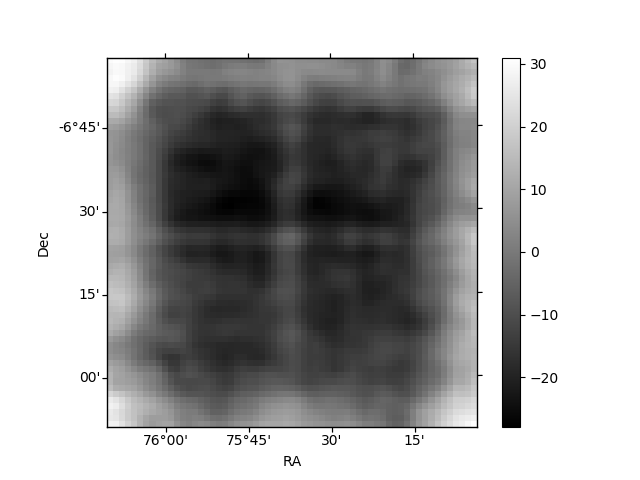
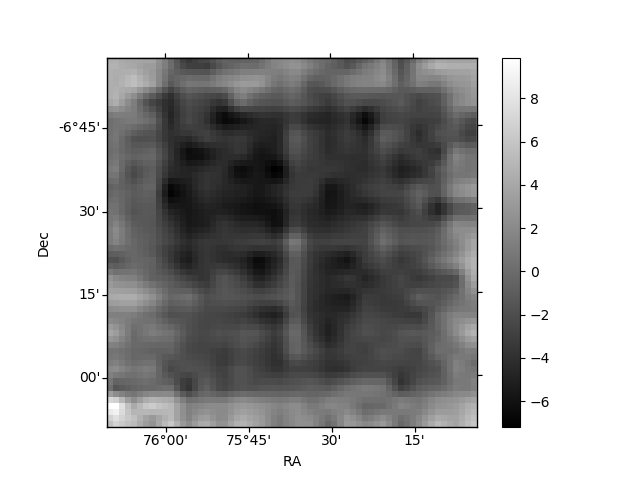
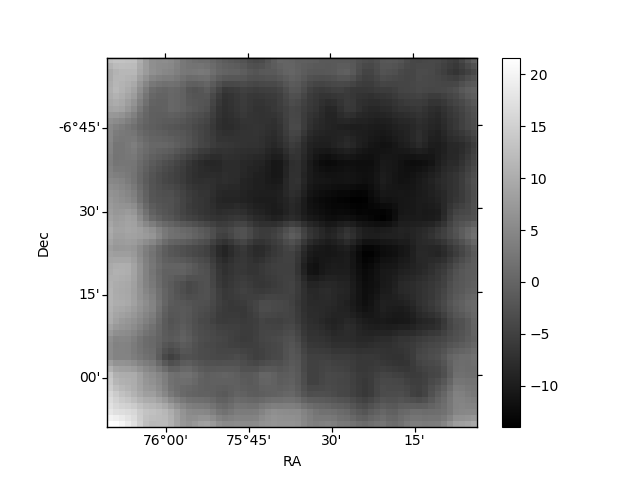
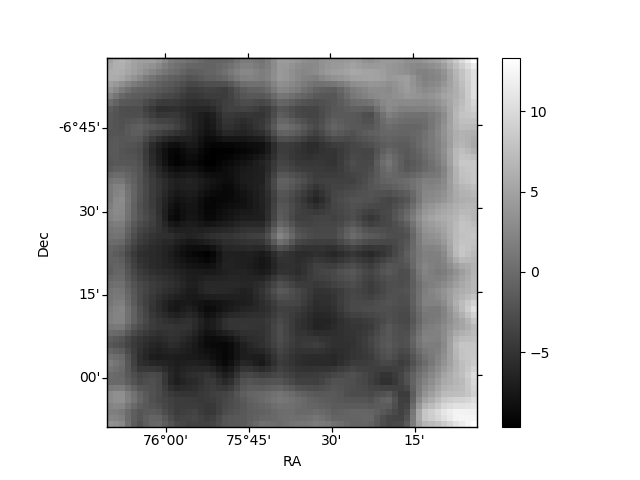
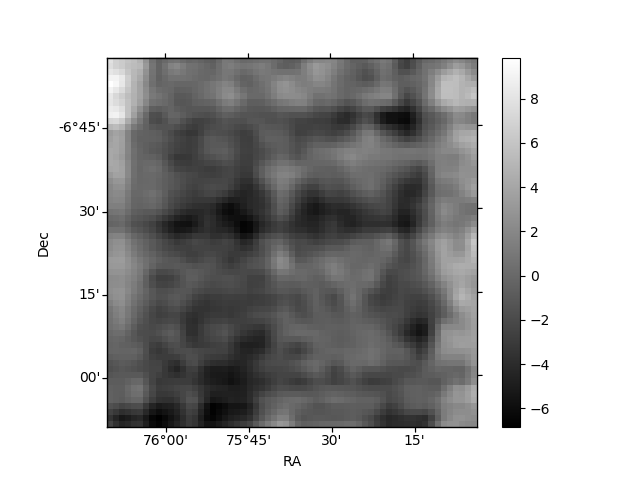
Histogram calculated using DETX and DETY for each event in the final _common_clean file
| Quadrant A | 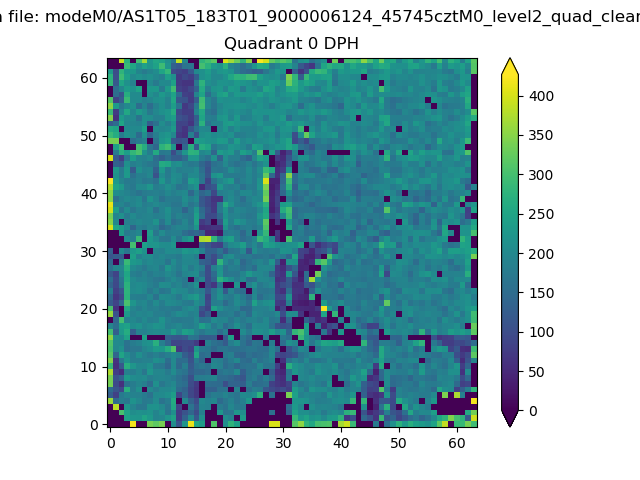 |
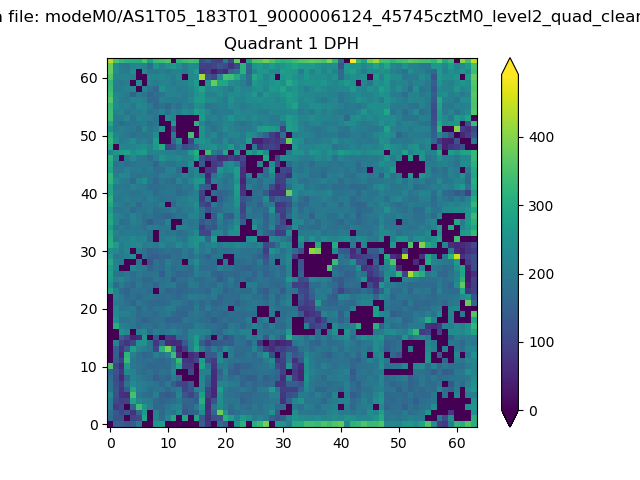 |
Quadrant B |
|---|---|---|---|
| Quadrant D | 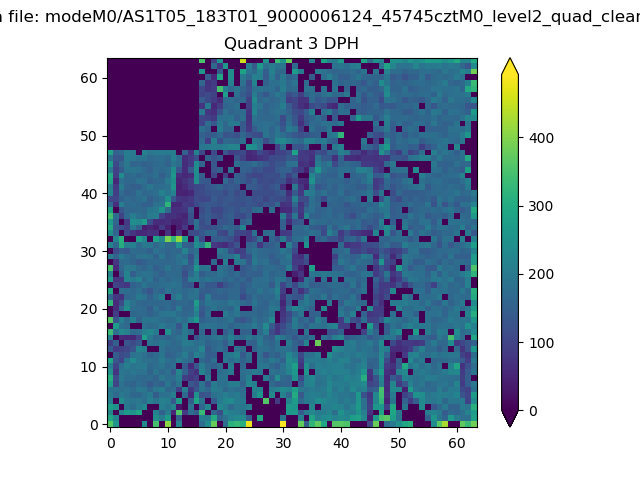 |
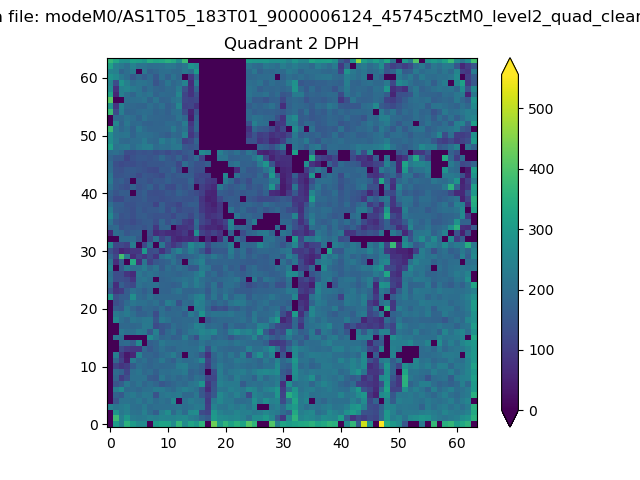 |
Quadrant C |
| Plot type | Count rate plots | Images |
|---|---|---|
| Comparison with Poisson distribution Blue bars denote a histogram of data divided into 1 sec bins. Red curve is a Poisson curve with rate = median count rate of data. |
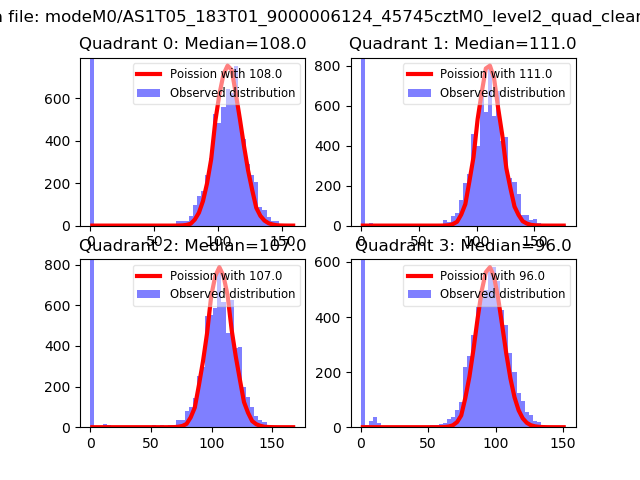 |
 |
| Quadrant-wise count rates Data is divided into 100 sec bins |
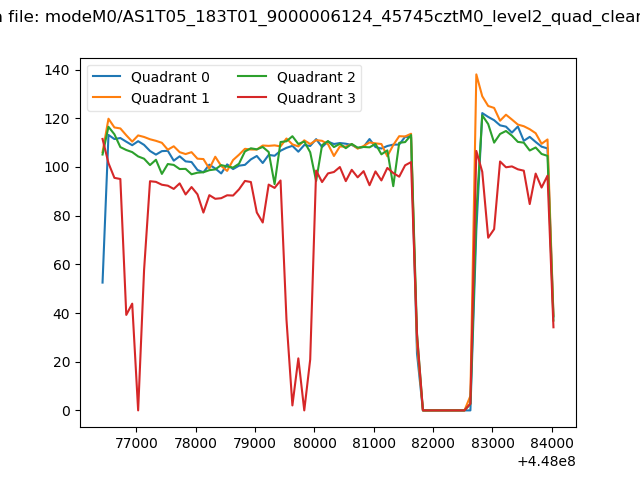 |
|
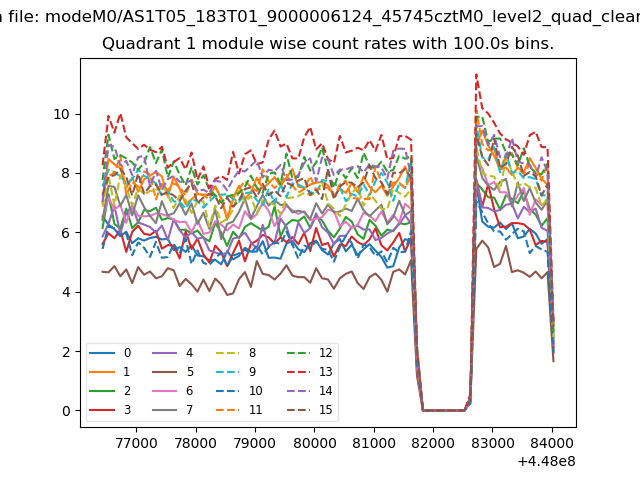
| Module-wise count rates for Quadrant A Data is divided into 100 sec bins |
 |
 |
| Module-wise count rates for Quadrant B Data is divided into 100 sec bins |
 |
 |
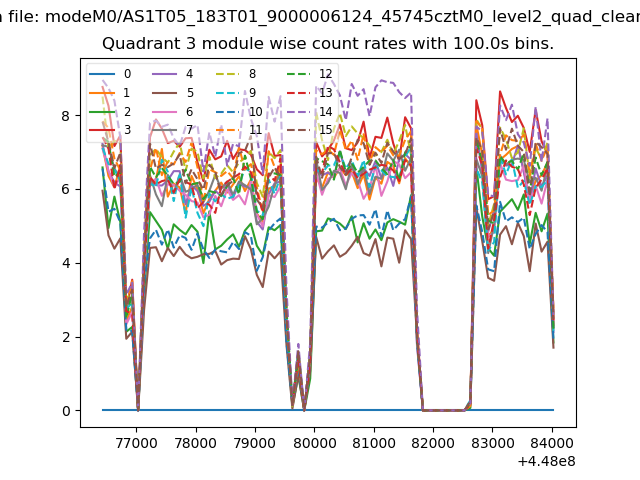
| Module-wise count rates for Quadrant C Data is divided into 100 sec bins |
 |
 |
| Module-wise count rates for Quadrant D Data is divided into 100 sec bins |
 |
 |
| Parameter | Plot |
|---|---|
| CZT HV Monitor | 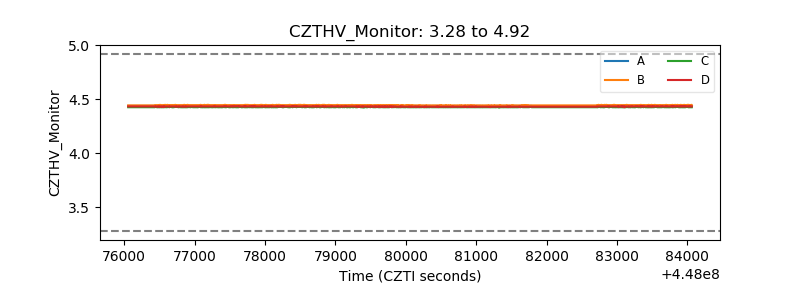 |
| D_VDD | 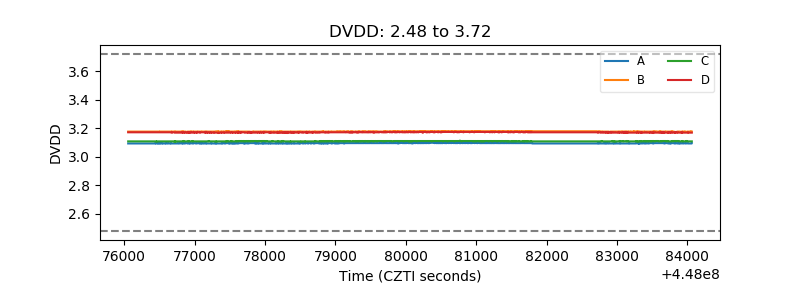 |
| Temperature 1 | 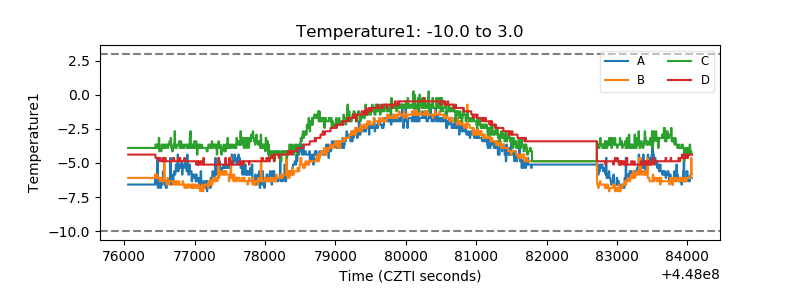 |
| Veto HV Monitor | 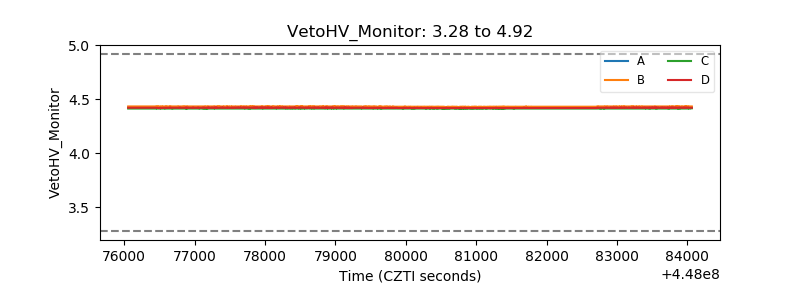 |
| Veto LLD | 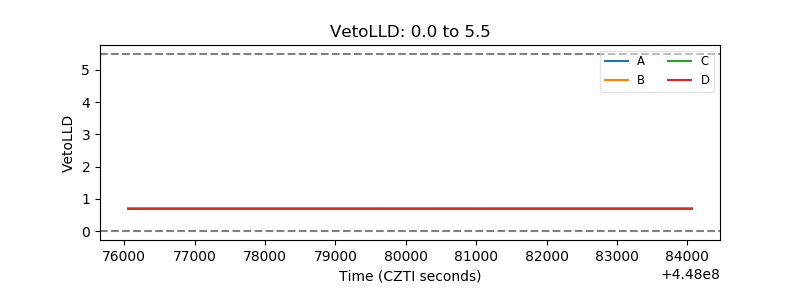 |
| Alpha Counter | 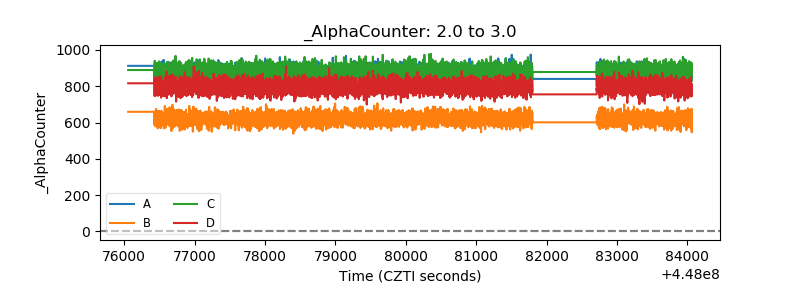 |
| _CPM_Rate | 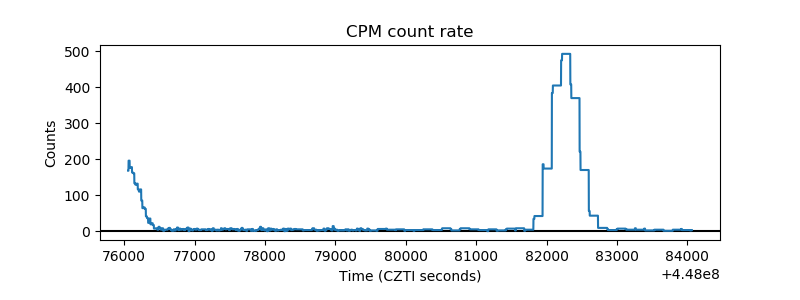 |
| CZT Counter | 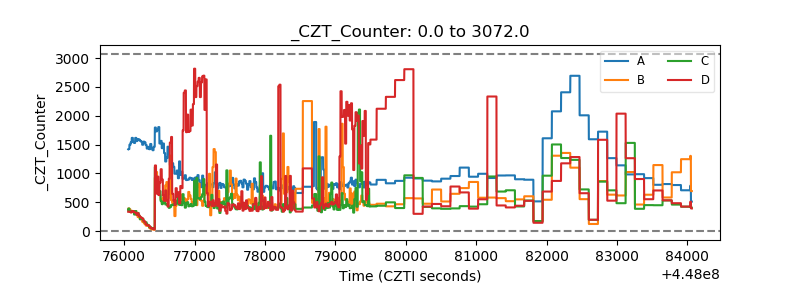 |
| +2.5 Volts monitor | 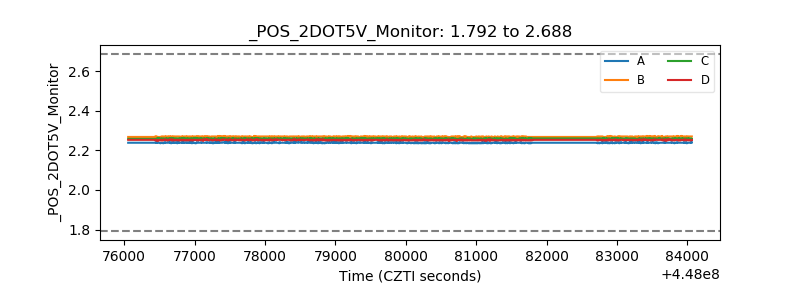 |
| +5 Volts monitor | 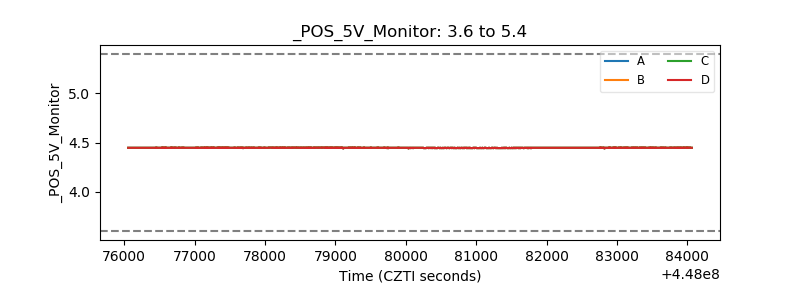 |
| _ROLL_ROT | 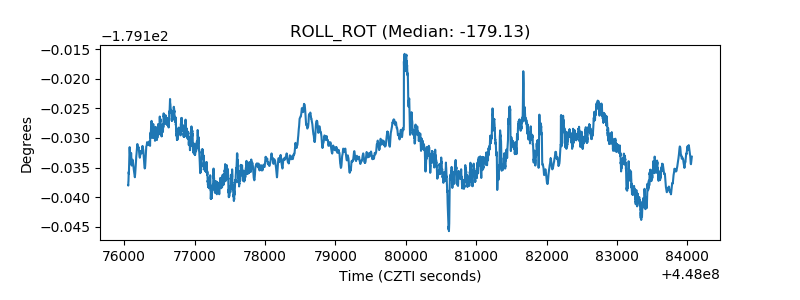 |
| _Roll_DEC | 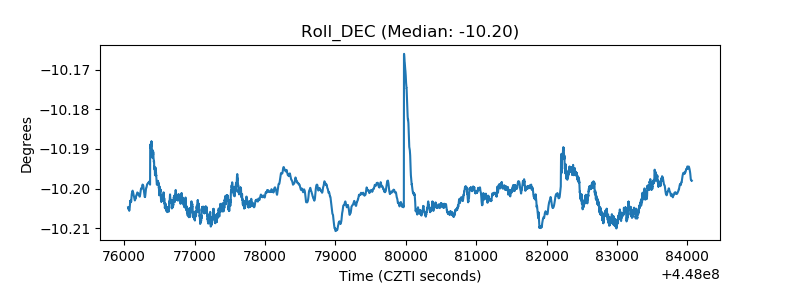 |
| _Roll_RA | 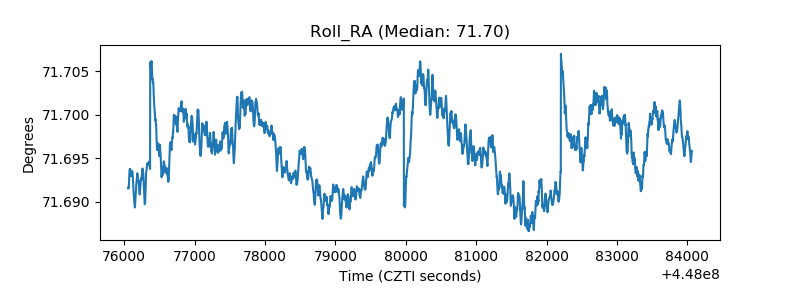 |
| Veto Counter | 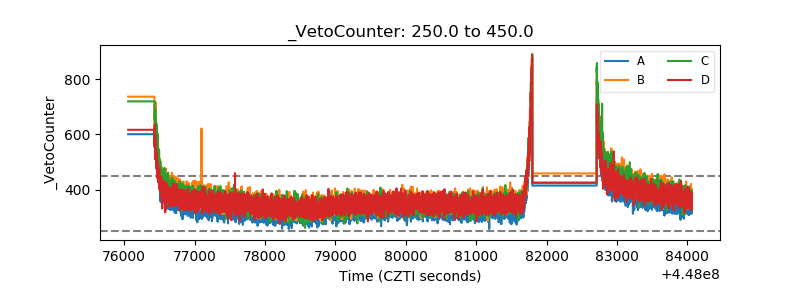 |