| Param | Original file | Final file |
|---|---|---|
| Filename | modeM0/AS1T05_183T01_9000006124_45748cztM0_level2.fits | modeM0/AS1T05_183T01_9000006124_45748cztM0_level2_quad_clean.evt |
| Size (bytes) | 569,833,920 | 112,824,000 |
| Size | 543.4 MB | 107.6 MB |
| Events in quadrant A | 6,202,776 | 758,044 |
| Events in quadrant B | 5,959,485 | 756,097 |
| Events in quadrant C | 3,913,712 | 759,937 |
| Events in quadrant D | 4,514,834 | 689,410 |
| Mode SS | |||
|---|---|---|---|
| Quadrant | BADHDUFLAG | Total packets | Discarded packets |
| A | 0 | 132 | 0 |
| B | 0 | 132 | 0 |
| C | 0 | 132 | 0 |
| D | 0 | 132 | 0 |
| Mode M0 | |||
|---|---|---|---|
| Quadrant | BADHDUFLAG | Total packets | Discarded packets |
| A | 0 | 22465 | 2 |
| B | 0 | 22266 | 2 |
| C | 0 | 15899 | 2 |
| D | 0 | 17653 | 2 |
| Mode M9 | |||
|---|---|---|---|
| Quadrant | BADHDUFLAG | Total packets | Discarded packets |
| A | 0 | 20 | 0 |
| B | 0 | 21 | 0 |
| C | 0 | 21 | 0 |
| D | 0 | 21 | 0 |
| Quadrant | Total seconds | Saturated seconds | Saturation percentage |
|---|---|---|---|
| A | 6492 | 280 | 4.313001% |
| B | 6492 | 638 | 9.827480% |
| C | 6492 | 254 | 3.912508% |
| D | 6492 | 280 | 4.313001% |
Noise dominated data is calculated using 1-second bins in cleaned event files. If a bin has >2000 counts, and if more than 50% of those come from <1% of pixels, then it is considered to be noise-dominated and hence unusable.
| Quadrant | # 1 sec bins | Bins with >0 counts | Bins with >2000 counts | High rate bins dominated by noise | Noise dominated (total time) | Noise dominated (detector-on time) | Marked lightcurve |
|---|---|---|---|---|---|---|---|
| A | 7637 | 6493 | 8 | 8 | 0.10% | 0.12% | 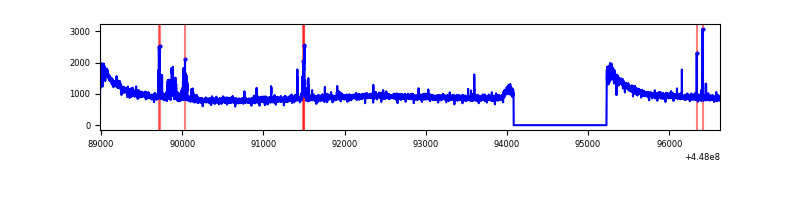 |
| B | 7637 | 6493 | 387 | 387 | 5.07% | 5.96% | 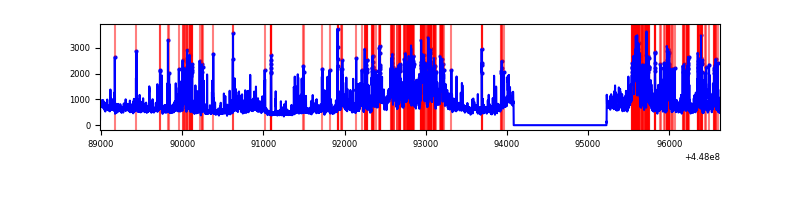 |
| C | 7637 | 6493 | 157 | 157 | 2.06% | 2.42% | 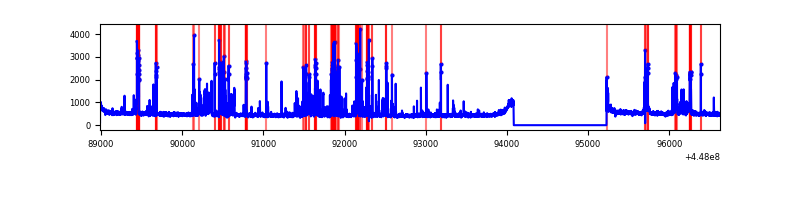 |
| D | 7637 | 6493 | 172 | 172 | 2.25% | 2.65% | 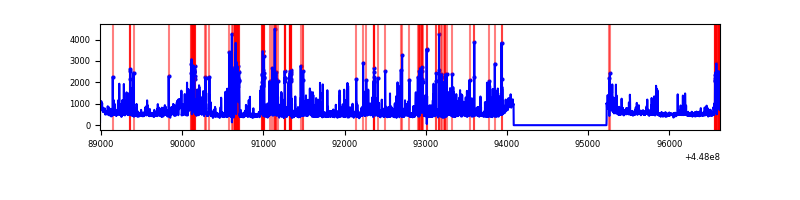 |
Top three noisy pixels from each quadrant. If the there are fewer than three noisy pixels in the level2.evt file, extra rows are filled as -1
| Pixel properties | Quadrant properties | ||||||
|---|---|---|---|---|---|---|---|
| Quadrant | DetID | PixID | Counts | Sigma | Mean | Median | Sigma |
| A | 10 | 83 | 2981866 | 18142.0 | 791 | 774 | 164.3 |
| A | 13 | 248 | 130732 | 790.88 | 791 | 774 | 164.3 |
| A | 4 | 0 | 13683 | 78.56 | 791 | 774 | 164.3 |
| B | 3 | 112 | 2544636 | 17070.06 | 773 | 752 | 149.0 |
| B | 0 | 183 | 80624 | 535.96 | 773 | 752 | 149.0 |
| B | 5 | 172 | 69996 | 464.64 | 773 | 752 | 149.0 |
| C | 14 | 254 | 643190 | 3545.35 | 775 | 781 | 181.2 |
| C | 12 | 2 | 166432 | 914.2 | 775 | 781 | 181.2 |
| C | 12 | 249 | 40991 | 221.91 | 775 | 781 | 181.2 |
| D | 1 | 52 | 813666 | 4160.23 | 776 | 753 | 195.4 |
| D | 13 | 249 | 464921 | 2375.46 | 776 | 753 | 195.4 |
| D | 2 | 249 | 94437 | 479.44 | 776 | 753 | 195.4 |
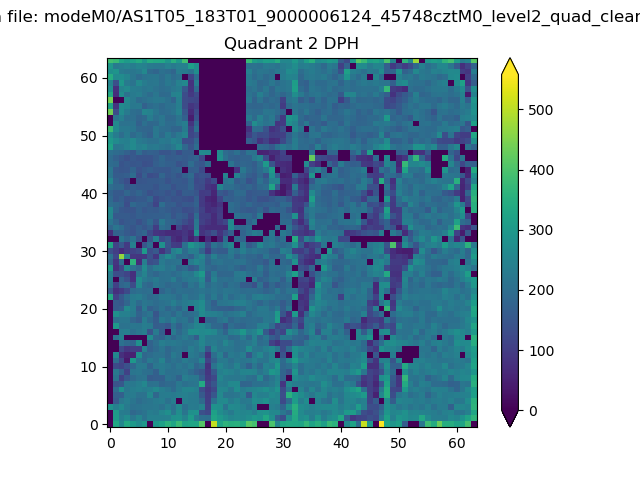
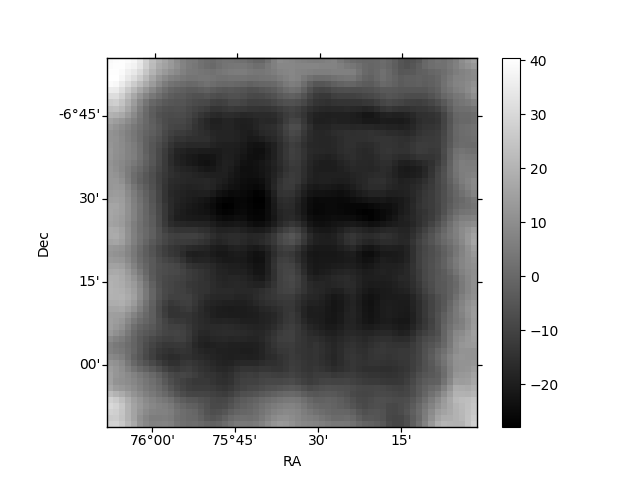
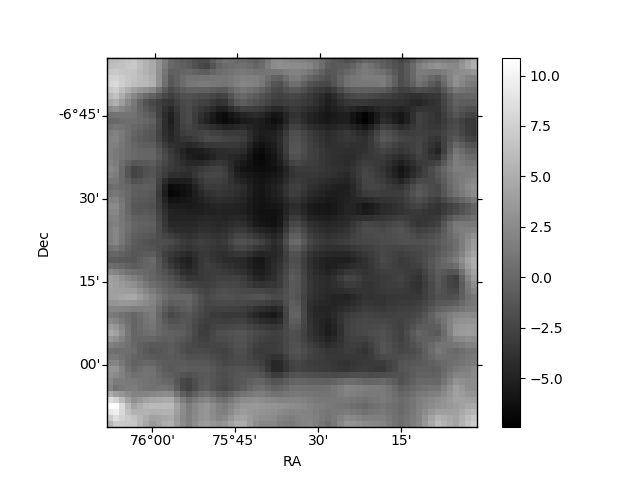
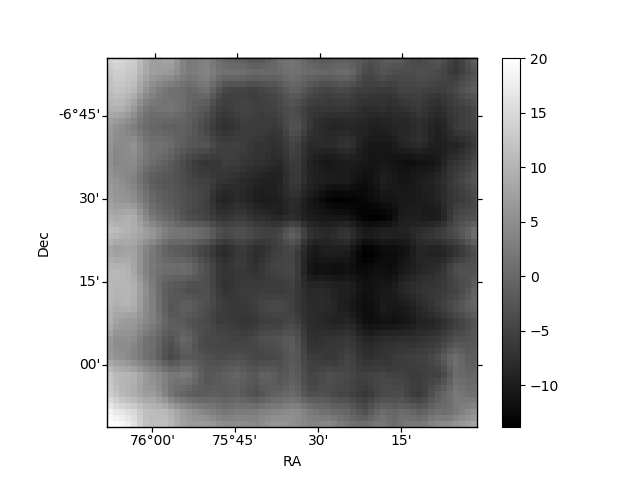
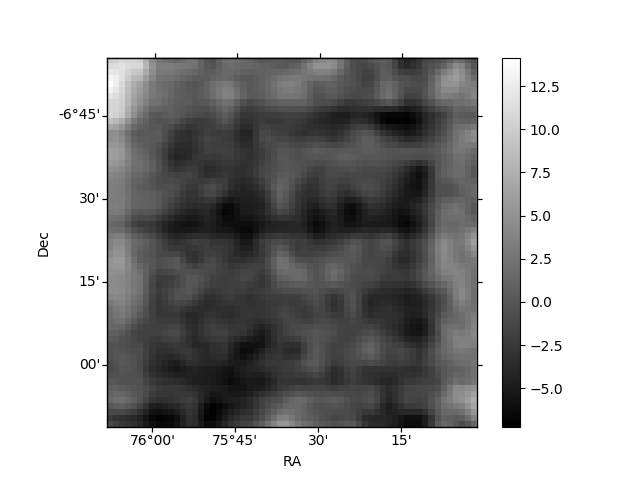
Histogram calculated using DETX and DETY for each event in the final _common_clean file
| Quadrant A | 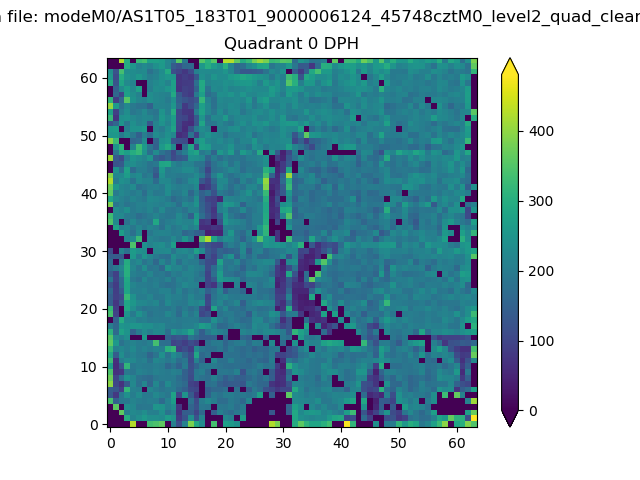 |
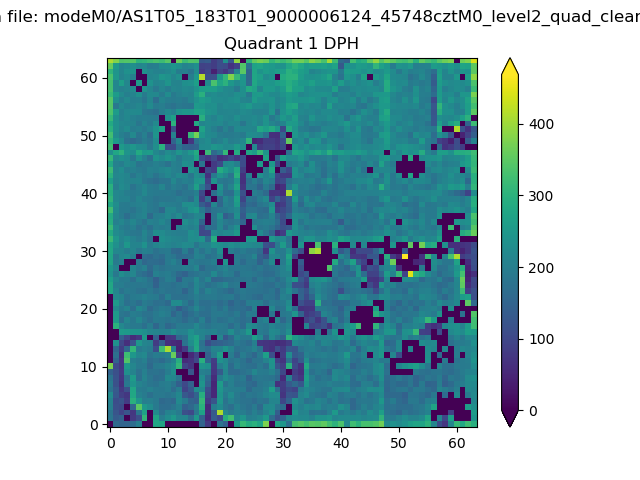 |
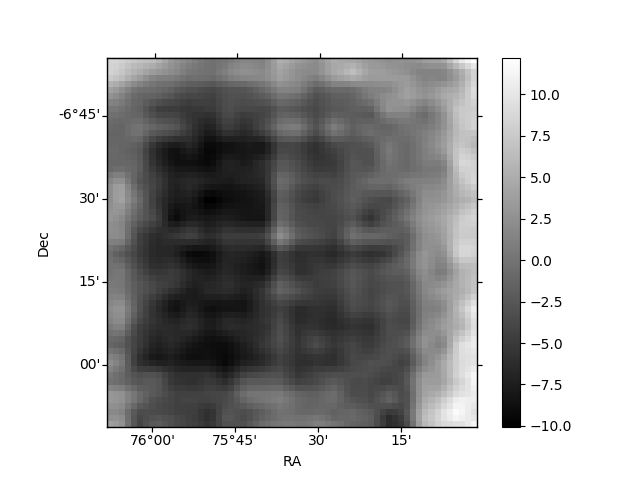
Quadrant B |
|---|---|---|---|
| Quadrant D | 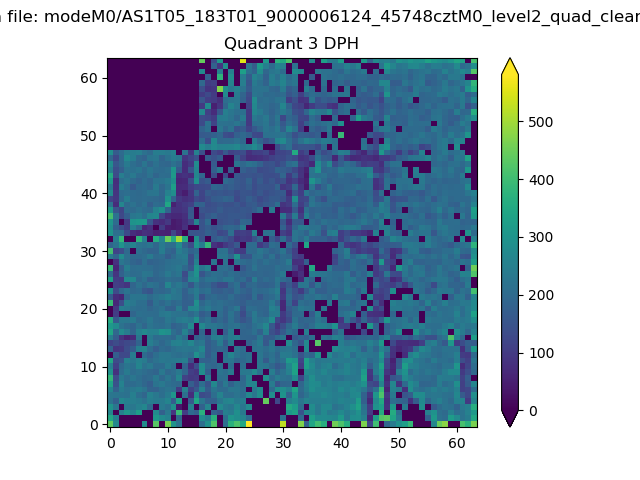 |
 |
Quadrant C |
| Plot type | Count rate plots | Images |
|---|---|---|
| Comparison with Poisson distribution Blue bars denote a histogram of data divided into 1 sec bins. Red curve is a Poisson curve with rate = median count rate of data. |
 |
 |
| Quadrant-wise count rates Data is divided into 100 sec bins |
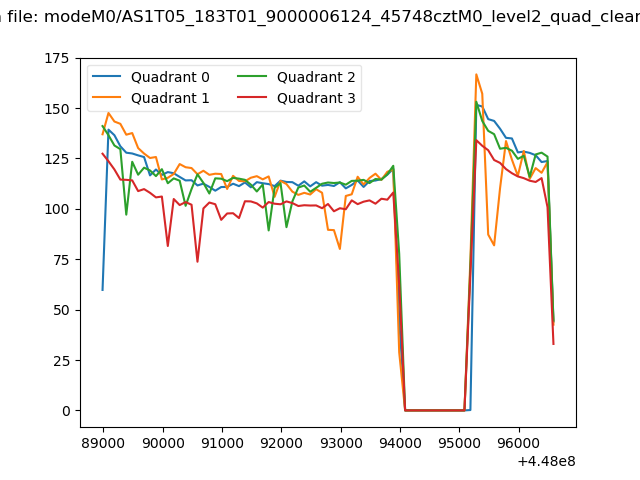 |
|
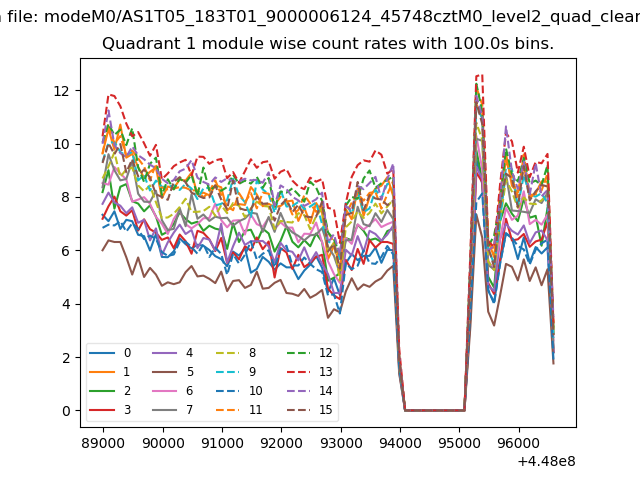
| Module-wise count rates for Quadrant A Data is divided into 100 sec bins |
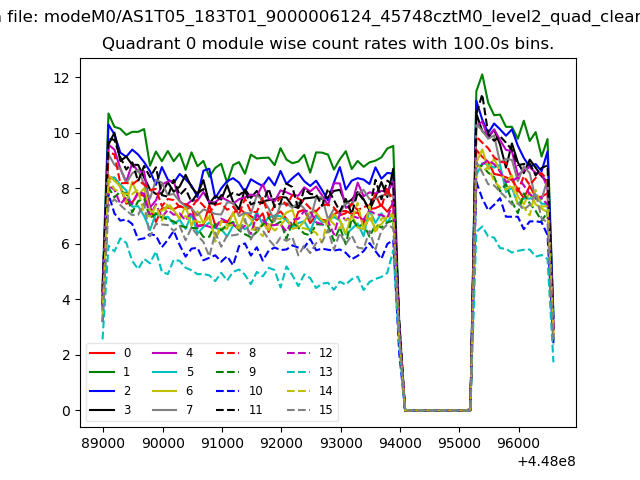 |
 |
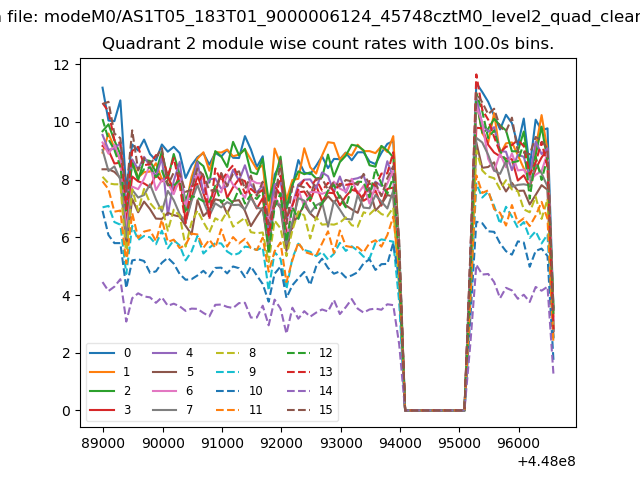
| Module-wise count rates for Quadrant B Data is divided into 100 sec bins |
 |
 |
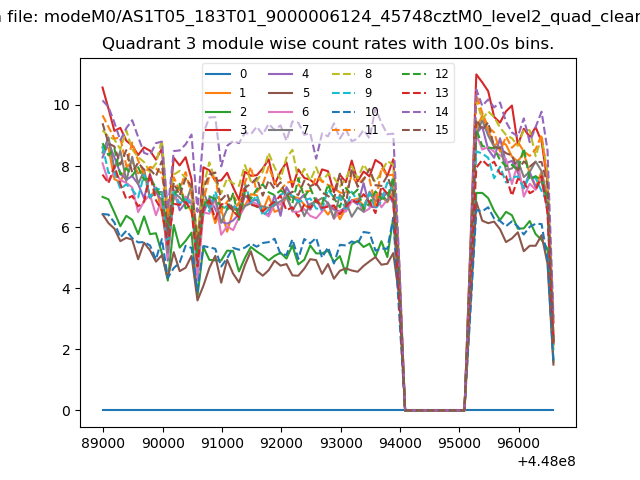
| Module-wise count rates for Quadrant C Data is divided into 100 sec bins |
 |
 |
| Module-wise count rates for Quadrant D Data is divided into 100 sec bins |
 |
 |
| Parameter | Plot |
|---|---|
| CZT HV Monitor |  |
| D_VDD |  |
| Temperature 1 | 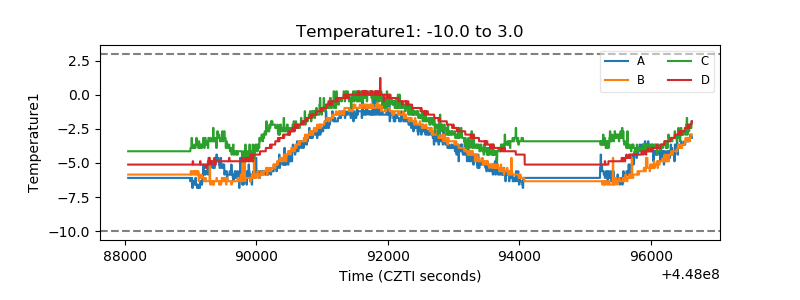 |
| Veto HV Monitor | 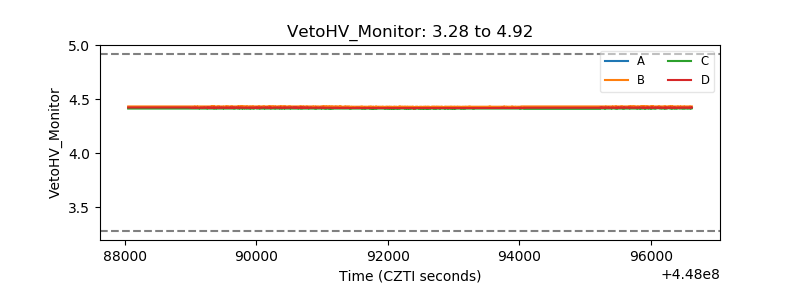 |
| Veto LLD | 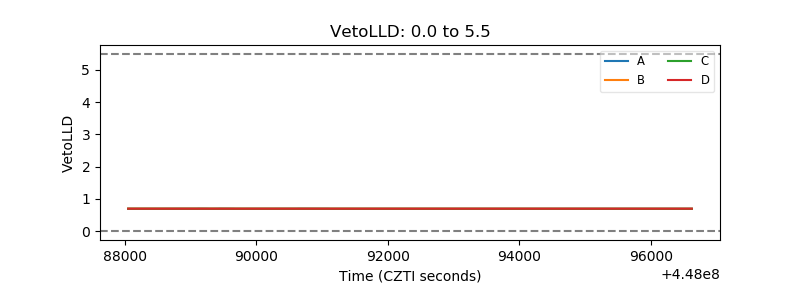 |
| Alpha Counter | 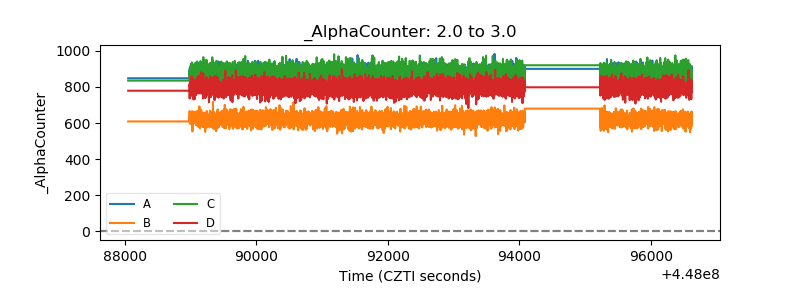 |
| _CPM_Rate | 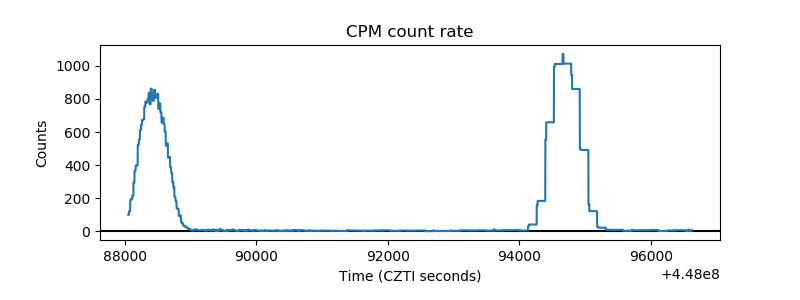 |
| CZT Counter | 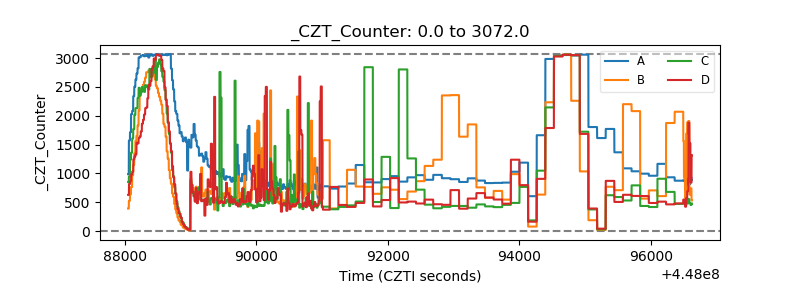 |
| +2.5 Volts monitor | 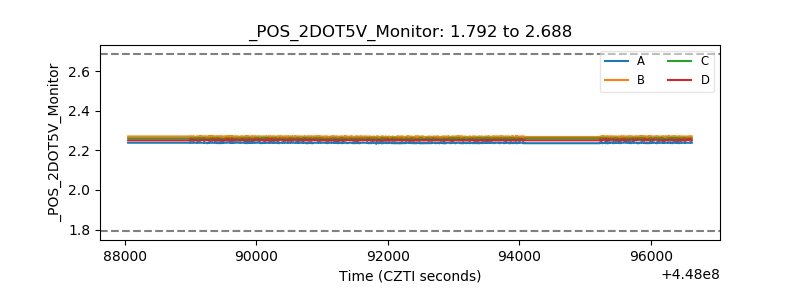 |
| +5 Volts monitor | 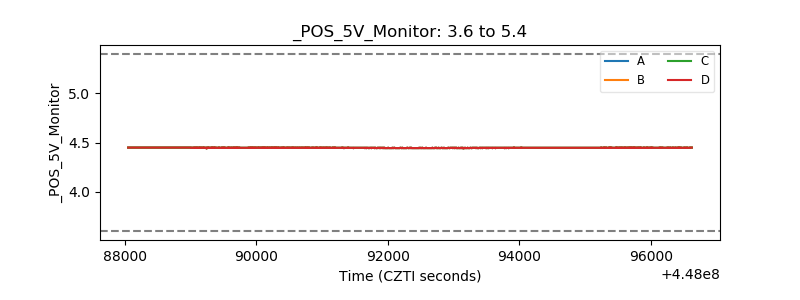 |
| _ROLL_ROT | 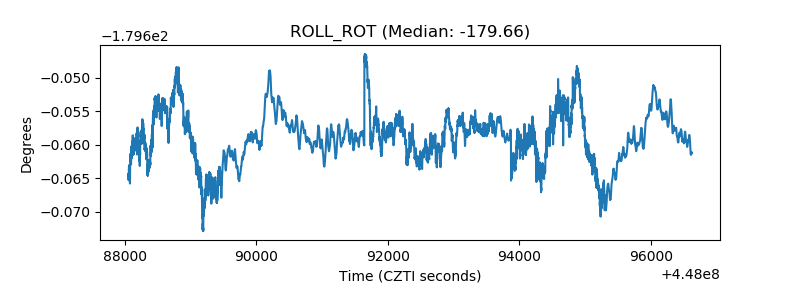 |
| _Roll_DEC | 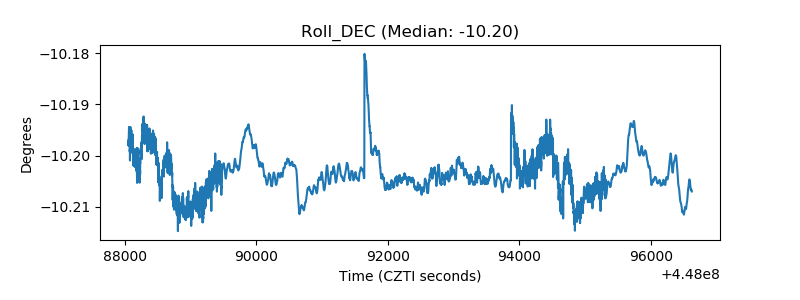 |
| _Roll_RA | 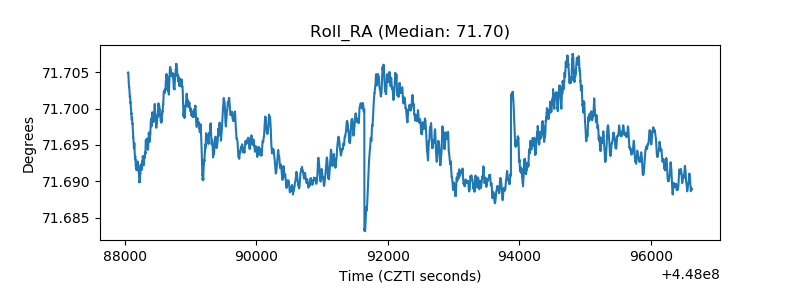 |
| Veto Counter | 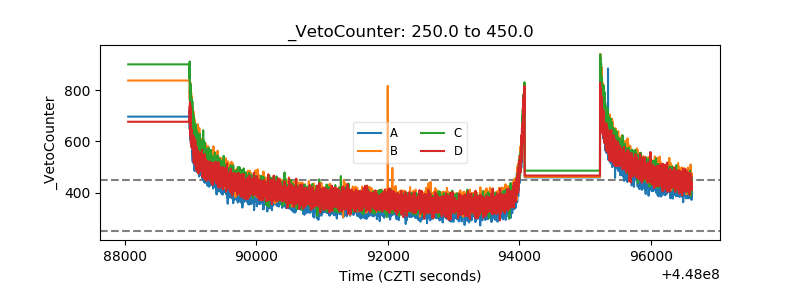 |