| Param | Original file | Final file |
|---|---|---|
| Filename | modeM0/AS1T05_183T01_9000006124_45749cztM0_level2.fits | modeM0/AS1T05_183T01_9000006124_45749cztM0_level2_quad_clean.evt |
| Size (bytes) | 576,385,920 | 105,598,080 |
| Size | 549.7 MB | 100.7 MB |
| Events in quadrant A | 5,824,792 | 735,777 |
| Events in quadrant B | 7,163,294 | 635,729 |
| Events in quadrant C | 3,634,411 | 735,223 |
| Events in quadrant D | 4,241,545 | 665,063 |
| Mode SS | |||
|---|---|---|---|
| Quadrant | BADHDUFLAG | Total packets | Discarded packets |
| A | 0 | 126 | 0 |
| B | 0 | 126 | 0 |
| C | 0 | 124 | 0 |
| D | 0 | 124 | 0 |
| Mode M0 | |||
|---|---|---|---|
| Quadrant | BADHDUFLAG | Total packets | Discarded packets |
| A | 0 | 21152 | 1 |
| B | 0 | 25573 | 1 |
| C | 0 | 14687 | 2 |
| D | 0 | 16481 | 1 |
| Mode M9 | |||
|---|---|---|---|
| Quadrant | BADHDUFLAG | Total packets | Discarded packets |
| A | 0 | 11 | 0 |
| B | 0 | 11 | 0 |
| C | 0 | 11 | 0 |
| D | 0 | 11 | 0 |
| Quadrant | Total seconds | Saturated seconds | Saturation percentage |
|---|---|---|---|
| A | 6095 | 232 | 3.806399% |
| B | 6095 | 1281 | 21.017227% |
| C | 6094 | 215 | 3.528060% |
| D | 6095 | 302 | 4.954881% |
Noise dominated data is calculated using 1-second bins in cleaned event files. If a bin has >2000 counts, and if more than 50% of those come from <1% of pixels, then it is considered to be noise-dominated and hence unusable.
| Quadrant | # 1 sec bins | Bins with >0 counts | Bins with >2000 counts | High rate bins dominated by noise | Noise dominated (total time) | Noise dominated (detector-on time) | Marked lightcurve |
|---|---|---|---|---|---|---|---|
| A | 7275 | 6096 | 8 | 8 | 0.11% | 0.13% | 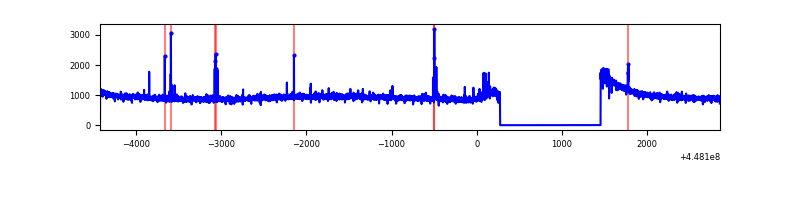 |
| B | 7275 | 6095 | 807 | 807 | 11.09% | 13.24% | 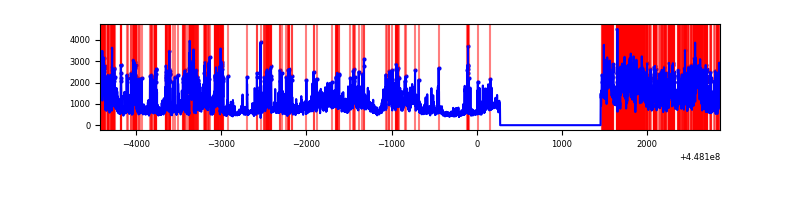 |
| C | 7274 | 6094 | 138 | 138 | 1.90% | 2.26% | 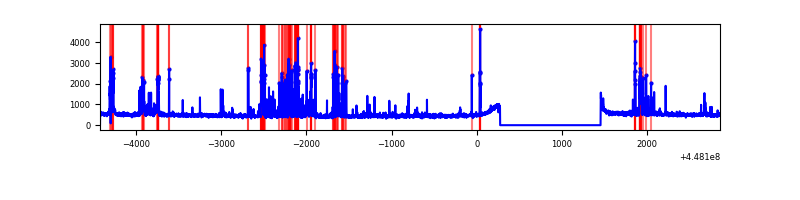 |
| D | 7275 | 6095 | 201 | 201 | 2.76% | 3.30% | 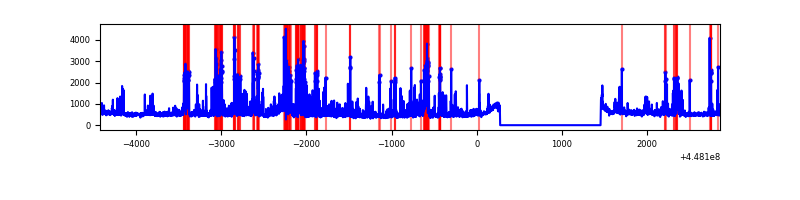 |
Top three noisy pixels from each quadrant. If the there are fewer than three noisy pixels in the level2.evt file, extra rows are filled as -1
| Pixel properties | Quadrant properties | ||||||
|---|---|---|---|---|---|---|---|
| Quadrant | DetID | PixID | Counts | Sigma | Mean | Median | Sigma |
| A | 10 | 83 | 2793966 | 17896.73 | 758 | 744 | 156.1 |
| A | 13 | 248 | 37991 | 238.65 | 758 | 744 | 156.1 |
| A | 14 | 235 | 30960 | 193.6 | 758 | 744 | 156.1 |
| B | 3 | 112 | 3886435 | 28483.58 | 695 | 675 | 136.4 |
| B | 5 | 172 | 241451 | 1764.95 | 695 | 675 | 136.4 |
| B | 5 | 32 | 72153 | 523.95 | 695 | 675 | 136.4 |
| C | 14 | 254 | 651226 | 3775.61 | 737 | 745 | 172.3 |
| C | 12 | 2 | 70296 | 403.7 | 737 | 745 | 172.3 |
| C | 3 | 233 | 21221 | 118.85 | 737 | 745 | 172.3 |
| D | 13 | 249 | 402230 | 2167.94 | 738 | 715 | 185.2 |
| D | 1 | 52 | 350405 | 1888.12 | 738 | 715 | 185.2 |
| D | 1 | 47 | 329612 | 1775.85 | 738 | 715 | 185.2 |
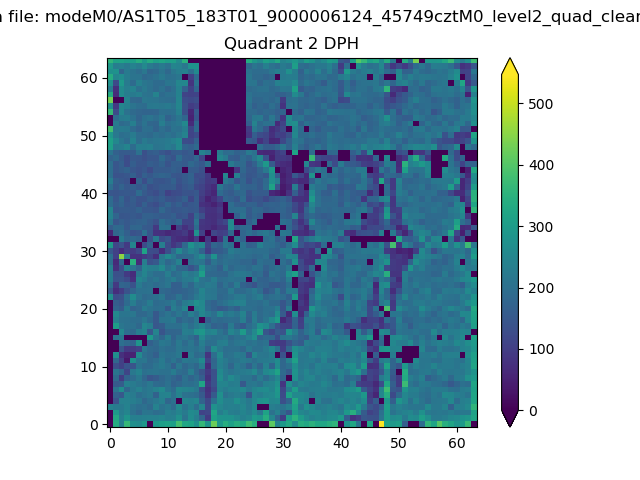
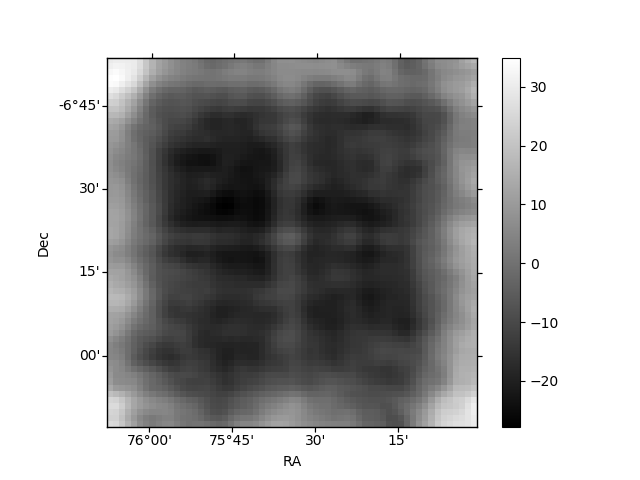
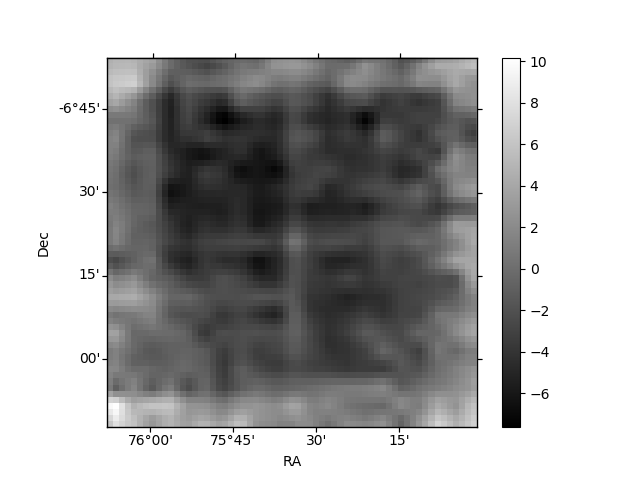
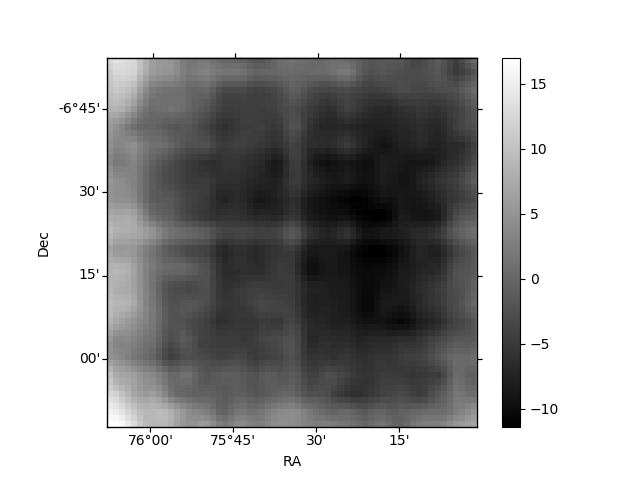
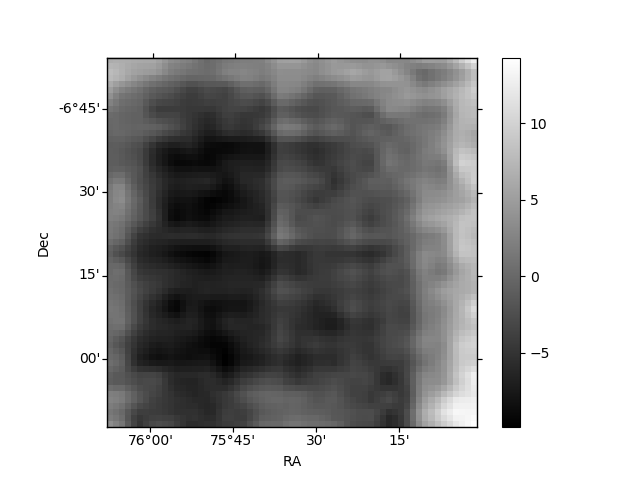
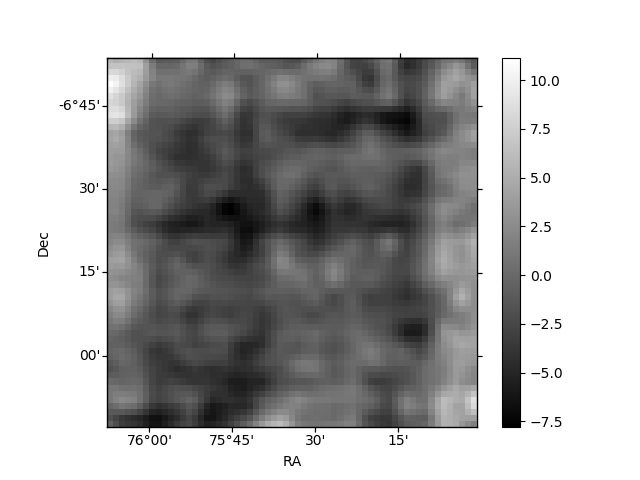
Histogram calculated using DETX and DETY for each event in the final _common_clean file
| Quadrant A | 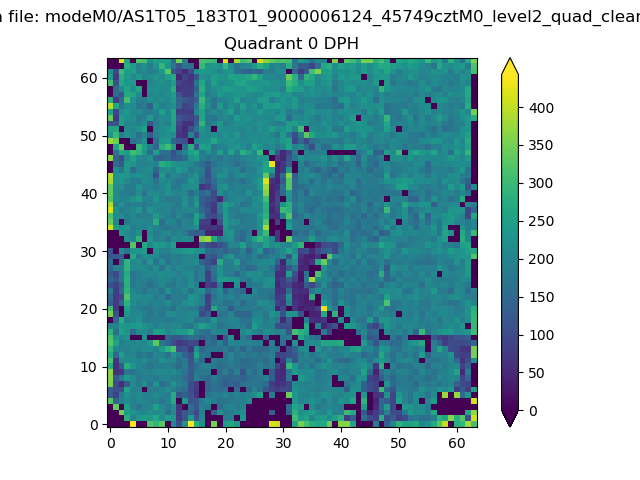 |
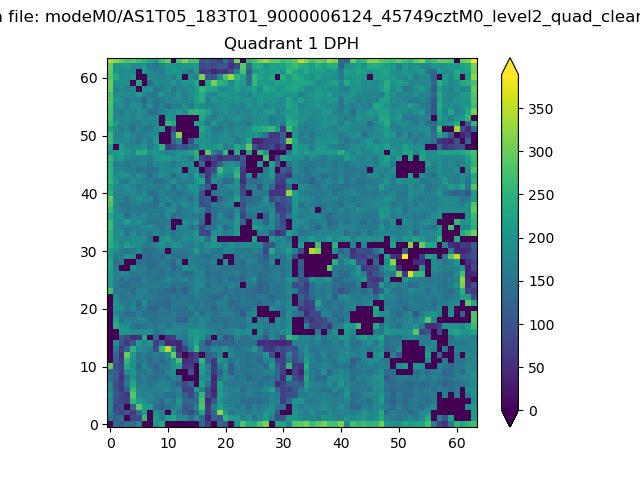 |
Quadrant B |
|---|---|---|---|
| Quadrant D | 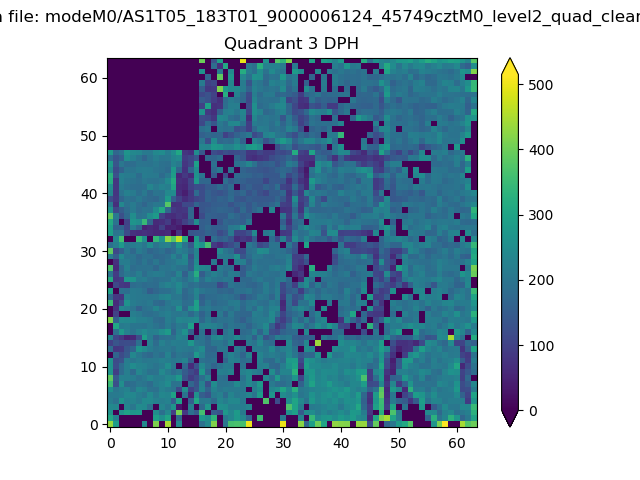 |
 |
Quadrant C |
| Plot type | Count rate plots | Images |
|---|---|---|
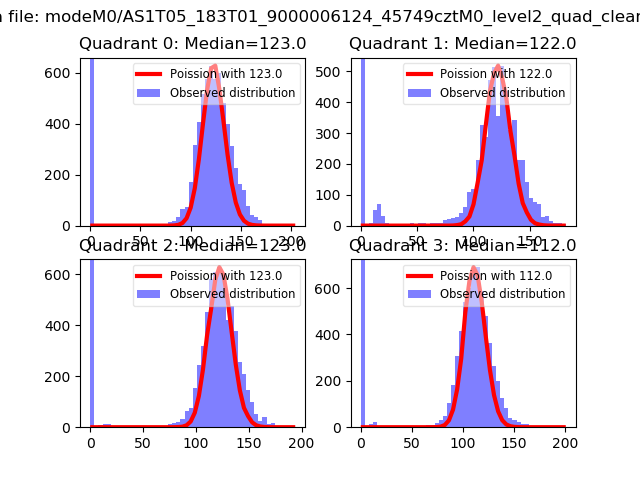
| Comparison with Poisson distribution Blue bars denote a histogram of data divided into 1 sec bins. Red curve is a Poisson curve with rate = median count rate of data. |
 |
 |
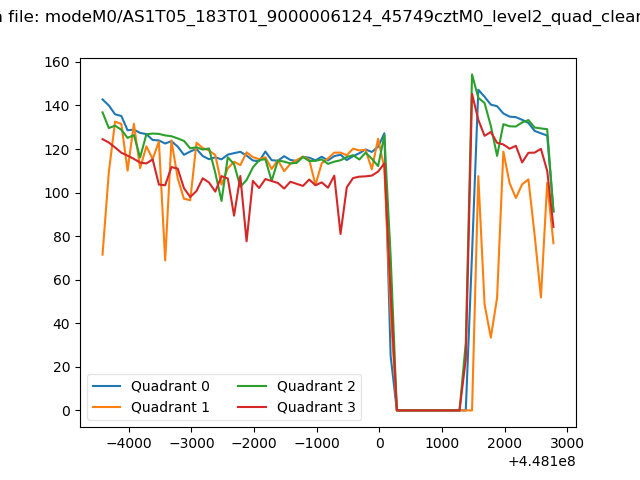
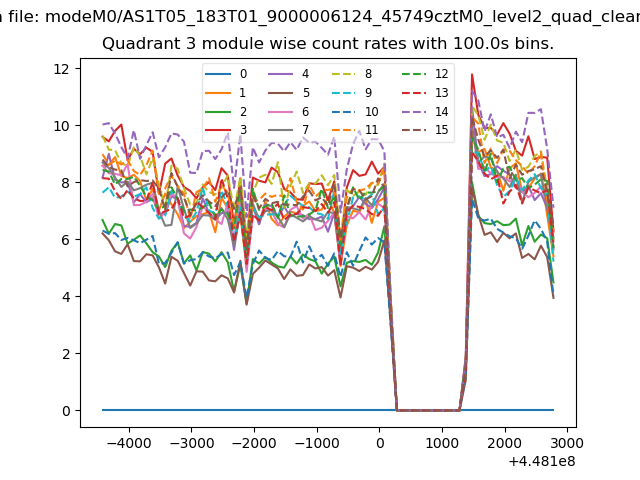
| Quadrant-wise count rates Data is divided into 100 sec bins |
 |
|
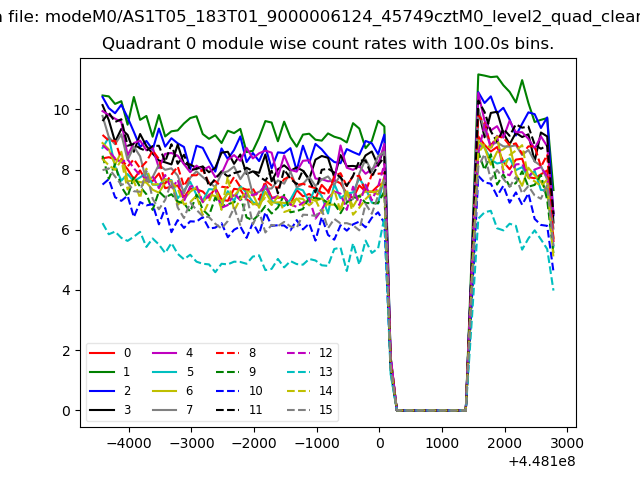
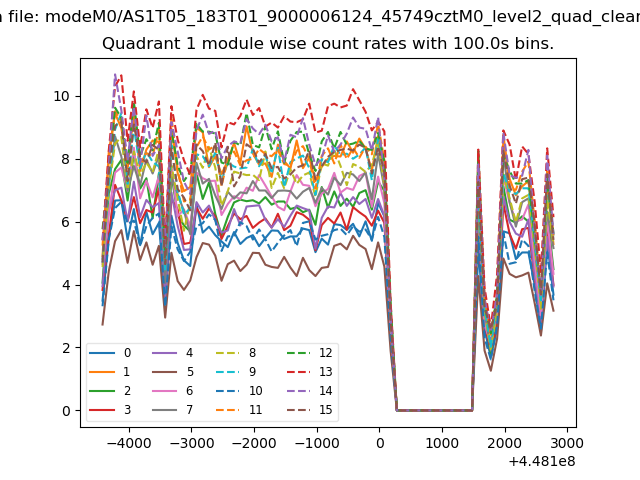
| Module-wise count rates for Quadrant A Data is divided into 100 sec bins |
 |
 |
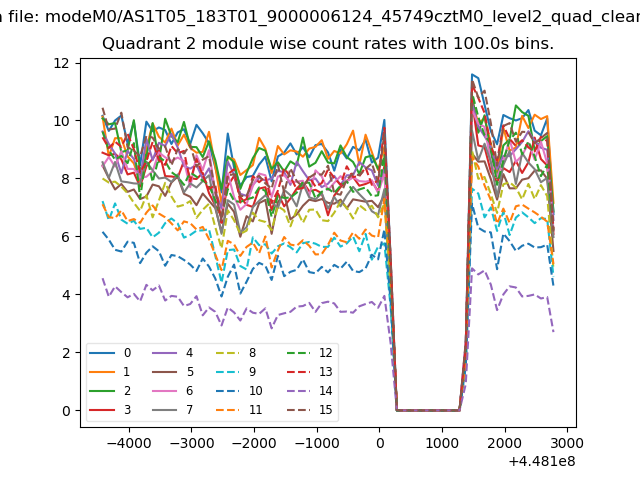
| Module-wise count rates for Quadrant B Data is divided into 100 sec bins |
 |
 |
| Module-wise count rates for Quadrant C Data is divided into 100 sec bins |
 |
 |
| Module-wise count rates for Quadrant D Data is divided into 100 sec bins |
 |
 |
| Parameter | Plot |
|---|---|
| CZT HV Monitor | 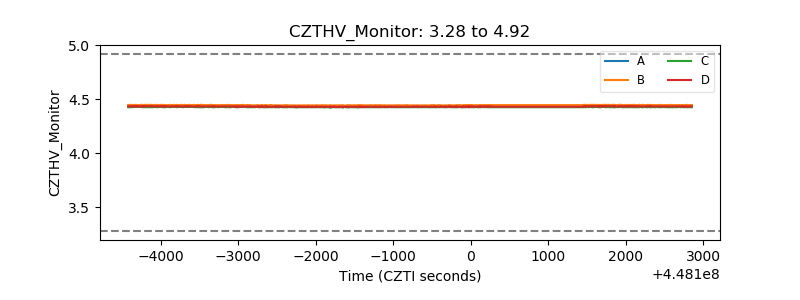 |
| D_VDD | 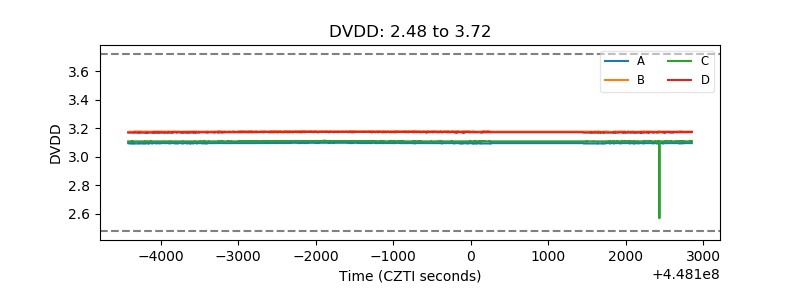 |
| Temperature 1 | 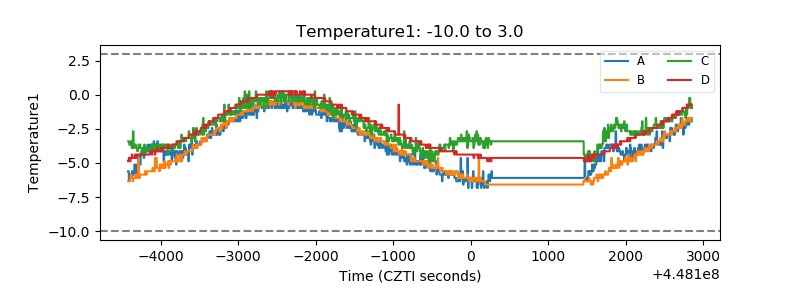 |
| Veto HV Monitor | 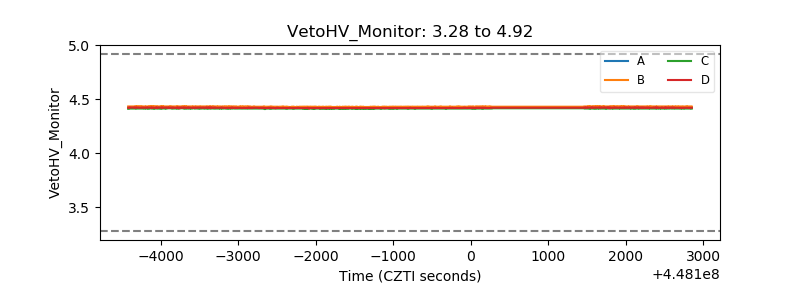 |
| Veto LLD | 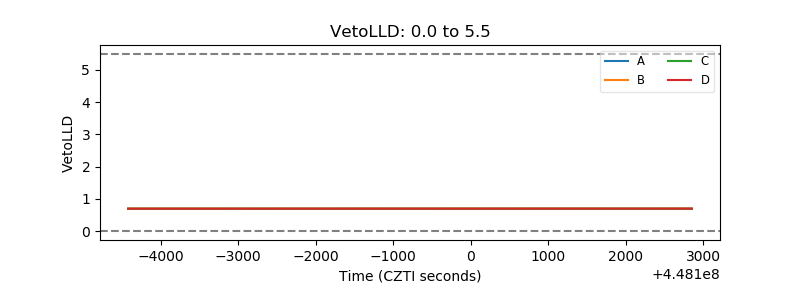 |
| Alpha Counter | 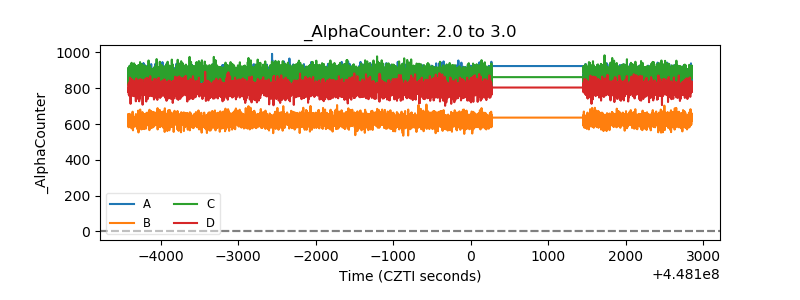 |
| _CPM_Rate | 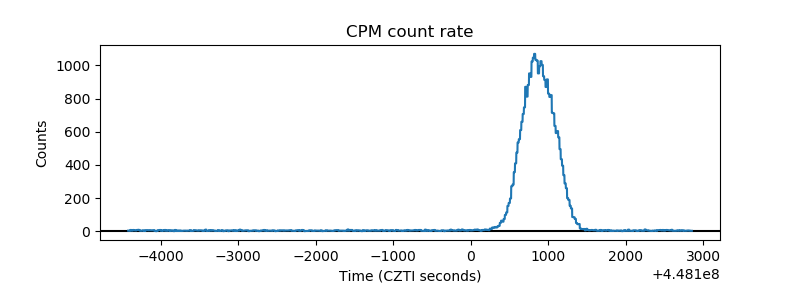 |
| CZT Counter | 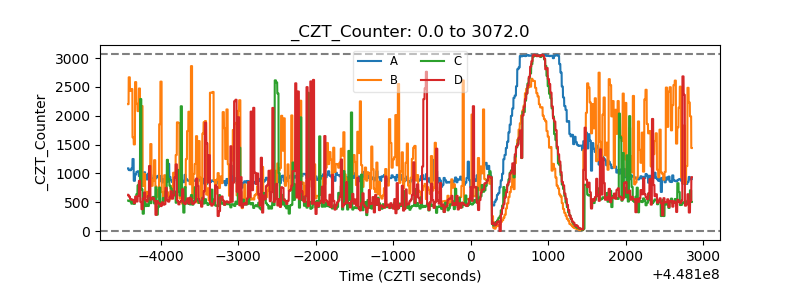 |
| +2.5 Volts monitor |  |
| +5 Volts monitor | 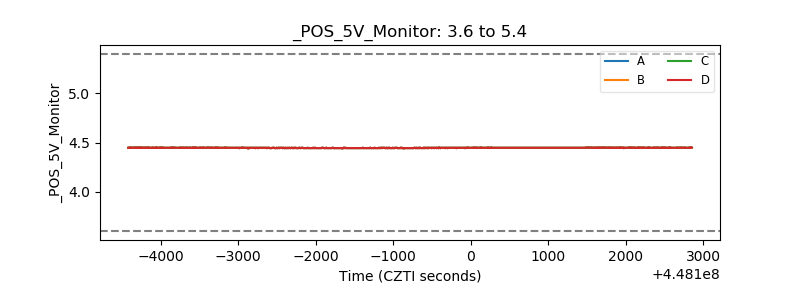 |
| _ROLL_ROT | 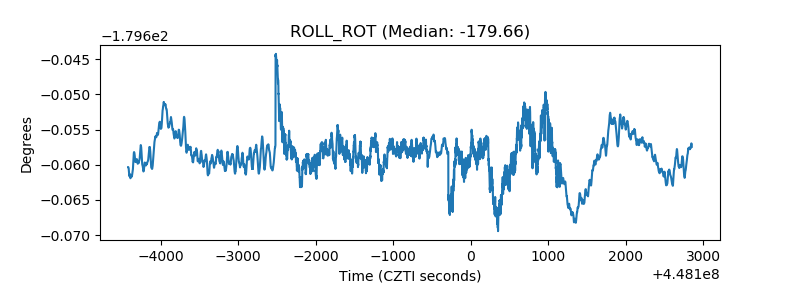 |
| _Roll_DEC | 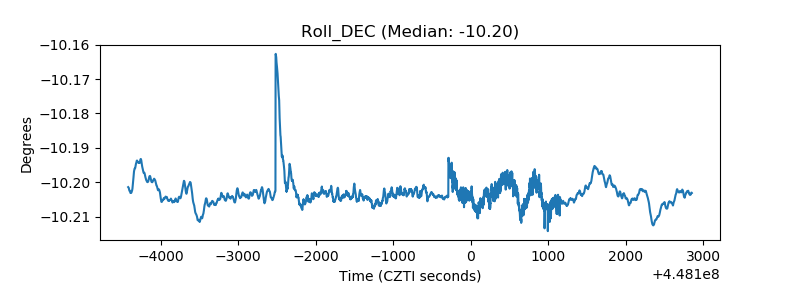 |
| _Roll_RA | 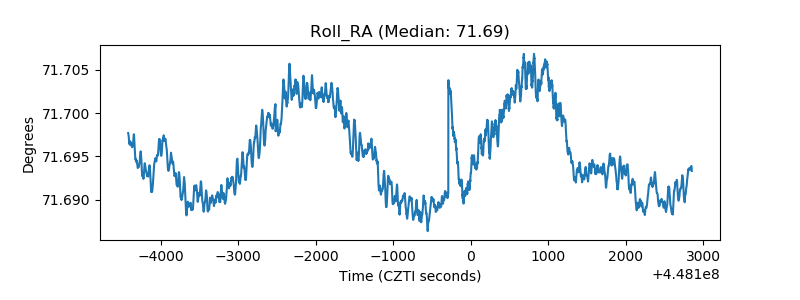 |
| Veto Counter | 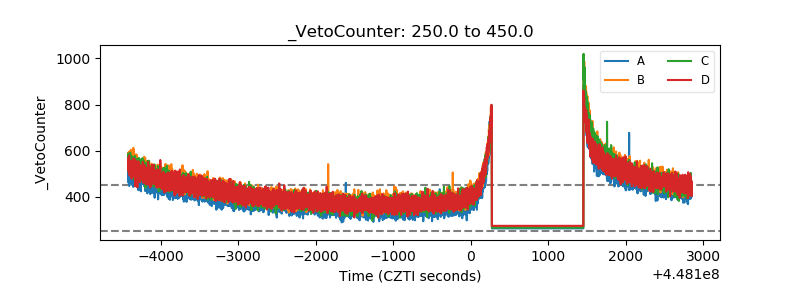 |