| Param | Original file | Final file |
|---|---|---|
| Filename | modeM0/AS1T05_183T01_9000006124_45750cztM0_level2.fits | modeM0/AS1T05_183T01_9000006124_45750cztM0_level2_quad_clean.evt |
| Size (bytes) | 543,121,920 | 97,871,040 |
| Size | 518.0 MB | 93.3 MB |
| Events in quadrant A | 5,456,011 | 681,129 |
| Events in quadrant B | 6,417,002 | 581,487 |
| Events in quadrant C | 3,049,856 | 691,860 |
| Events in quadrant D | 4,735,035 | 606,073 |
| Mode SS | |||
|---|---|---|---|
| Quadrant | BADHDUFLAG | Total packets | Discarded packets |
| A | 0 | 118 | 0 |
| B | 0 | 118 | 0 |
| C | 0 | 118 | 0 |
| D | 0 | 118 | 0 |
| Mode M0 | |||
|---|---|---|---|
| Quadrant | BADHDUFLAG | Total packets | Discarded packets |
| A | 0 | 19768 | 1 |
| B | 0 | 23078 | 1 |
| C | 0 | 12833 | 1 |
| D | 0 | 17860 | 1 |
| Mode M9 | |||
|---|---|---|---|
| Quadrant | BADHDUFLAG | Total packets | Discarded packets |
| A | 0 | 12 | 0 |
| B | 0 | 12 | 0 |
| C | 0 | 12 | 0 |
| D | 0 | 12 | 0 |
| Quadrant | Total seconds | Saturated seconds | Saturation percentage |
|---|---|---|---|
| A | 5761 | 239 | 4.148585% |
| B | 5762 | 1291 | 22.405415% |
| C | 5762 | 126 | 2.186741% |
| D | 5762 | 439 | 7.618882% |
Noise dominated data is calculated using 1-second bins in cleaned event files. If a bin has >2000 counts, and if more than 50% of those come from <1% of pixels, then it is considered to be noise-dominated and hence unusable.
| Quadrant | # 1 sec bins | Bins with >0 counts | Bins with >2000 counts | High rate bins dominated by noise | Noise dominated (total time) | Noise dominated (detector-on time) | Marked lightcurve |
|---|---|---|---|---|---|---|---|
| A | 6941 | 5762 | 12 | 12 | 0.17% | 0.21% | 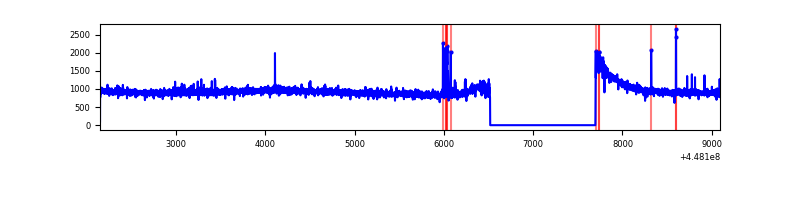 |
| B | 6942 | 5763 | 847 | 847 | 12.20% | 14.70% | 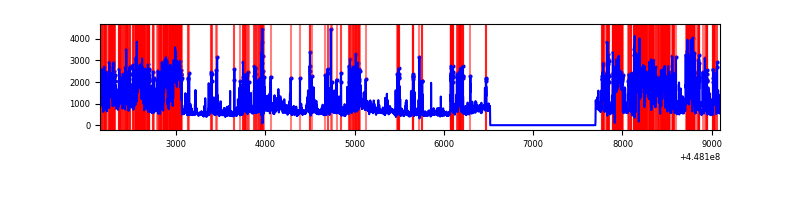 |
| C | 6942 | 5763 | 39 | 39 | 0.56% | 0.68% | 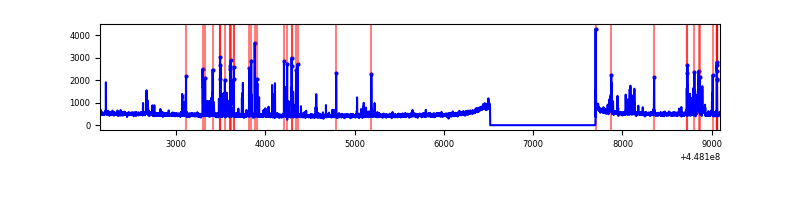 |
| D | 6942 | 5763 | 304 | 304 | 4.38% | 5.28% | 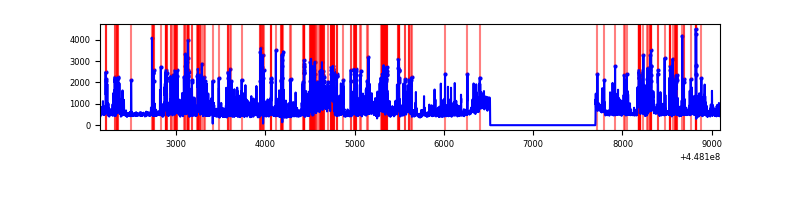 |
Top three noisy pixels from each quadrant. If the there are fewer than three noisy pixels in the level2.evt file, extra rows are filled as -1
| Pixel properties | Quadrant properties | ||||||
|---|---|---|---|---|---|---|---|
| Quadrant | DetID | PixID | Counts | Sigma | Mean | Median | Sigma |
| A | 10 | 83 | 2636948 | 18063.34 | 704 | 691 | 145.9 |
| A | 14 | 235 | 44352 | 299.16 | 704 | 691 | 145.9 |
| A | 0 | 243 | 19991 | 132.24 | 704 | 691 | 145.9 |
| B | 3 | 112 | 2899563 | 23209.57 | 640 | 622 | 124.9 |
| B | 5 | 172 | 697865 | 5582.28 | 640 | 622 | 124.9 |
| B | 5 | 32 | 71422 | 566.84 | 640 | 622 | 124.9 |
| C | 14 | 254 | 267092 | 1656.84 | 688 | 693 | 160.8 |
| C | 12 | 2 | 50383 | 309.04 | 688 | 693 | 160.8 |
| C | 14 | 96 | 35022 | 213.51 | 688 | 693 | 160.8 |
| D | 1 | 52 | 1144277 | 6694.93 | 681 | 661 | 170.8 |
| D | 13 | 249 | 343401 | 2006.46 | 681 | 661 | 170.8 |
| D | 5 | 171 | 192281 | 1121.78 | 681 | 661 | 170.8 |
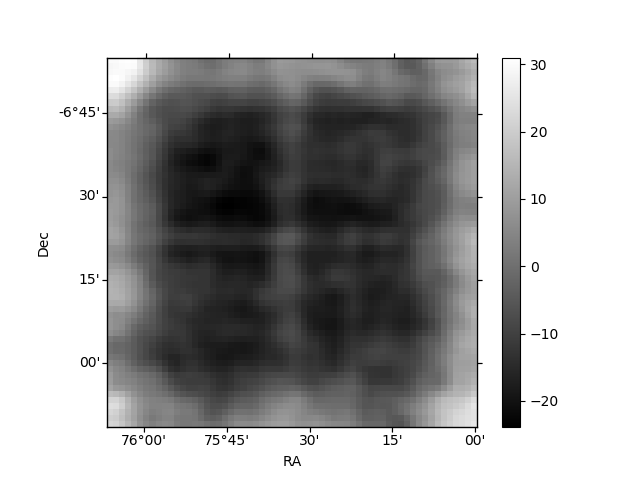
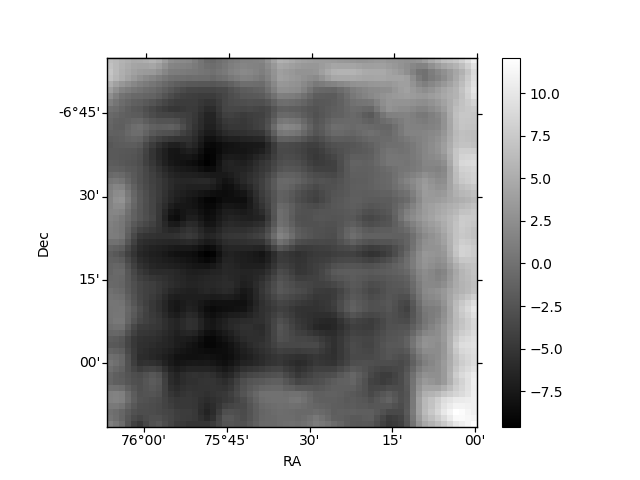
Histogram calculated using DETX and DETY for each event in the final _common_clean file
| Quadrant A | 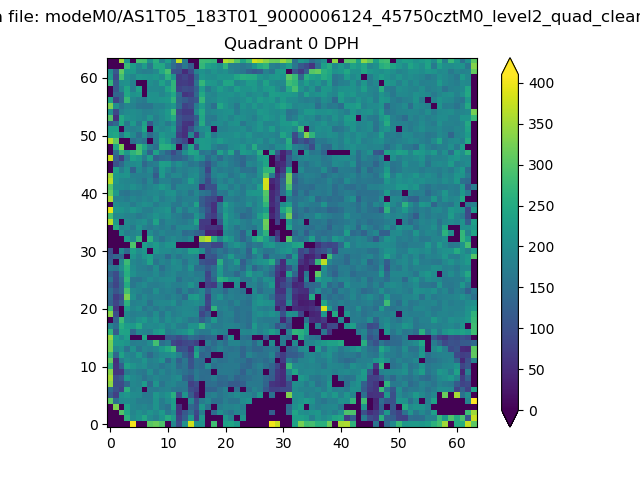 |
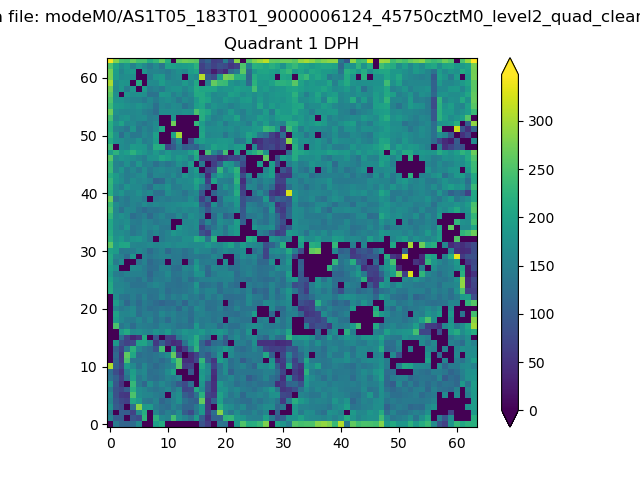 |
Quadrant B |
|---|---|---|---|
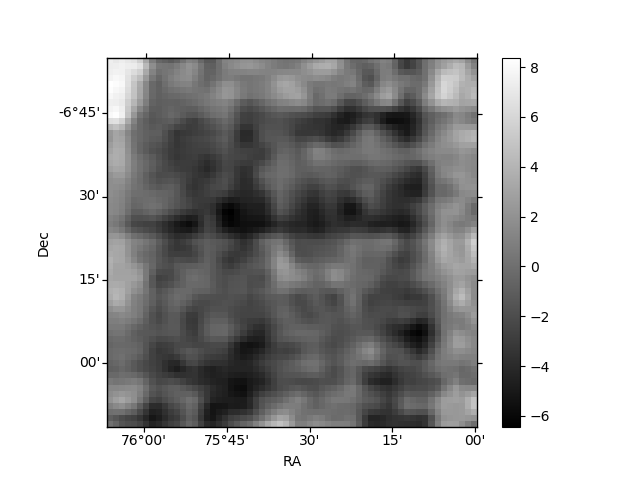
| Quadrant D | 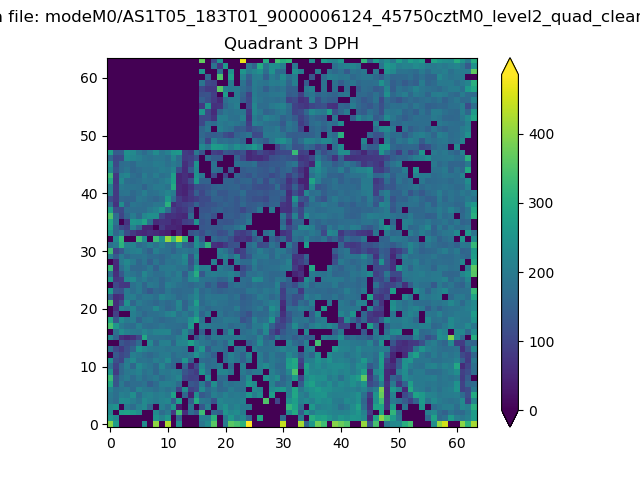 |
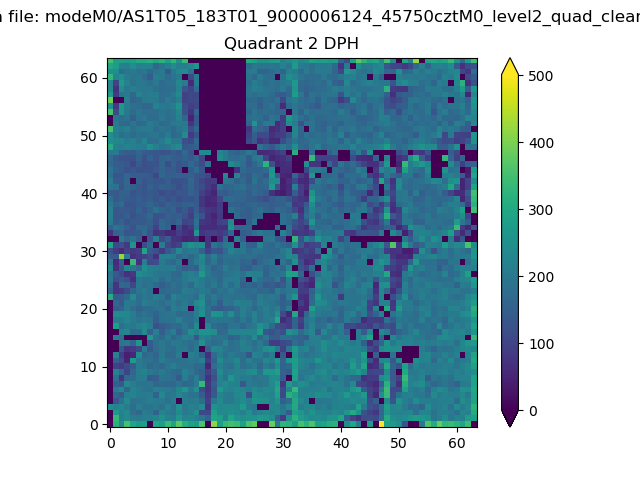 |
Quadrant C |
| Plot type | Count rate plots | Images |
|---|---|---|
| Comparison with Poisson distribution Blue bars denote a histogram of data divided into 1 sec bins. Red curve is a Poisson curve with rate = median count rate of data. |
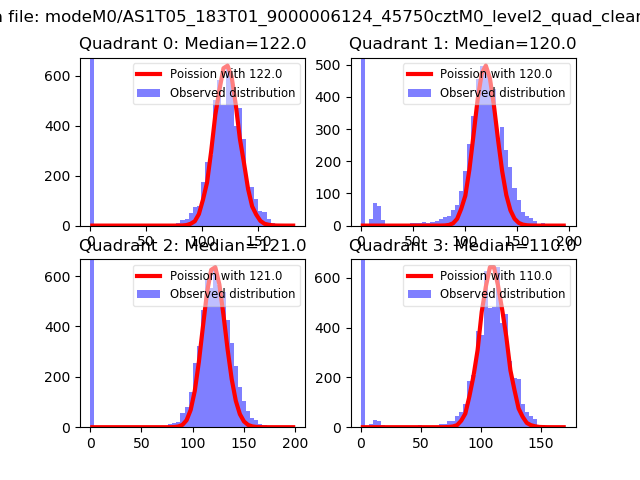 |
 |
| Quadrant-wise count rates Data is divided into 100 sec bins |
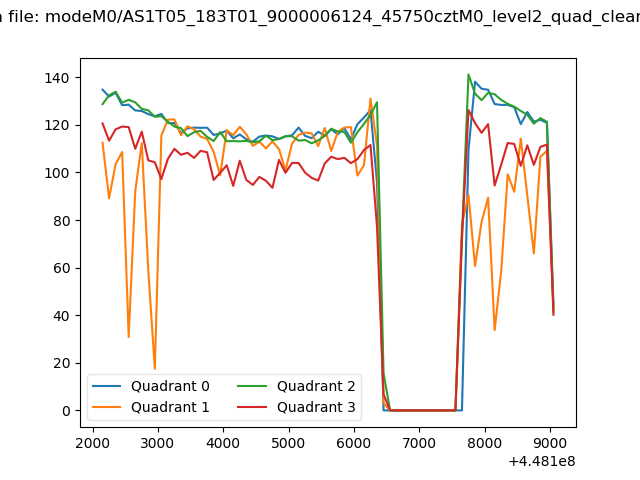 |
|
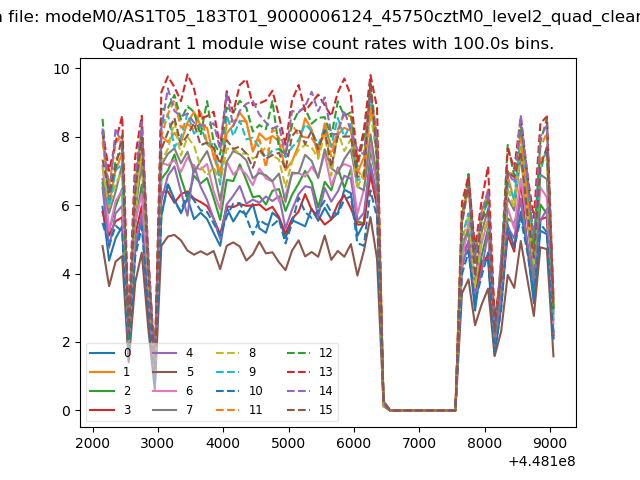
| Module-wise count rates for Quadrant A Data is divided into 100 sec bins |
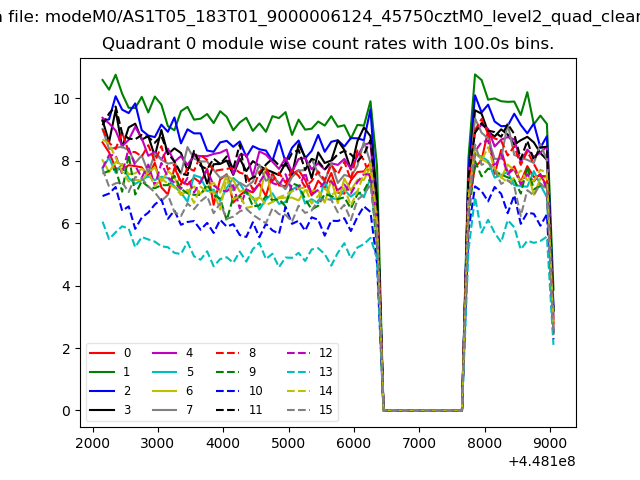 |
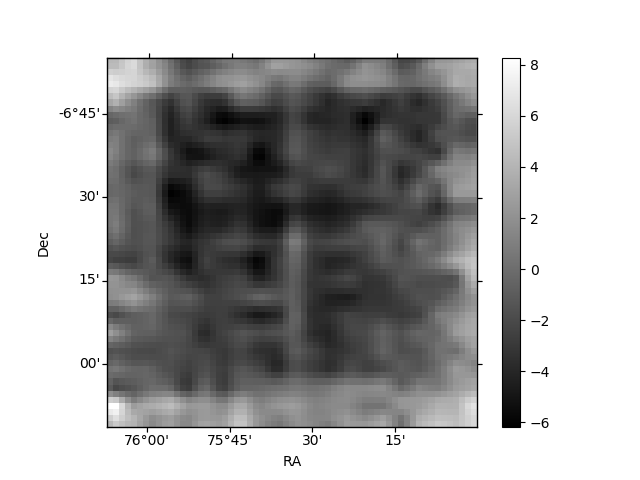 |
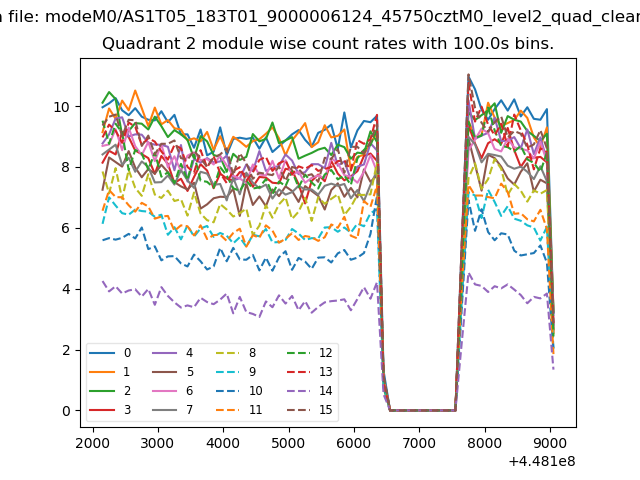
| Module-wise count rates for Quadrant B Data is divided into 100 sec bins |
 |
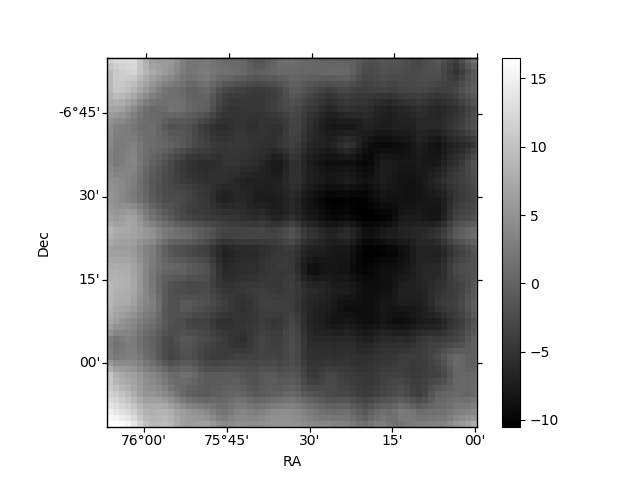 |
| Module-wise count rates for Quadrant C Data is divided into 100 sec bins |
 |
 |
| Module-wise count rates for Quadrant D Data is divided into 100 sec bins |
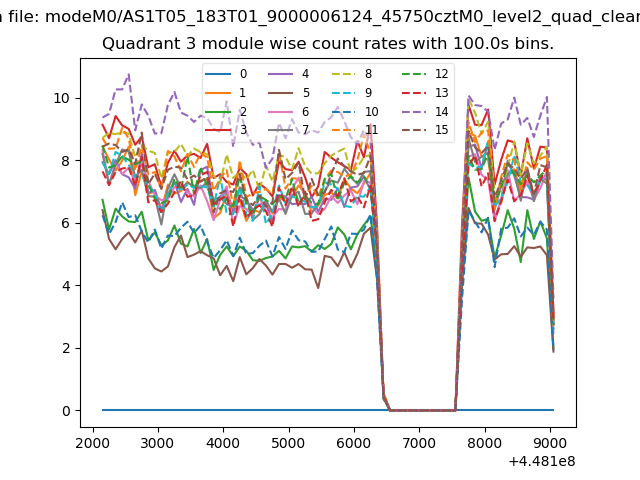 |
 |
| Parameter | Plot |
|---|---|
| CZT HV Monitor | 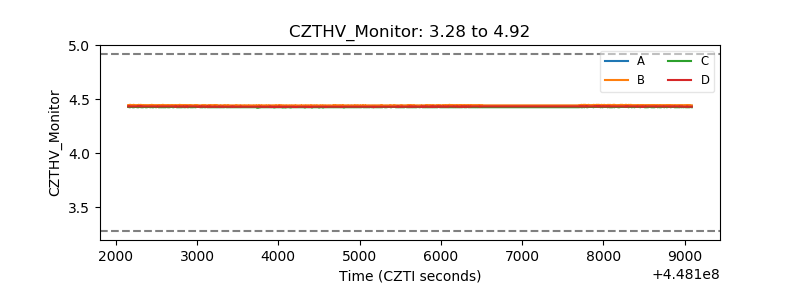 |
| D_VDD | 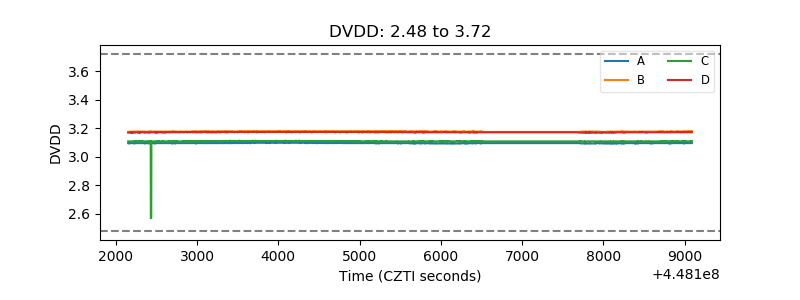 |
| Temperature 1 | 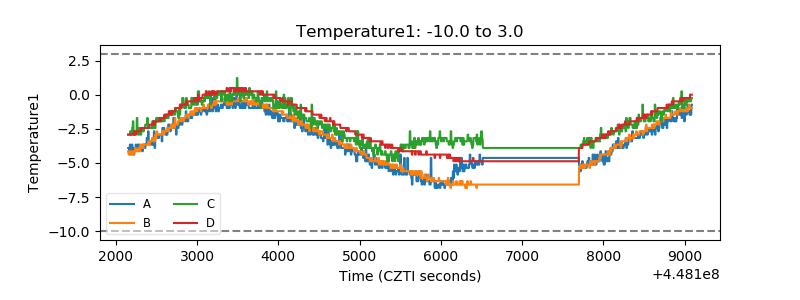 |
| Veto HV Monitor | 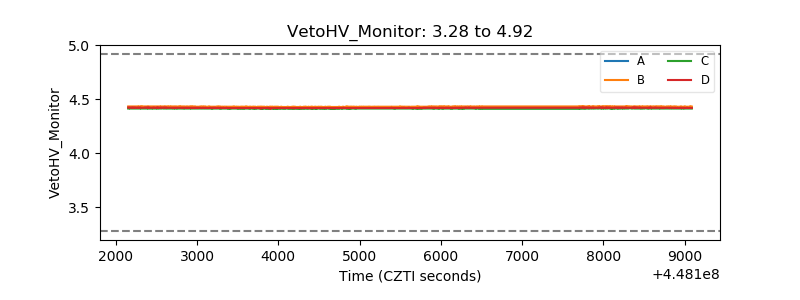 |
| Veto LLD | 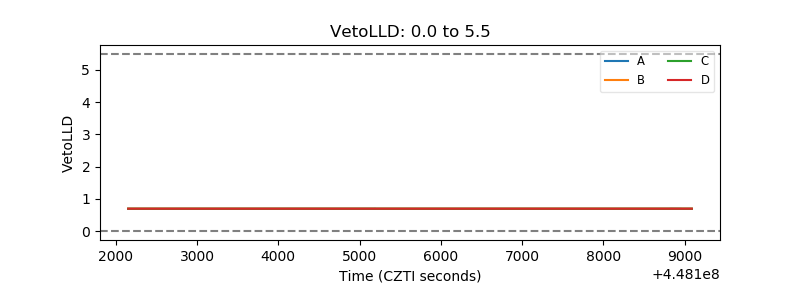 |
| Alpha Counter | 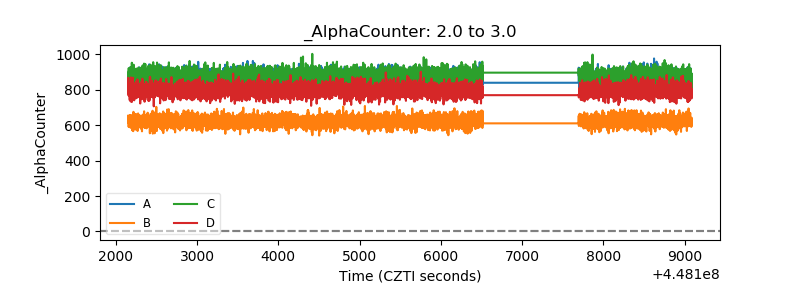 |
| _CPM_Rate | 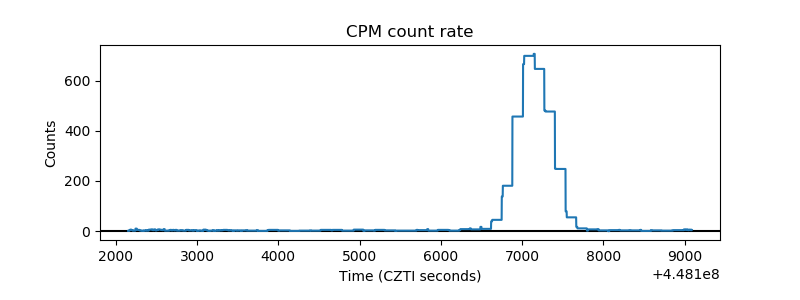 |
| CZT Counter | 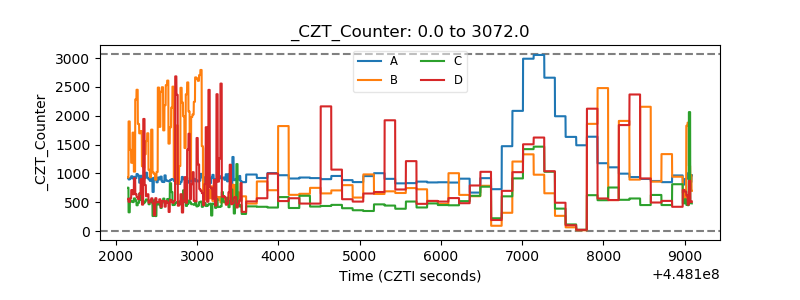 |
| +2.5 Volts monitor |  |
| +5 Volts monitor | 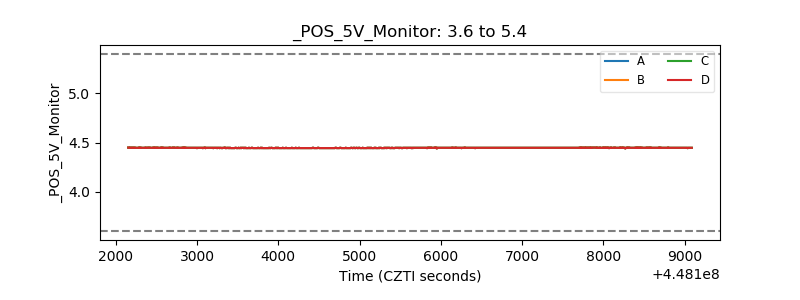 |
| _ROLL_ROT | 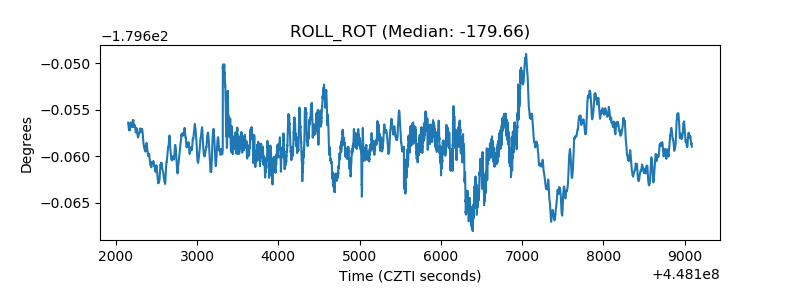 |
| _Roll_DEC | 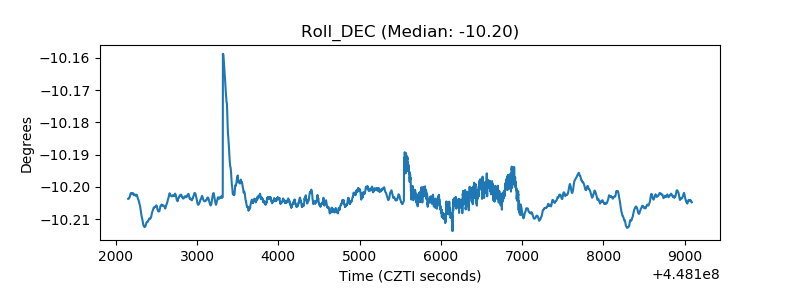 |
| _Roll_RA | 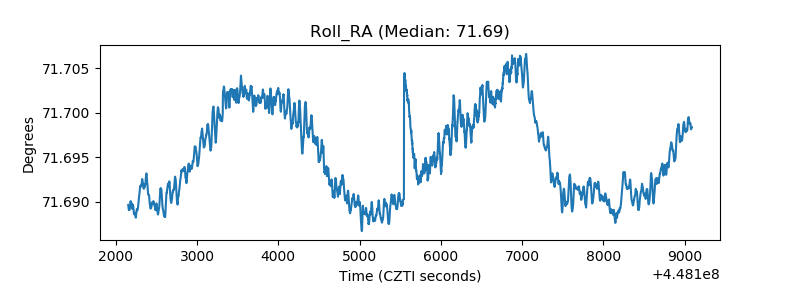 |
| Veto Counter | 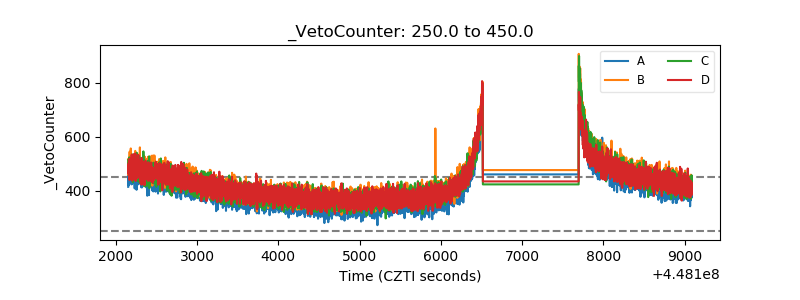 |