| Param | Original file | Final file |
|---|---|---|
| Filename | modeM0/AS1T05_183T01_9000006124_45751cztM0_level2.fits | modeM0/AS1T05_183T01_9000006124_45751cztM0_level2_quad_clean.evt |
| Size (bytes) | 595,091,520 | 110,776,320 |
| Size | 567.5 MB | 105.6 MB |
| Events in quadrant A | 6,232,628 | 757,059 |
| Events in quadrant B | 6,512,645 | 695,734 |
| Events in quadrant C | 3,436,620 | 771,434 |
| Events in quadrant D | 5,331,954 | 666,798 |
| Mode SS | |||
|---|---|---|---|
| Quadrant | BADHDUFLAG | Total packets | Discarded packets |
| A | 0 | 136 | 0 |
| B | 0 | 136 | 0 |
| C | 0 | 136 | 0 |
| D | 0 | 136 | 0 |
| Mode M0 | |||
|---|---|---|---|
| Quadrant | BADHDUFLAG | Total packets | Discarded packets |
| A | 0 | 22577 | 1 |
| B | 0 | 23991 | 1 |
| C | 0 | 14778 | 2 |
| D | 0 | 20286 | 1 |
| Mode M9 | |||
|---|---|---|---|
| Quadrant | BADHDUFLAG | Total packets | Discarded packets |
| A | 0 | 10 | 0 |
| B | 0 | 10 | 0 |
| C | 0 | 10 | 0 |
| D | 0 | 10 | 0 |
| Quadrant | Total seconds | Saturated seconds | Saturation percentage |
|---|---|---|---|
| A | 6640 | 299 | 4.503012% |
| B | 6640 | 1029 | 15.496988% |
| C | 6639 | 152 | 2.289501% |
| D | 6639 | 566 | 8.525380% |
Noise dominated data is calculated using 1-second bins in cleaned event files. If a bin has >2000 counts, and if more than 50% of those come from <1% of pixels, then it is considered to be noise-dominated and hence unusable.
| Quadrant | # 1 sec bins | Bins with >0 counts | Bins with >2000 counts | High rate bins dominated by noise | Noise dominated (total time) | Noise dominated (detector-on time) | Marked lightcurve |
|---|---|---|---|---|---|---|---|
| A | 7690 | 6641 | 6 | 6 | 0.08% | 0.09% | 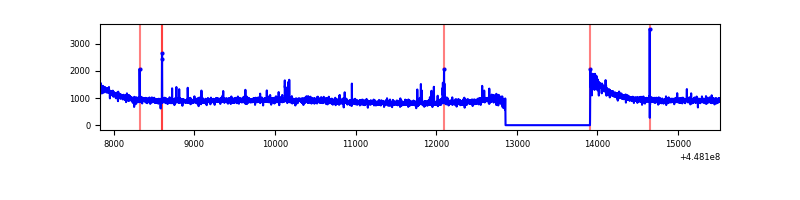 |
| B | 7690 | 6641 | 554 | 554 | 7.20% | 8.34% | 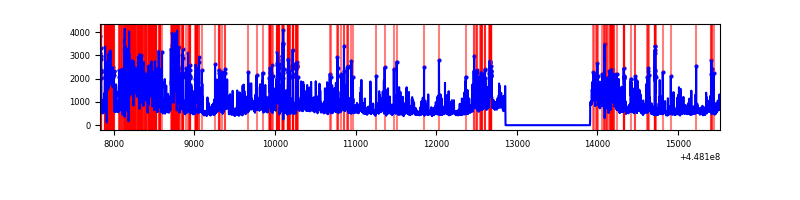 |
| C | 7689 | 6640 | 58 | 58 | 0.75% | 0.87% | 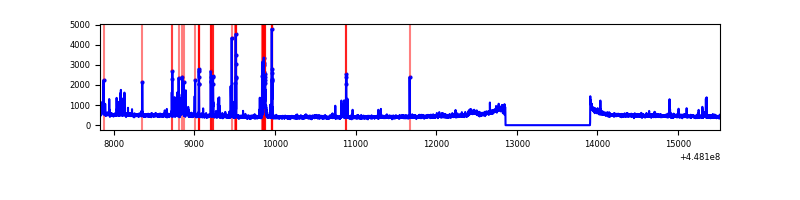 |
| D | 7689 | 6640 | 336 | 336 | 4.37% | 5.06% | 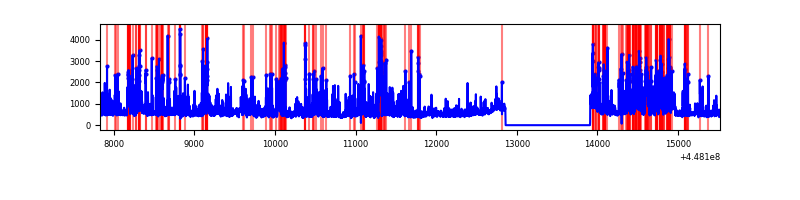 |
Top three noisy pixels from each quadrant. If the there are fewer than three noisy pixels in the level2.evt file, extra rows are filled as -1
| Pixel properties | Quadrant properties | ||||||
|---|---|---|---|---|---|---|---|
| Quadrant | DetID | PixID | Counts | Sigma | Mean | Median | Sigma |
| A | 10 | 83 | 3028588 | 18485.89 | 799 | 783 | 163.8 |
| A | 13 | 248 | 26404 | 156.43 | 799 | 783 | 163.8 |
| A | 12 | 189 | 22480 | 132.47 | 799 | 783 | 163.8 |
| B | 3 | 112 | 2743583 | 18586.47 | 749 | 727 | 147.6 |
| B | 5 | 172 | 449464 | 3040.78 | 749 | 727 | 147.6 |
| B | 5 | 32 | 69321 | 464.81 | 749 | 727 | 147.6 |
| C | 14 | 254 | 266316 | 1441.92 | 783 | 788 | 184.1 |
| C | 12 | 2 | 66128 | 354.82 | 783 | 788 | 184.1 |
| C | 14 | 96 | 36150 | 192.03 | 783 | 788 | 184.1 |
| D | 1 | 52 | 1415010 | 7311.27 | 766 | 744 | 193.4 |
| D | 13 | 249 | 580332 | 2996.27 | 766 | 744 | 193.4 |
| D | 5 | 171 | 98953 | 507.71 | 766 | 744 | 193.4 |
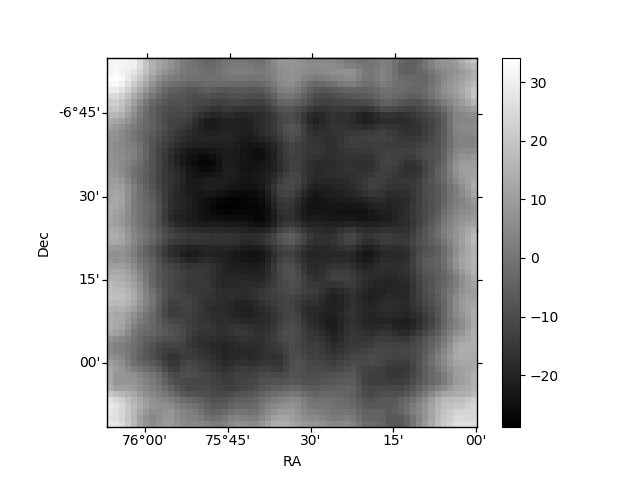
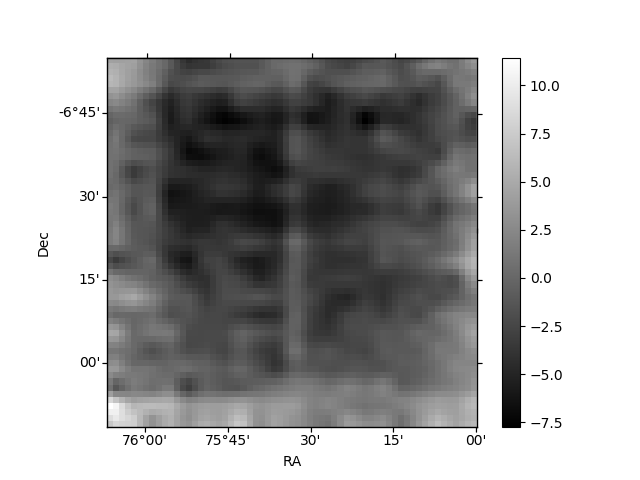
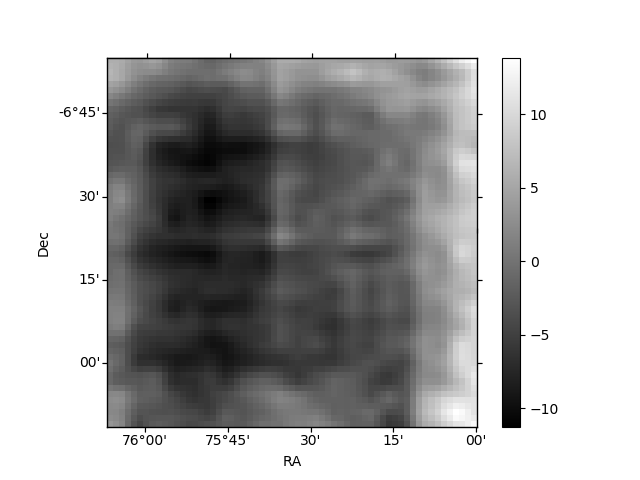
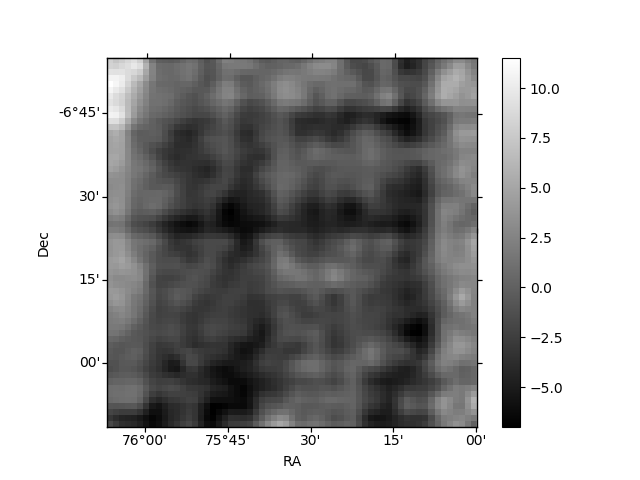
Histogram calculated using DETX and DETY for each event in the final _common_clean file
| Quadrant A | 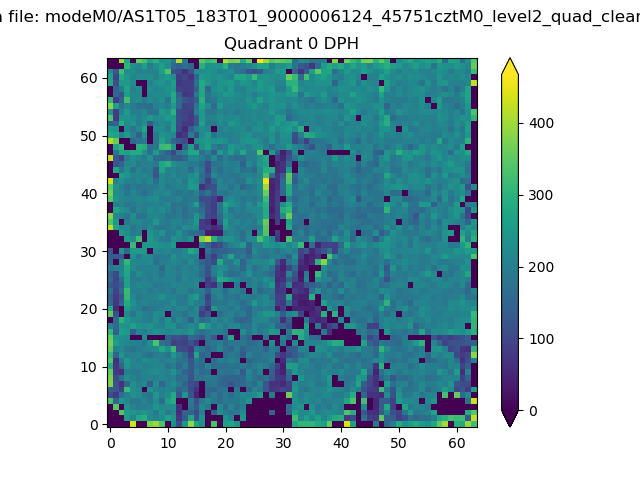 |
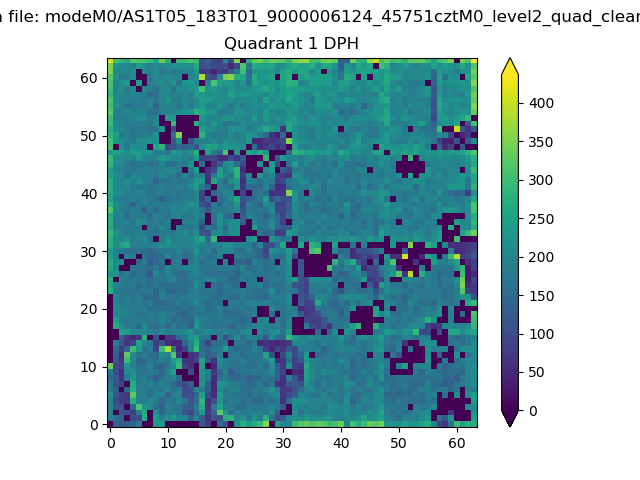 |
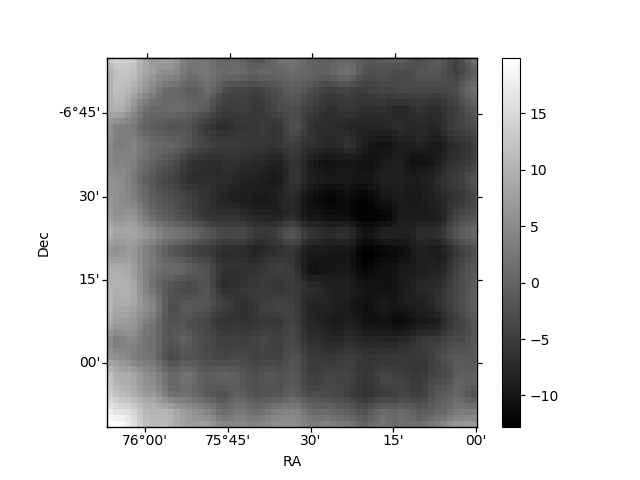
Quadrant B |
|---|---|---|---|
| Quadrant D | 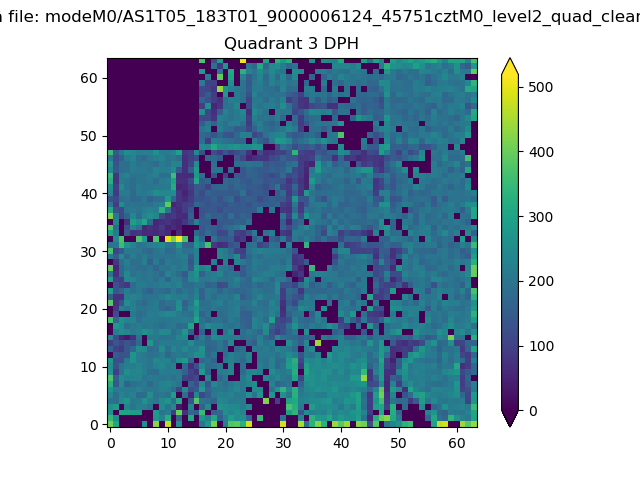 |
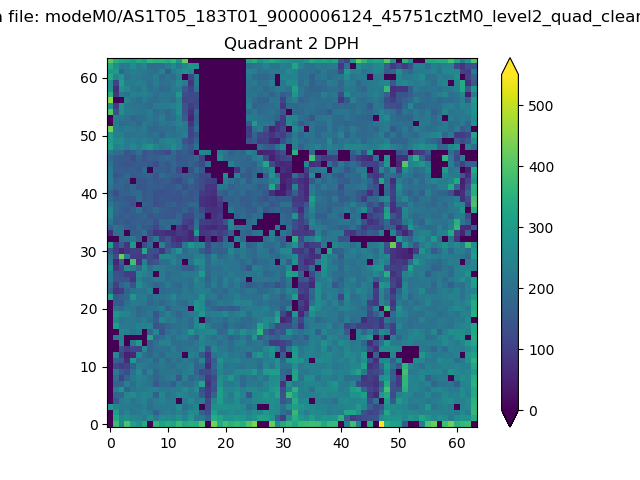 |
Quadrant C |
| Plot type | Count rate plots | Images |
|---|---|---|
| Comparison with Poisson distribution Blue bars denote a histogram of data divided into 1 sec bins. Red curve is a Poisson curve with rate = median count rate of data. |
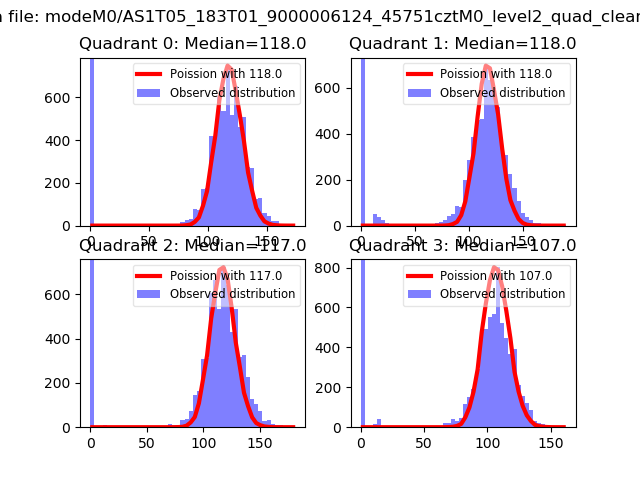 |
 |
| Quadrant-wise count rates Data is divided into 100 sec bins |
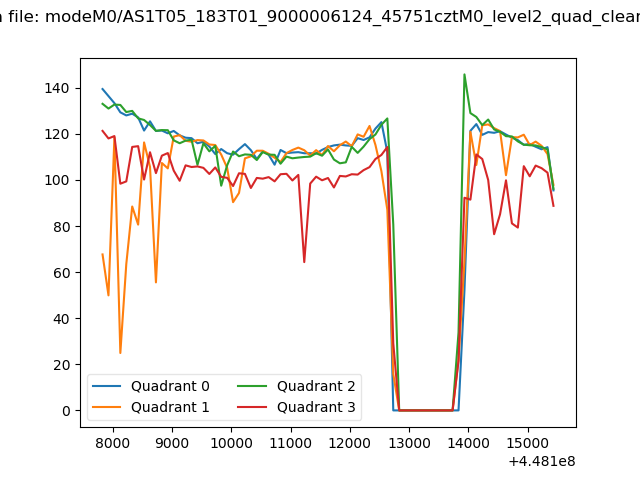 |
|
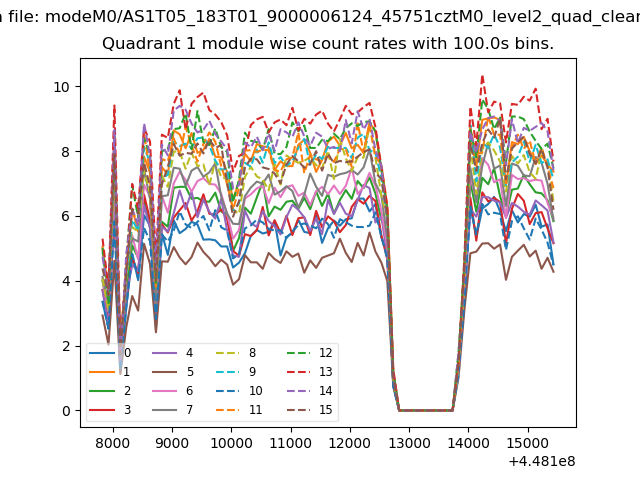
| Module-wise count rates for Quadrant A Data is divided into 100 sec bins |
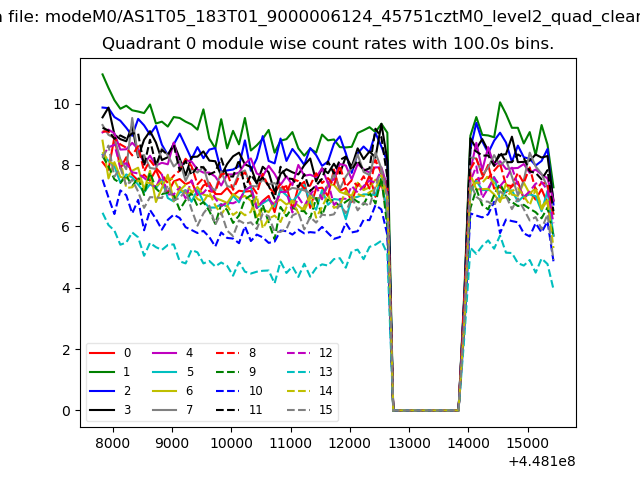 |
 |
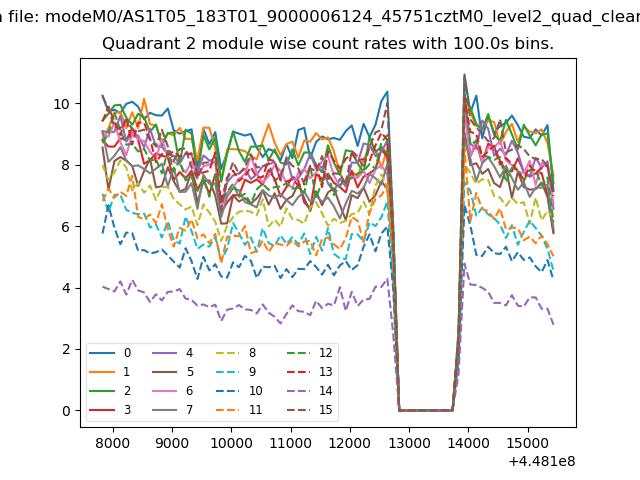
| Module-wise count rates for Quadrant B Data is divided into 100 sec bins |
 |
 |
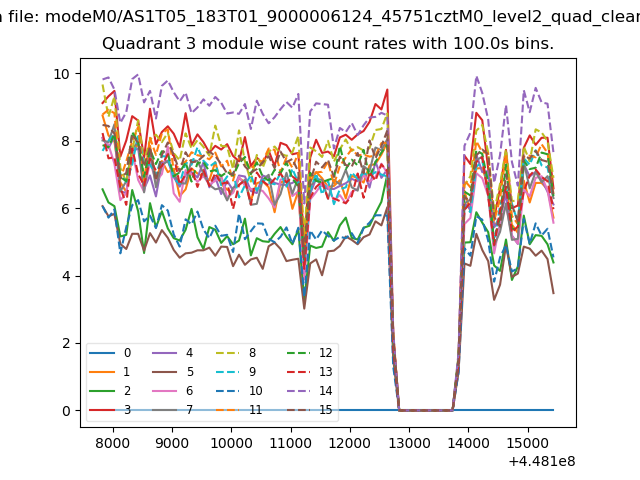
| Module-wise count rates for Quadrant C Data is divided into 100 sec bins |
 |
 |
| Module-wise count rates for Quadrant D Data is divided into 100 sec bins |
 |
 |
| Parameter | Plot |
|---|---|
| CZT HV Monitor | 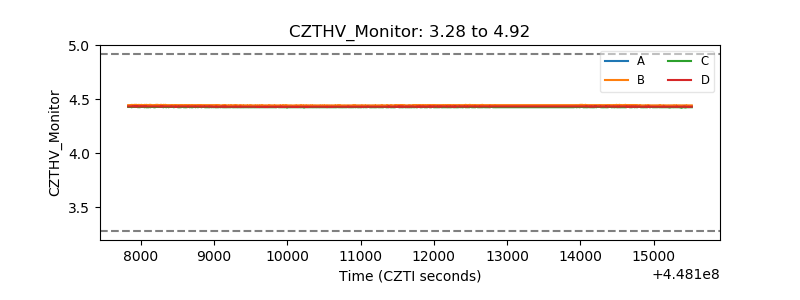 |
| D_VDD | 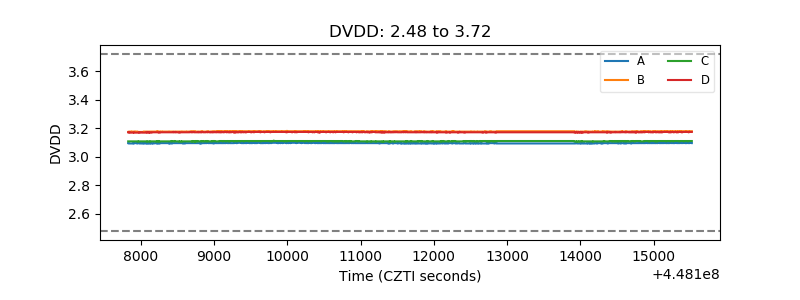 |
| Temperature 1 | 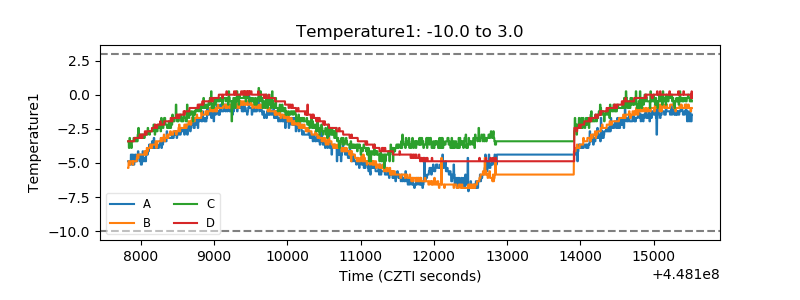 |
| Veto HV Monitor | 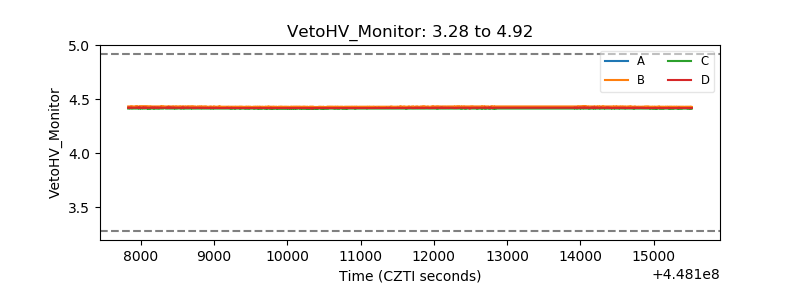 |
| Veto LLD | 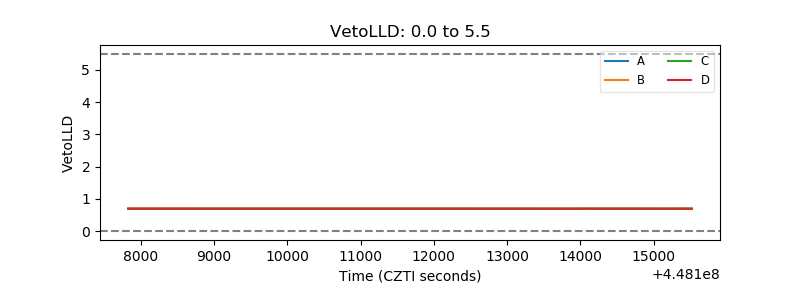 |
| Alpha Counter | 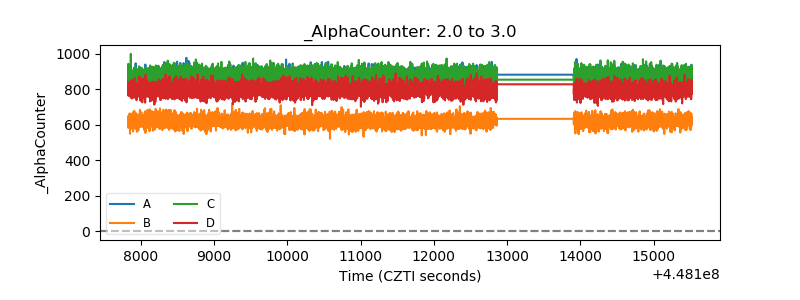 |
| _CPM_Rate | 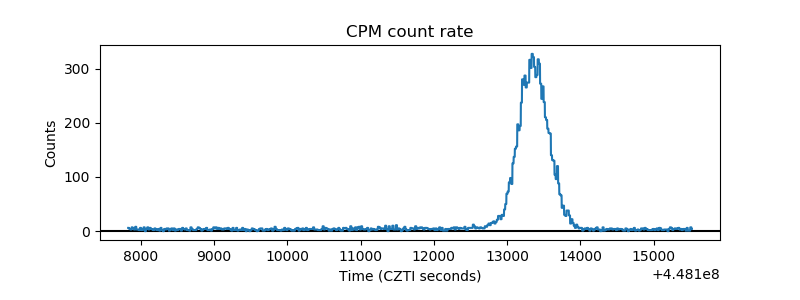 |
| CZT Counter | 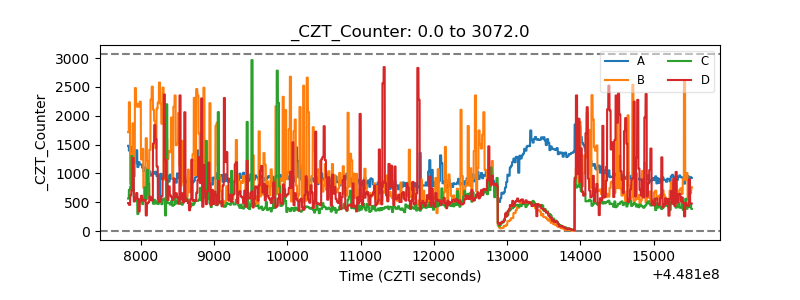 |
| +2.5 Volts monitor | 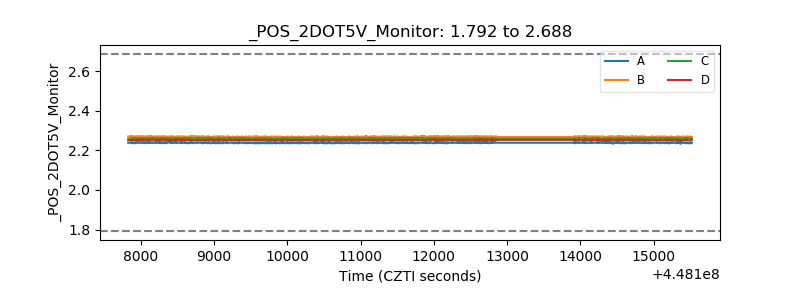 |
| +5 Volts monitor | 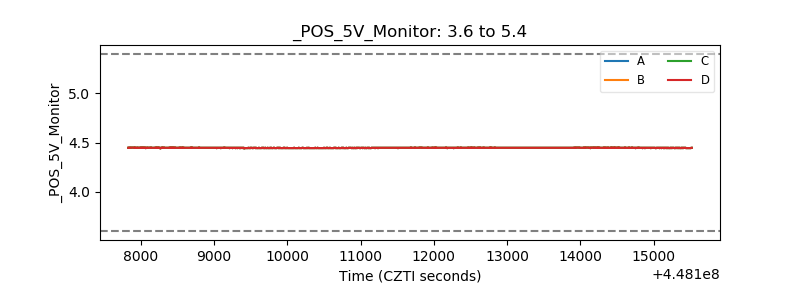 |
| _ROLL_ROT | 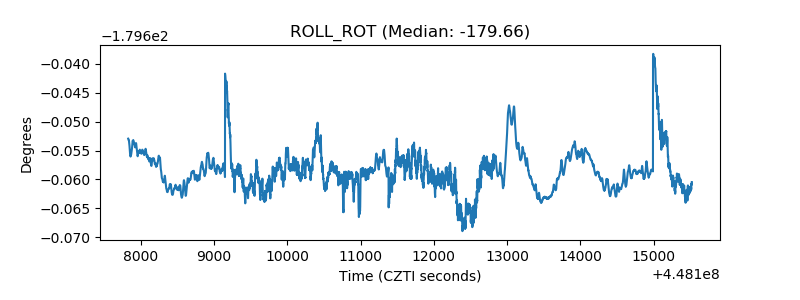 |
| _Roll_DEC | 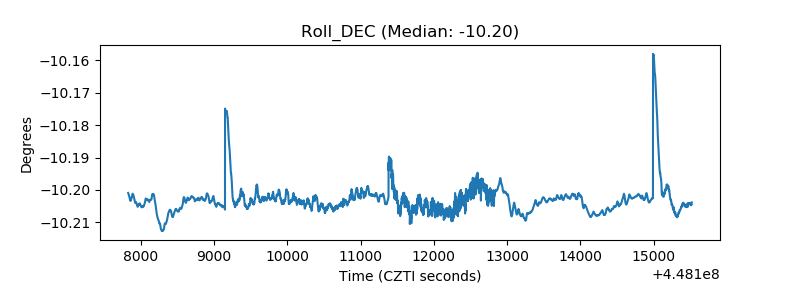 |
| _Roll_RA | 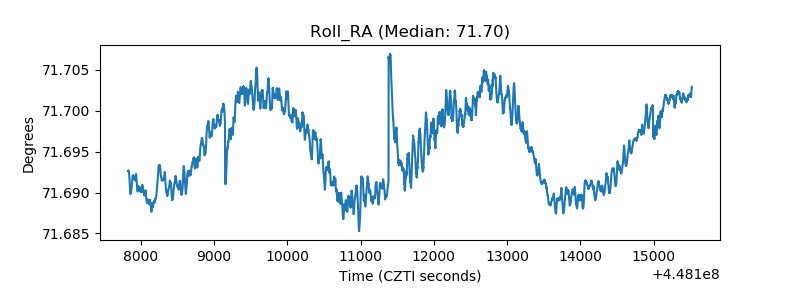 |
| Veto Counter | 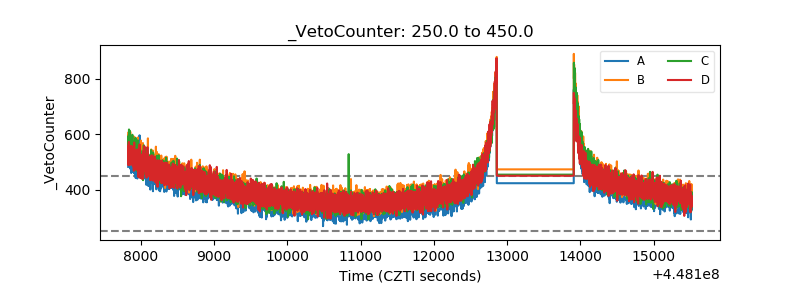 |