| Param | Original file | Final file |
|---|---|---|
| Filename | modeM0/AS1T05_183T01_9000006124_45752cztM0_level2.fits | modeM0/AS1T05_183T01_9000006124_45752cztM0_level2_quad_clean.evt |
| Size (bytes) | 568,465,920 | 109,126,080 |
| Size | 542.1 MB | 104.1 MB |
| Events in quadrant A | 6,170,322 | 734,580 |
| Events in quadrant B | 5,552,226 | 705,835 |
| Events in quadrant C | 3,473,044 | 747,405 |
| Events in quadrant D | 5,326,643 | 648,132 |
| Mode SS | |||
|---|---|---|---|
| Quadrant | BADHDUFLAG | Total packets | Discarded packets |
| A | 0 | 136 | 0 |
| B | 0 | 136 | 0 |
| C | 0 | 136 | 0 |
| D | 0 | 136 | 0 |
| Mode M0 | |||
|---|---|---|---|
| Quadrant | BADHDUFLAG | Total packets | Discarded packets |
| A | 0 | 22596 | 2 |
| B | 0 | 21114 | 1 |
| C | 0 | 15115 | 1 |
| D | 0 | 20325 | 1 |
| Mode M9 | |||
|---|---|---|---|
| Quadrant | BADHDUFLAG | Total packets | Discarded packets |
| A | 0 | 8 | 0 |
| B | 0 | 8 | 0 |
| C | 0 | 8 | 0 |
| D | 0 | 8 | 0 |
| Quadrant | Total seconds | Saturated seconds | Saturation percentage |
|---|---|---|---|
| A | 6715 | 240 | 3.574088% |
| B | 6716 | 683 | 10.169744% |
| C | 6716 | 124 | 1.846337% |
| D | 6716 | 560 | 8.338297% |
Noise dominated data is calculated using 1-second bins in cleaned event files. If a bin has >2000 counts, and if more than 50% of those come from <1% of pixels, then it is considered to be noise-dominated and hence unusable.
| Quadrant | # 1 sec bins | Bins with >0 counts | Bins with >2000 counts | High rate bins dominated by noise | Noise dominated (total time) | Noise dominated (detector-on time) | Marked lightcurve |
|---|---|---|---|---|---|---|---|
| A | 7535 | 6716 | 1 | 1 | 0.01% | 0.01% | 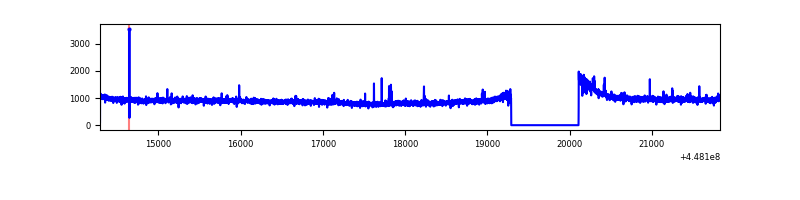 |
| B | 7536 | 6717 | 302 | 302 | 4.01% | 4.50% | 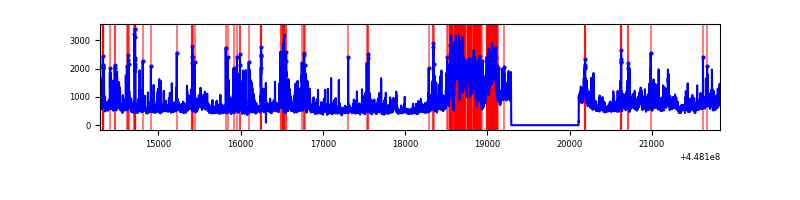 |
| C | 7536 | 6717 | 66 | 66 | 0.88% | 0.98% | 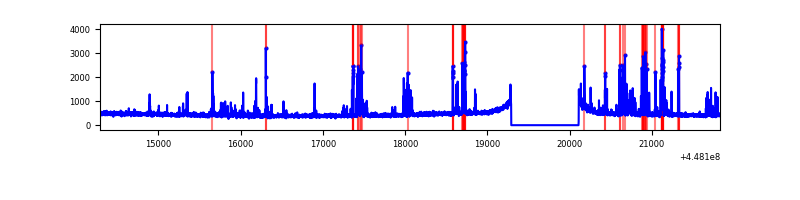 |
| D | 7536 | 6717 | 399 | 399 | 5.29% | 5.94% | 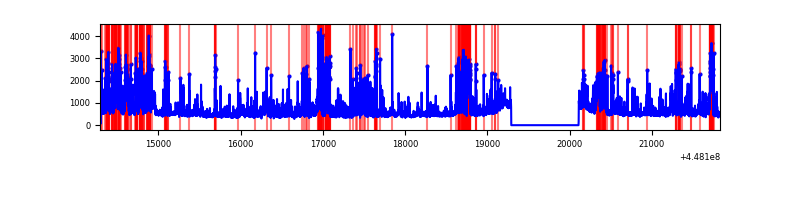 |
Top three noisy pixels from each quadrant. If the there are fewer than three noisy pixels in the level2.evt file, extra rows are filled as -1
| Pixel properties | Quadrant properties | ||||||
|---|---|---|---|---|---|---|---|
| Quadrant | DetID | PixID | Counts | Sigma | Mean | Median | Sigma |
| A | 10 | 83 | 3042633 | 18801.85 | 780 | 765 | 161.8 |
| A | 14 | 235 | 21312 | 127.0 | 780 | 765 | 161.8 |
| A | 0 | 243 | 17399 | 102.82 | 780 | 765 | 161.8 |
| B | 3 | 112 | 2012646 | 13496.09 | 752 | 729 | 149.1 |
| B | 12 | 3 | 114230 | 761.37 | 752 | 729 | 149.1 |
| B | 5 | 172 | 100203 | 667.28 | 752 | 729 | 149.1 |
| C | 14 | 254 | 426194 | 2368.25 | 764 | 768 | 179.6 |
| C | 1 | 3 | 45712 | 250.19 | 764 | 768 | 179.6 |
| C | 0 | 207 | 11797 | 61.4 | 764 | 768 | 179.6 |
| D | 1 | 52 | 1090565 | 5683.7 | 750 | 727 | 191.7 |
| D | 13 | 249 | 511761 | 2665.14 | 750 | 727 | 191.7 |
| D | 1 | 47 | 337215 | 1754.85 | 750 | 727 | 191.7 |
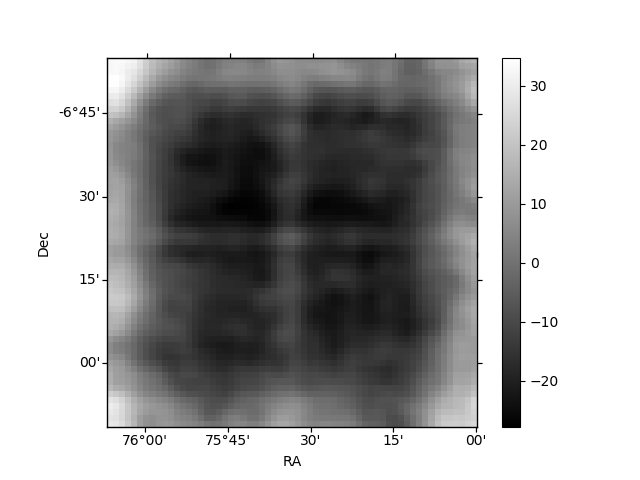
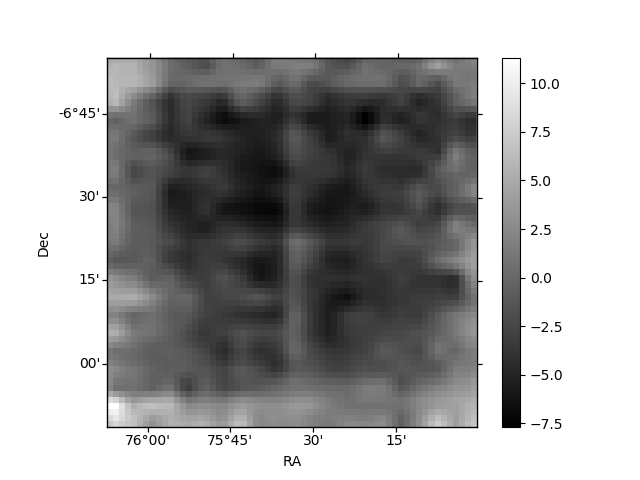
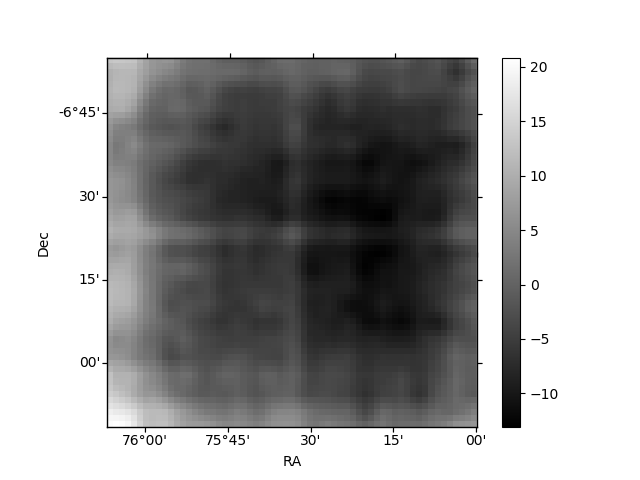
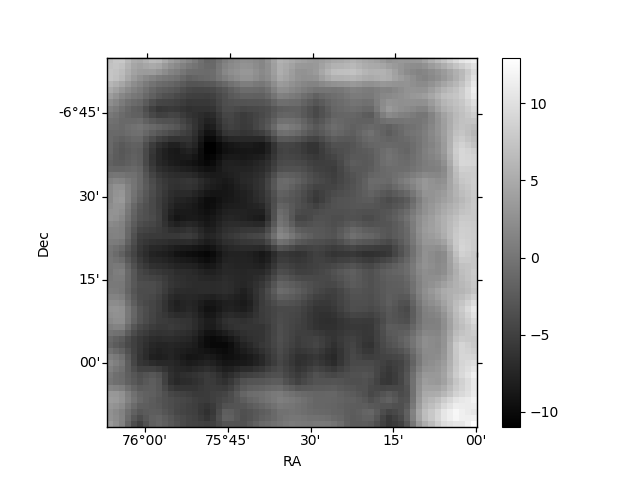
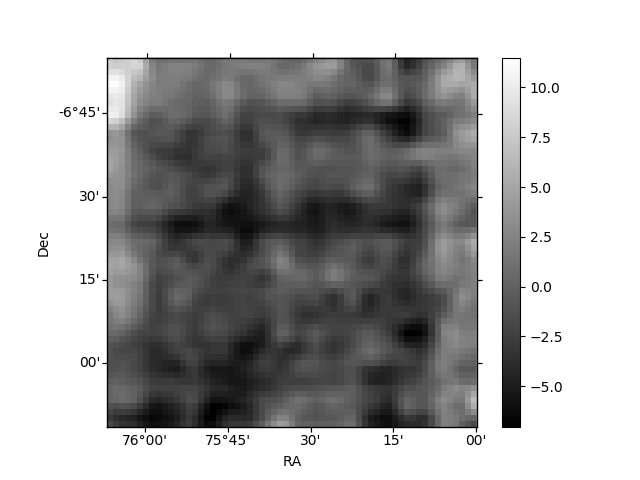
Histogram calculated using DETX and DETY for each event in the final _common_clean file
| Quadrant A | 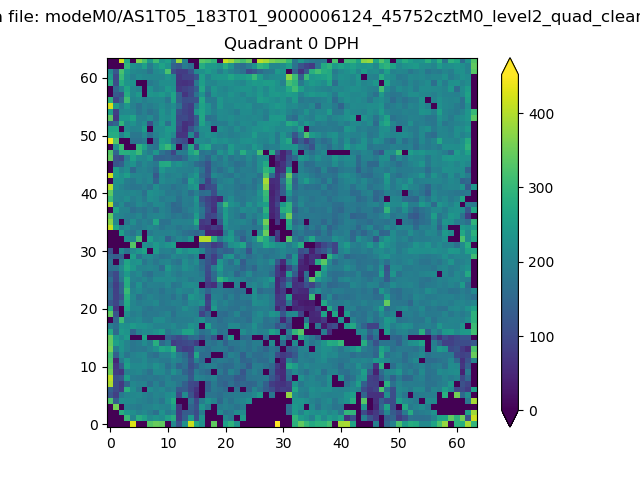 |
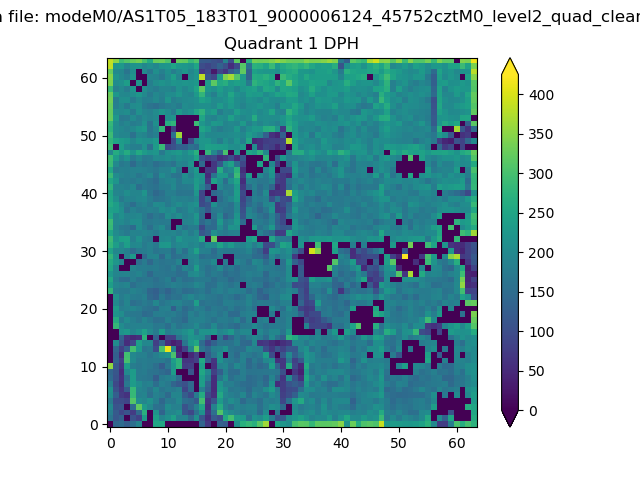 |
Quadrant B |
|---|---|---|---|
| Quadrant D | 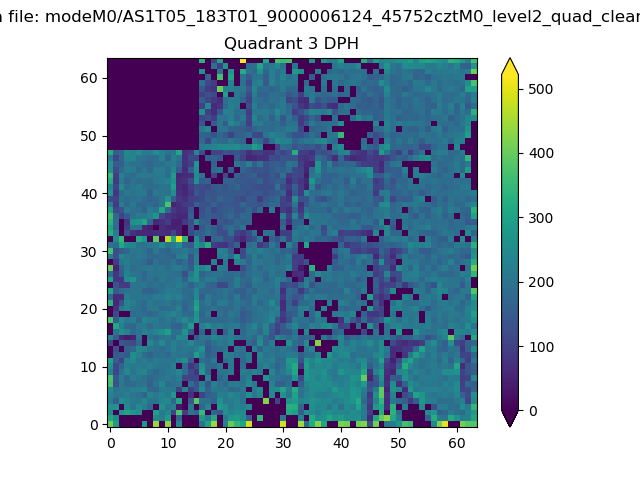 |
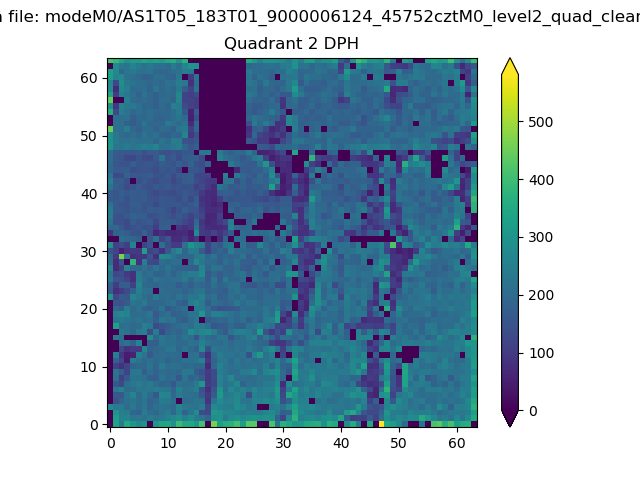 |
Quadrant C |
| Plot type | Count rate plots | Images |
|---|---|---|
| Comparison with Poisson distribution Blue bars denote a histogram of data divided into 1 sec bins. Red curve is a Poisson curve with rate = median count rate of data. |
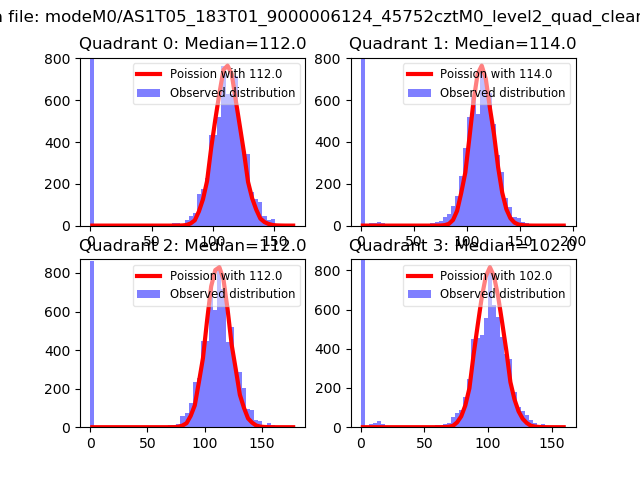 |
 |
| Quadrant-wise count rates Data is divided into 100 sec bins |
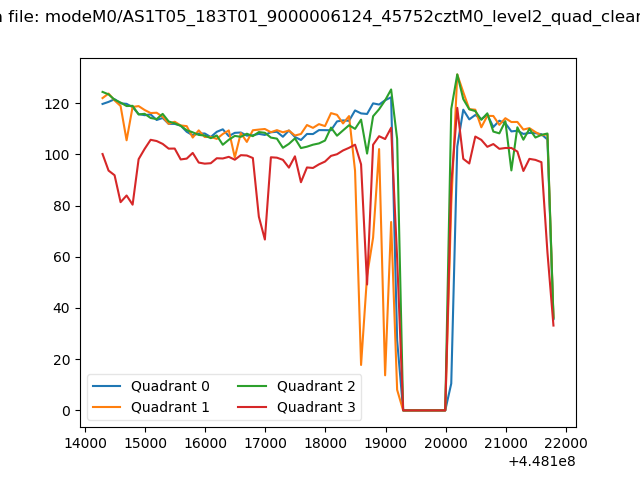 |
|
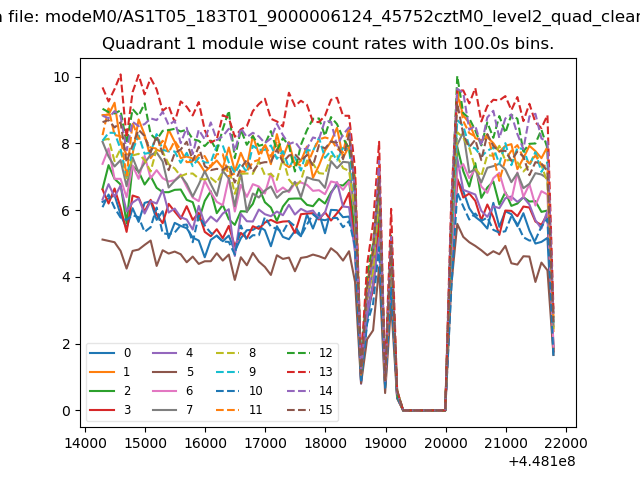
| Module-wise count rates for Quadrant A Data is divided into 100 sec bins |
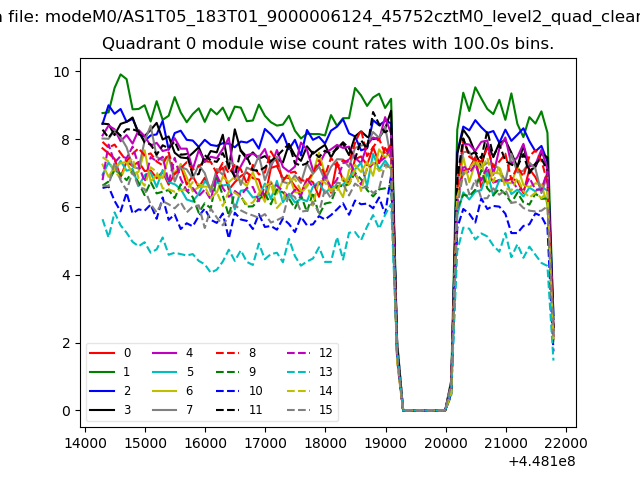 |
 |
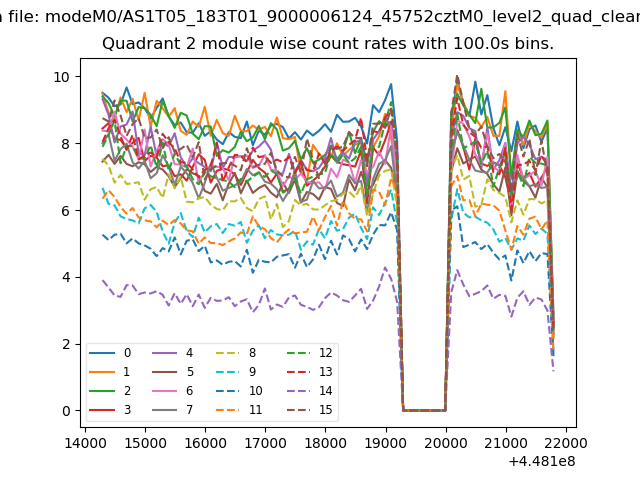
| Module-wise count rates for Quadrant B Data is divided into 100 sec bins |
 |
 |
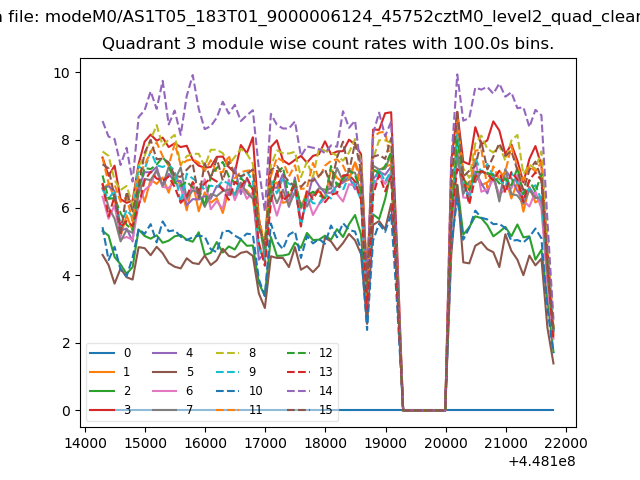
| Module-wise count rates for Quadrant C Data is divided into 100 sec bins |
 |
 |
| Module-wise count rates for Quadrant D Data is divided into 100 sec bins |
 |
 |
| Parameter | Plot |
|---|---|
| CZT HV Monitor | 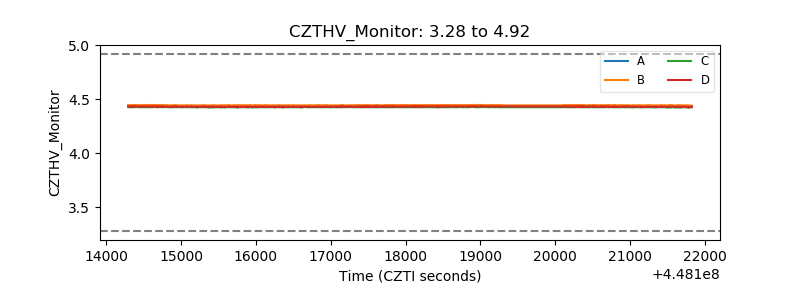 |
| D_VDD | 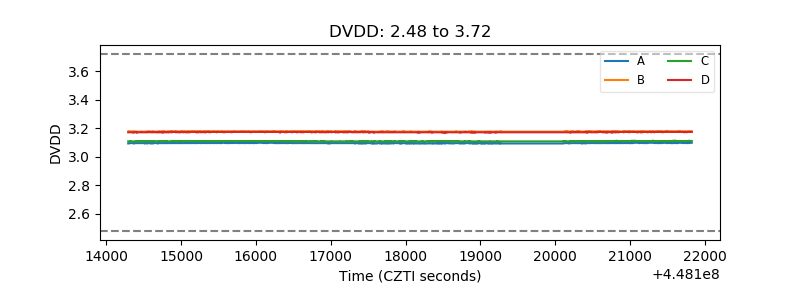 |
| Temperature 1 | 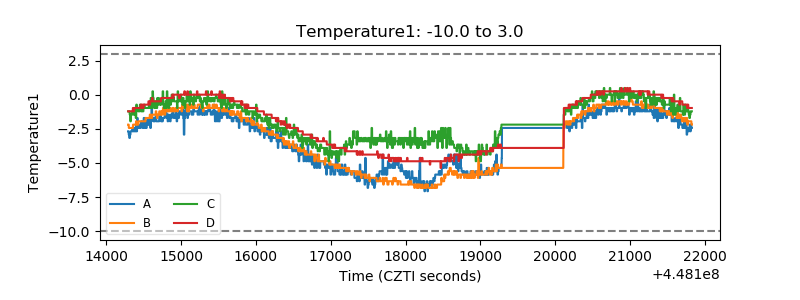 |
| Veto HV Monitor | 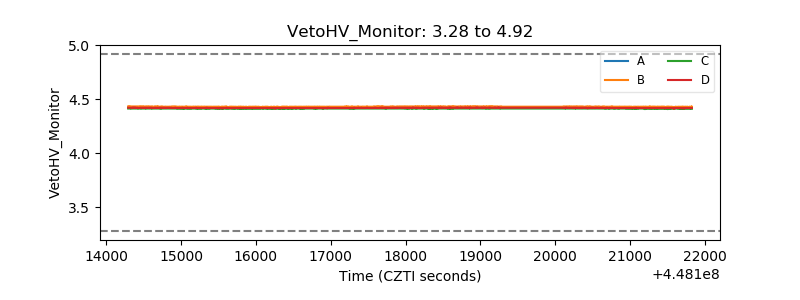 |
| Veto LLD | 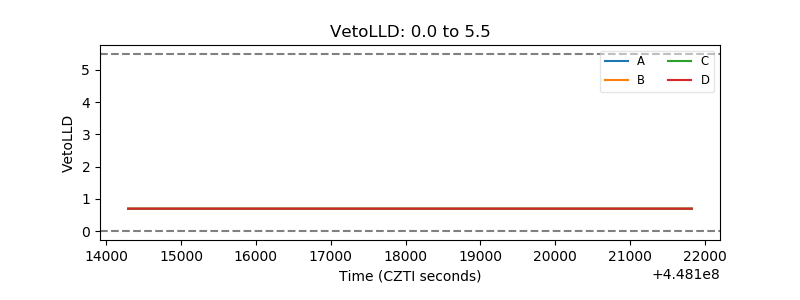 |
| Alpha Counter | 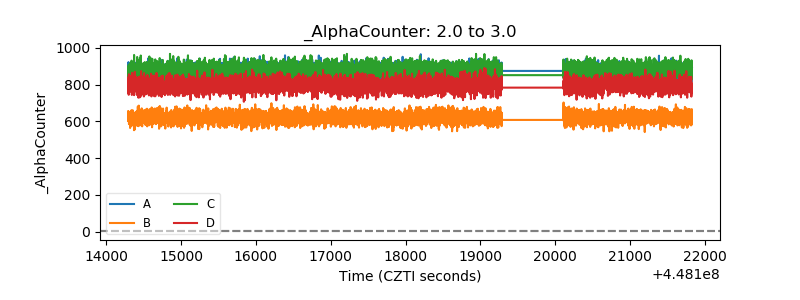 |
| _CPM_Rate | 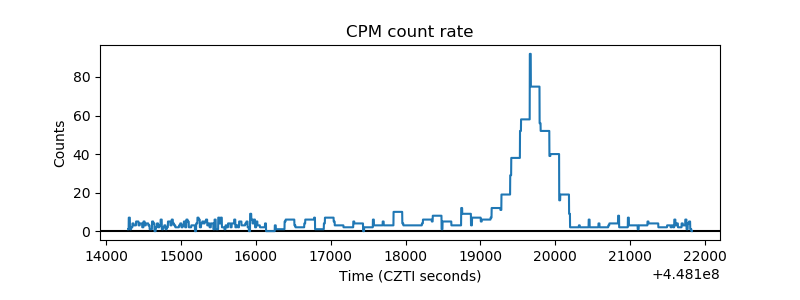 |
| CZT Counter | 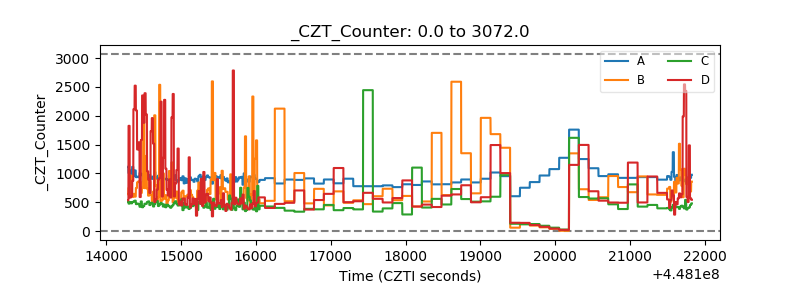 |
| +2.5 Volts monitor | 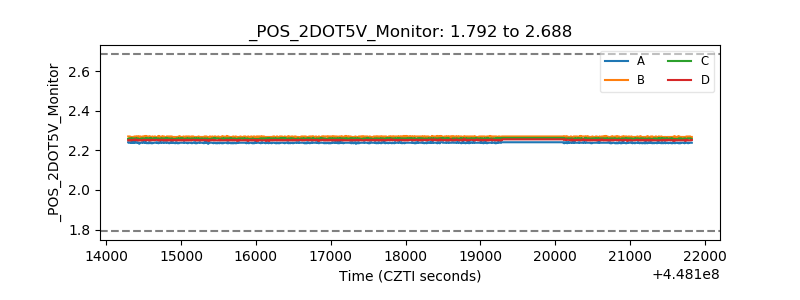 |
| +5 Volts monitor | 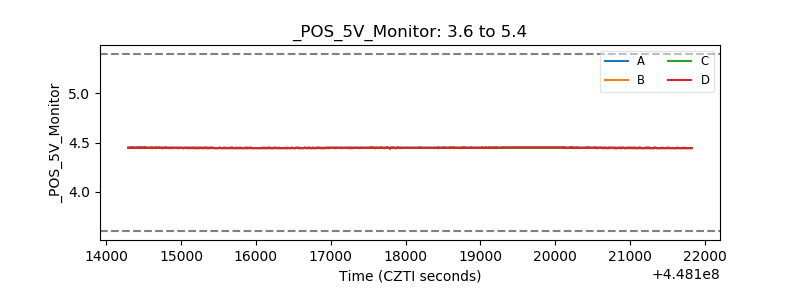 |
| _ROLL_ROT | 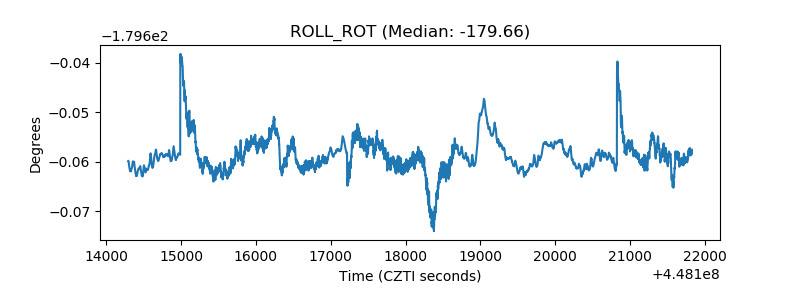 |
| _Roll_DEC | 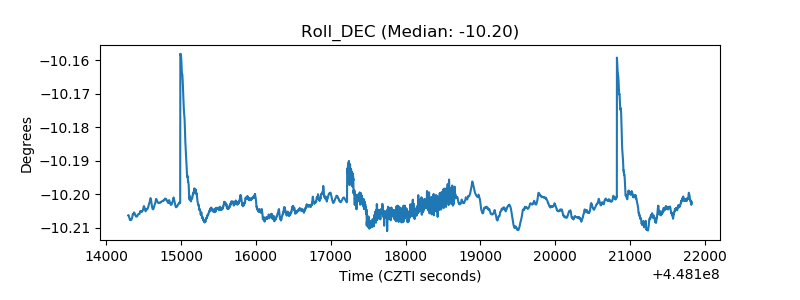 |
| _Roll_RA | 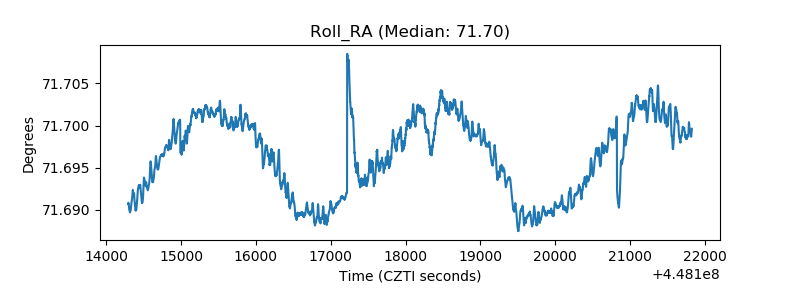 |
| Veto Counter | 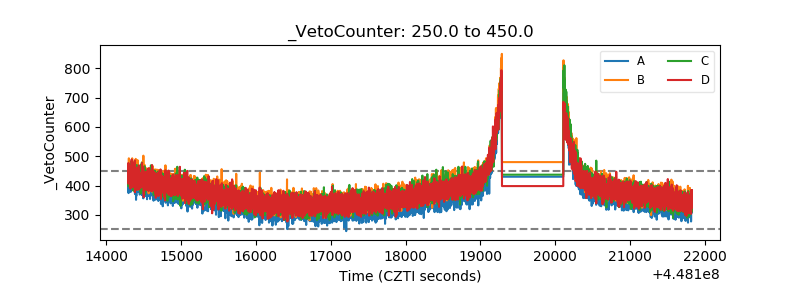 |