| Param | Original file | Final file |
|---|---|---|
| Filename | modeM0/AS1T05_183T01_9000006124_45753cztM0_level2.fits | modeM0/AS1T05_183T01_9000006124_45753cztM0_level2_quad_clean.evt |
| Size (bytes) | 654,413,760 | 107,890,560 |
| Size | 624.1 MB | 102.9 MB |
| Events in quadrant A | 6,435,671 | 739,164 |
| Events in quadrant B | 8,467,069 | 630,921 |
| Events in quadrant C | 3,609,958 | 751,910 |
| Events in quadrant D | 5,174,243 | 660,480 |
| Mode SS | |||
|---|---|---|---|
| Quadrant | BADHDUFLAG | Total packets | Discarded packets |
| A | 0 | 142 | 0 |
| B | 0 | 142 | 0 |
| C | 0 | 142 | 0 |
| D | 0 | 142 | 0 |
| Mode M0 | |||
|---|---|---|---|
| Quadrant | BADHDUFLAG | Total packets | Discarded packets |
| A | 0 | 23869 | 1 |
| B | 0 | 30103 | 1 |
| C | 0 | 15749 | 1 |
| D | 0 | 20049 | 1 |
| Mode M9 | |||
|---|---|---|---|
| Quadrant | BADHDUFLAG | Total packets | Discarded packets |
| A | 0 | 3 | 0 |
| B | 0 | 3 | 0 |
| C | 0 | 3 | 0 |
| D | 0 | 3 | 0 |
| Quadrant | Total seconds | Saturated seconds | Saturation percentage |
|---|---|---|---|
| A | 6943 | 247 | 3.557540% |
| B | 6943 | 1553 | 22.367853% |
| C | 6944 | 135 | 1.944124% |
| D | 6944 | 426 | 6.134793% |
Noise dominated data is calculated using 1-second bins in cleaned event files. If a bin has >2000 counts, and if more than 50% of those come from <1% of pixels, then it is considered to be noise-dominated and hence unusable.
| Quadrant | # 1 sec bins | Bins with >0 counts | Bins with >2000 counts | High rate bins dominated by noise | Noise dominated (total time) | Noise dominated (detector-on time) | Marked lightcurve |
|---|---|---|---|---|---|---|---|
| A | 7263 | 6944 | 11 | 11 | 0.15% | 0.16% | 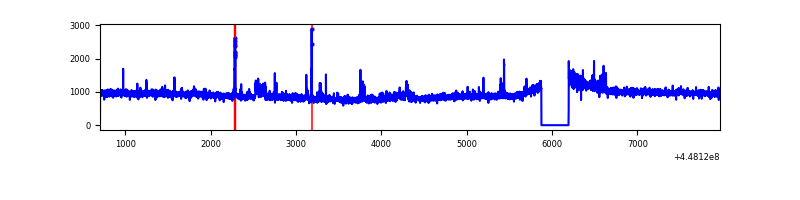 |
| B | 7263 | 6944 | 887 | 887 | 12.21% | 12.77% | 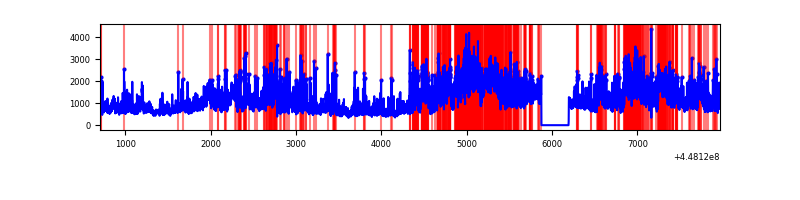 |
| C | 7264 | 6945 | 88 | 88 | 1.21% | 1.27% | 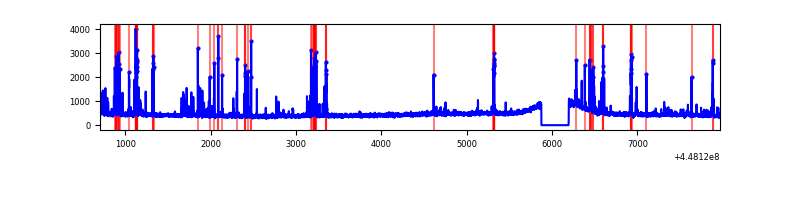 |
| D | 7264 | 6945 | 237 | 237 | 3.26% | 3.41% | 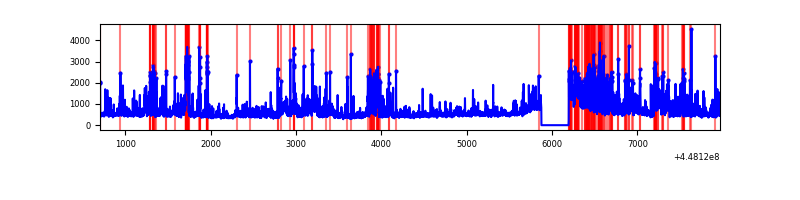 |
Top three noisy pixels from each quadrant. If the there are fewer than three noisy pixels in the level2.evt file, extra rows are filled as -1
| Pixel properties | Quadrant properties | ||||||
|---|---|---|---|---|---|---|---|
| Quadrant | DetID | PixID | Counts | Sigma | Mean | Median | Sigma |
| A | 10 | 83 | 3122988 | 18488.6 | 802 | 784 | 168.9 |
| A | 14 | 235 | 80021 | 469.21 | 802 | 784 | 168.9 |
| A | 13 | 248 | 62853 | 367.55 | 802 | 784 | 168.9 |
| B | 3 | 112 | 4988641 | 34247.65 | 740 | 718 | 145.6 |
| B | 5 | 172 | 204757 | 1400.95 | 740 | 718 | 145.6 |
| B | 0 | 190 | 111371 | 759.76 | 740 | 718 | 145.6 |
| C | 14 | 254 | 480284 | 2557.69 | 787 | 792 | 187.5 |
| C | 12 | 2 | 25096 | 129.64 | 787 | 792 | 187.5 |
| C | 3 | 233 | 11865 | 59.07 | 787 | 792 | 187.5 |
| D | 1 | 52 | 1207485 | 6168.66 | 772 | 748 | 195.6 |
| D | 1 | 47 | 474548 | 2422.0 | 772 | 748 | 195.6 |
| D | 5 | 171 | 139574 | 709.66 | 772 | 748 | 195.6 |
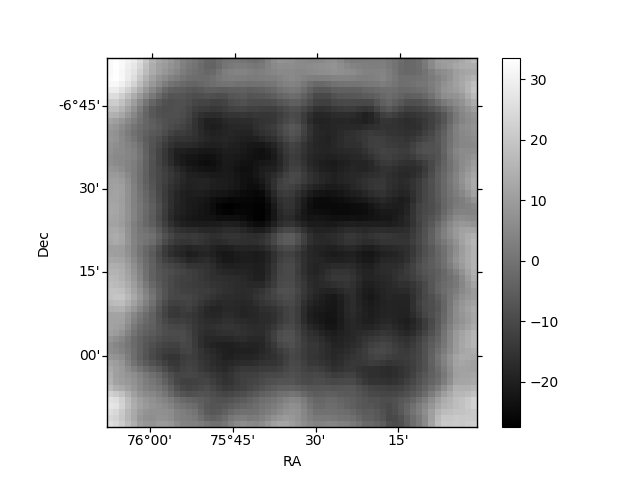
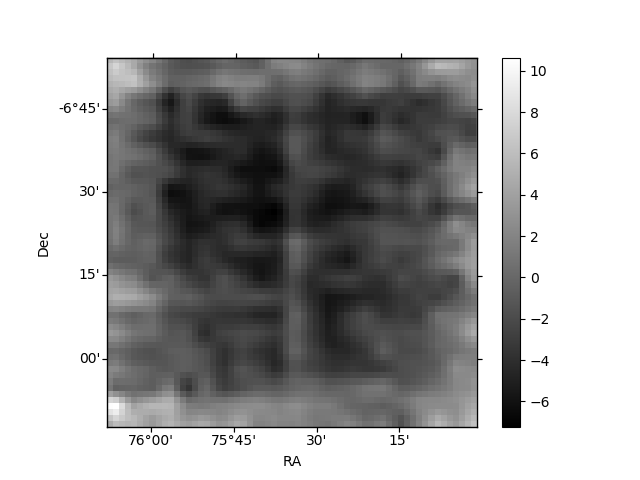
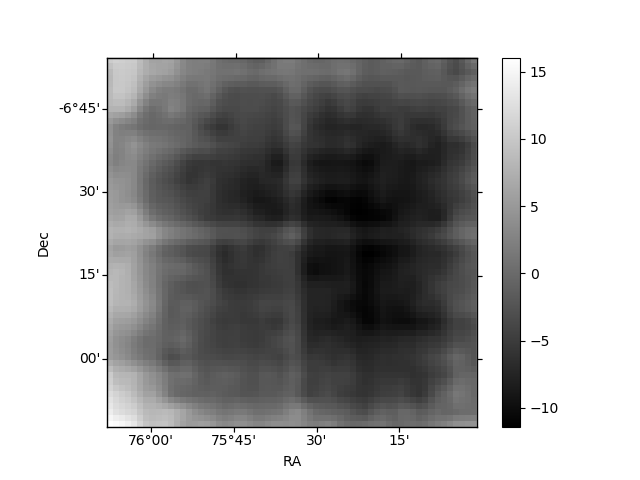
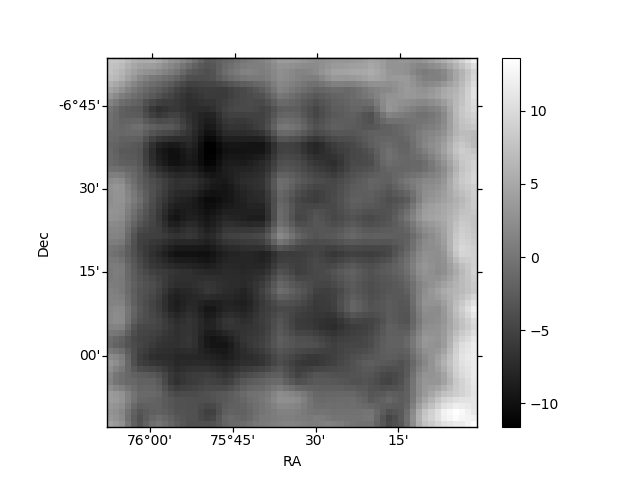
Histogram calculated using DETX and DETY for each event in the final _common_clean file
| Quadrant A | 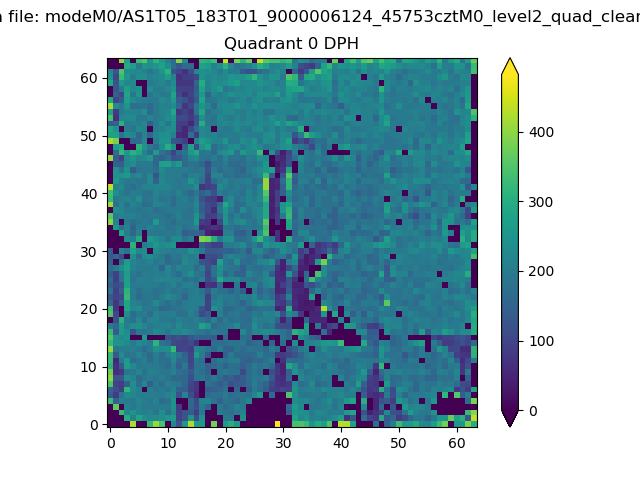 |
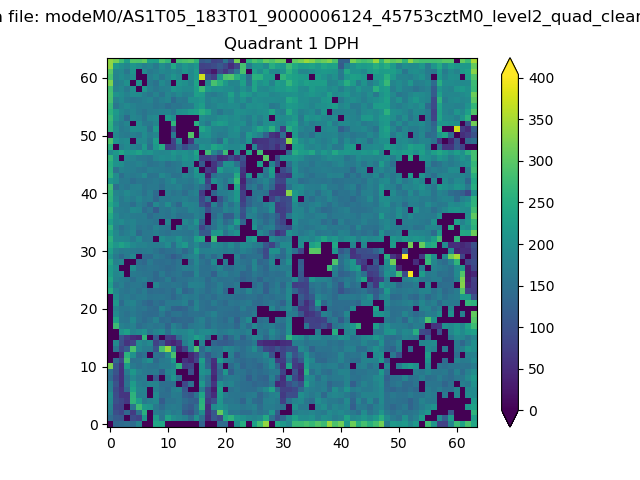 |
Quadrant B |
|---|---|---|---|
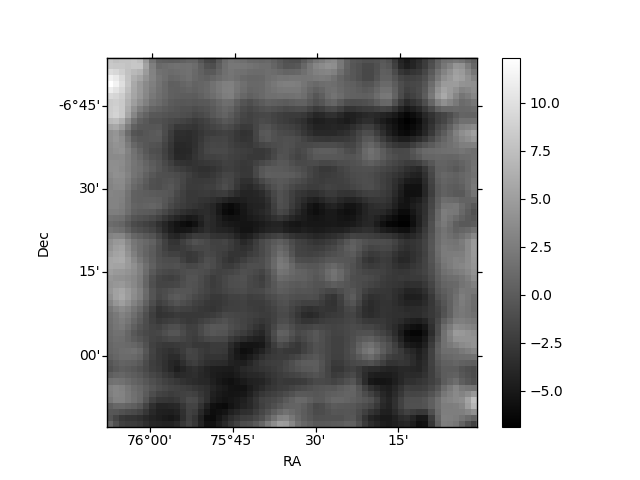
| Quadrant D | 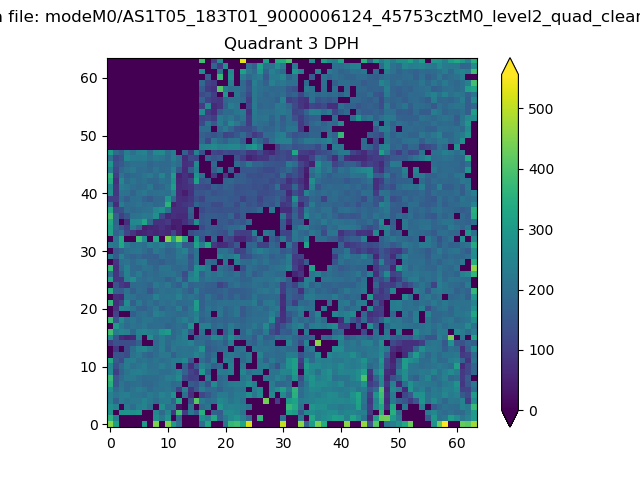 |
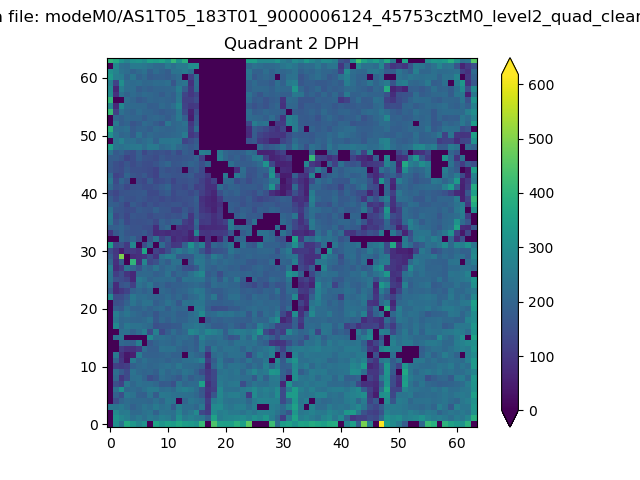 |
Quadrant C |
| Plot type | Count rate plots | Images |
|---|---|---|
| Comparison with Poisson distribution Blue bars denote a histogram of data divided into 1 sec bins. Red curve is a Poisson curve with rate = median count rate of data. |
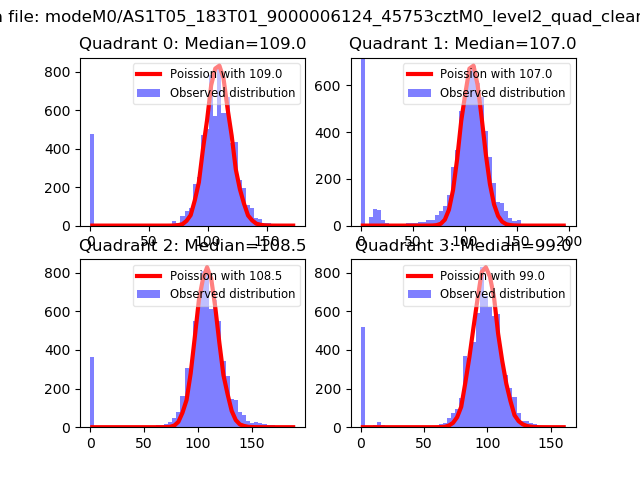 |
 |
| Quadrant-wise count rates Data is divided into 100 sec bins |
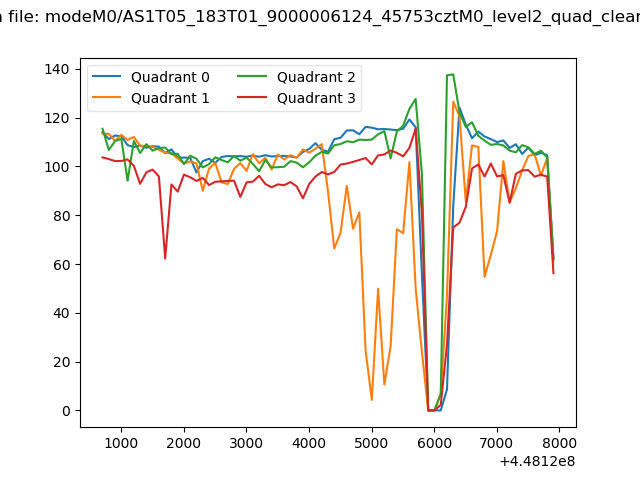 |
|
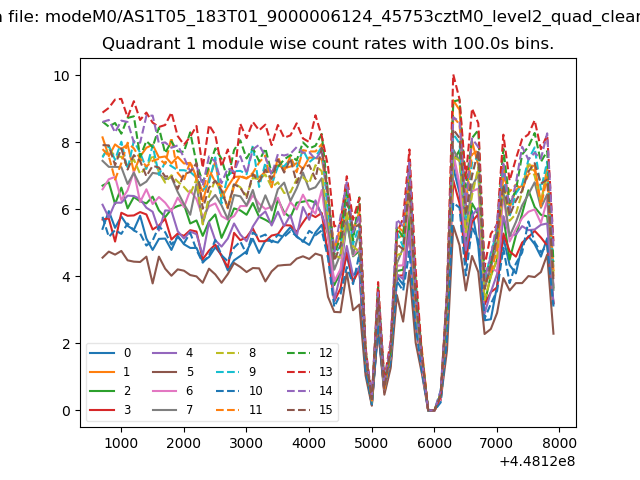
| Module-wise count rates for Quadrant A Data is divided into 100 sec bins |
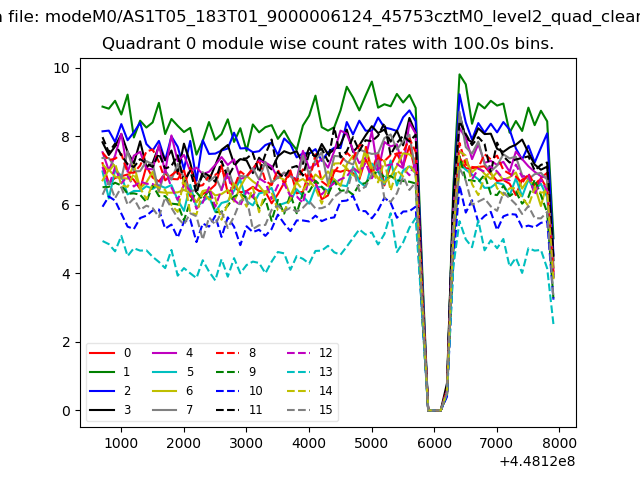 |
 |
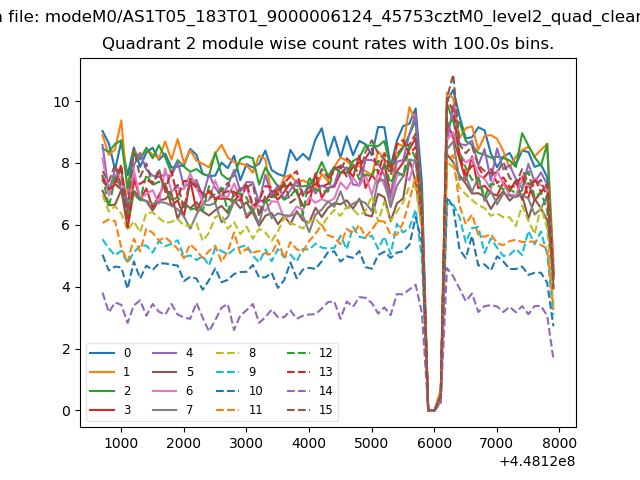
| Module-wise count rates for Quadrant B Data is divided into 100 sec bins |
 |
 |
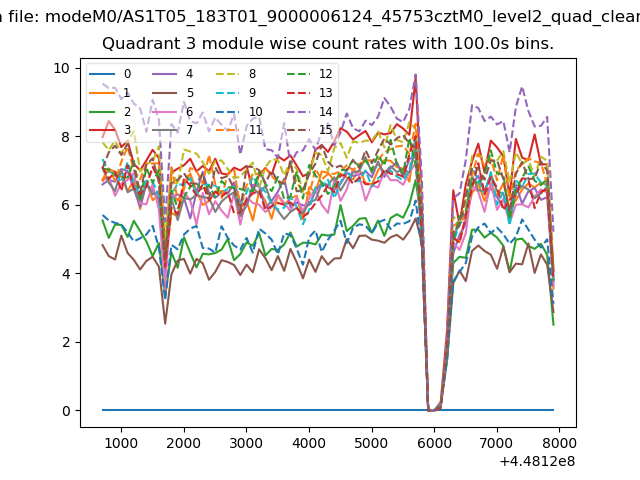
| Module-wise count rates for Quadrant C Data is divided into 100 sec bins |
 |
 |
| Module-wise count rates for Quadrant D Data is divided into 100 sec bins |
 |
 |
| Parameter | Plot |
|---|---|
| CZT HV Monitor | 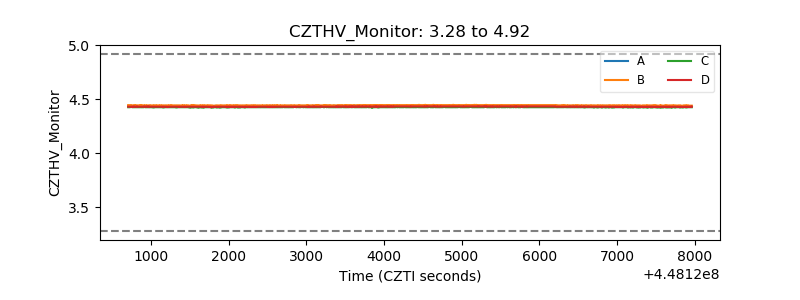 |
| D_VDD | 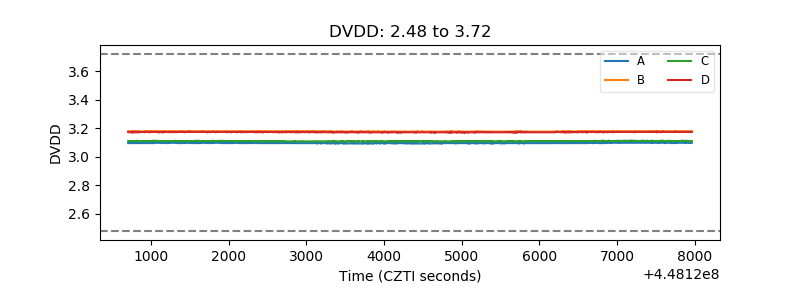 |
| Temperature 1 | 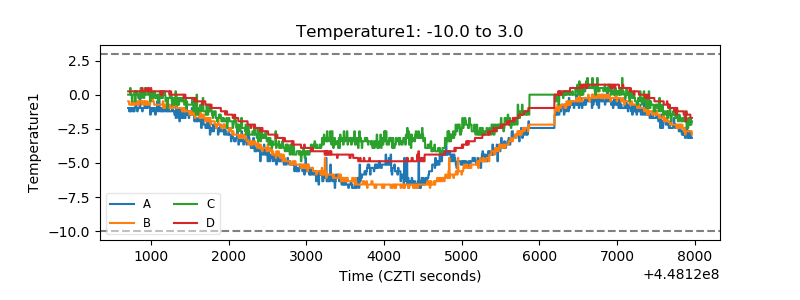 |
| Veto HV Monitor | 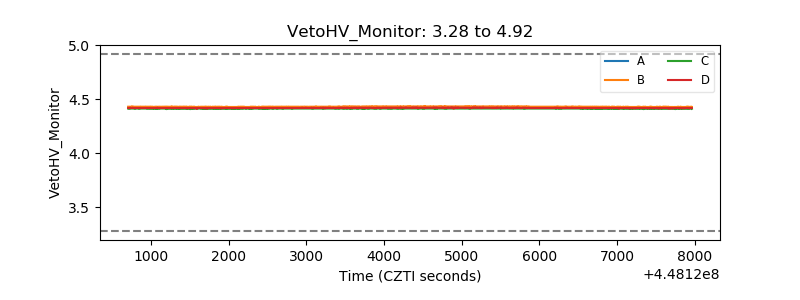 |
| Veto LLD | 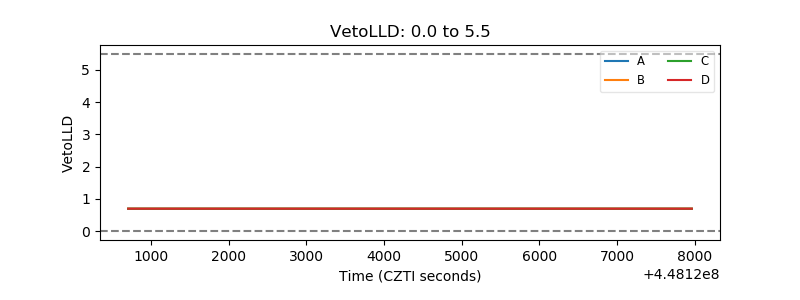 |
| Alpha Counter | 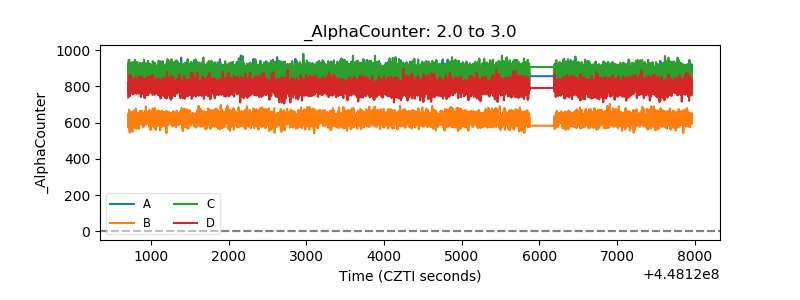 |
| _CPM_Rate | 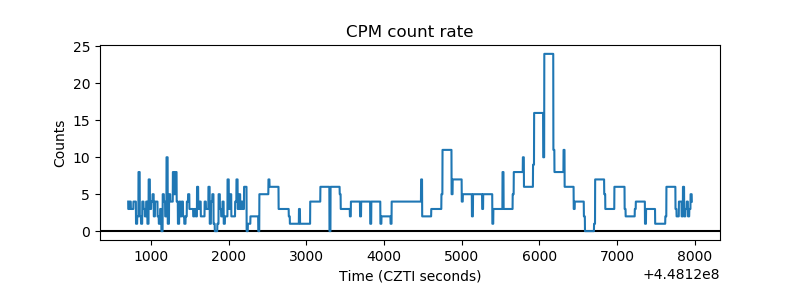 |
| CZT Counter | 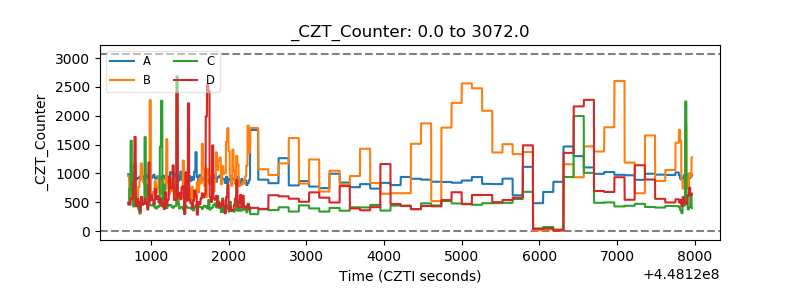 |
| +2.5 Volts monitor | 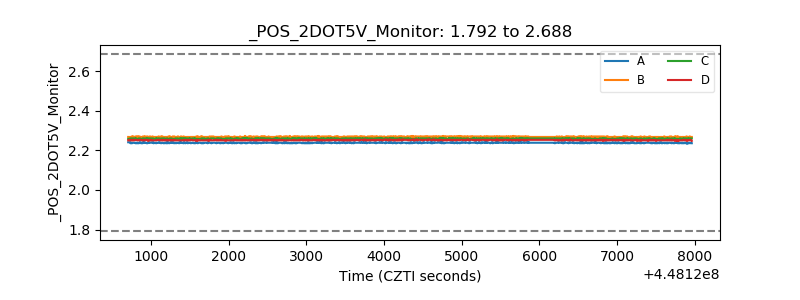 |
| +5 Volts monitor | 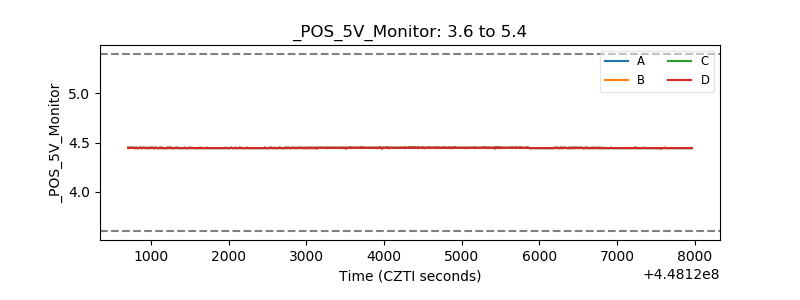 |
| _ROLL_ROT | 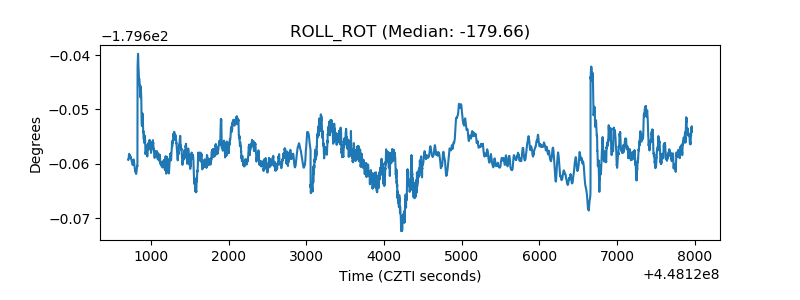 |
| _Roll_DEC | 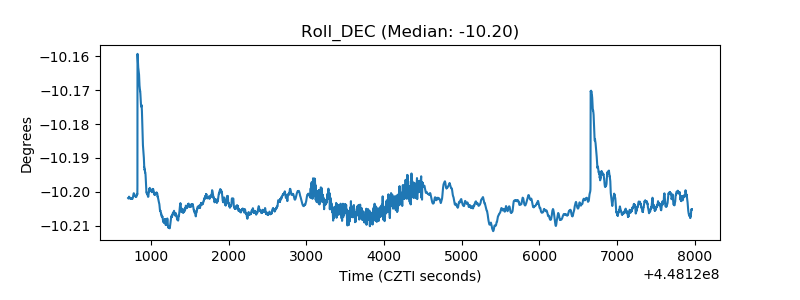 |
| _Roll_RA | 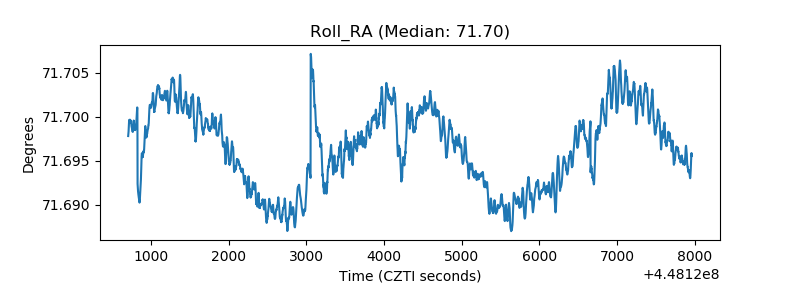 |
| Veto Counter | 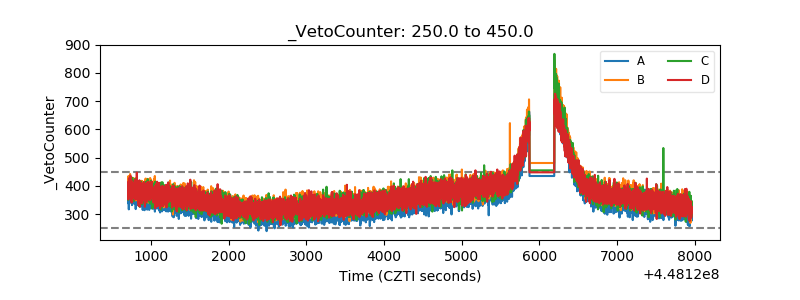 |