| Param | Original file | Final file |
|---|---|---|
| Filename | modeM0/AS1T05_183T01_9000006124_45755cztM0_level2.fits | modeM0/AS1T05_183T01_9000006124_45755cztM0_level2_quad_clean.evt |
| Size (bytes) | 753,670,080 | 118,304,640 |
| Size | 718.8 MB | 112.8 MB |
| Events in quadrant A | 7,050,745 | 821,591 |
| Events in quadrant B | 9,672,333 | 709,564 |
| Events in quadrant C | 4,432,466 | 799,337 |
| Events in quadrant D | 6,149,213 | 716,396 |
| Mode SS | |||
|---|---|---|---|
| Quadrant | BADHDUFLAG | Total packets | Discarded packets |
| A | 0 | 154 | 0 |
| B | 0 | 154 | 0 |
| C | 0 | 154 | 0 |
| D | 0 | 154 | 0 |
| Mode M0 | |||
|---|---|---|---|
| Quadrant | BADHDUFLAG | Total packets | Discarded packets |
| A | 0 | 26397 | 0 |
| B | 0 | 34210 | 0 |
| C | 0 | 18676 | 0 |
| D | 0 | 23610 | 0 |
| Quadrant | Total seconds | Saturated seconds | Saturation percentage |
|---|---|---|---|
| A | 7684 | 108 | 1.405518% |
| B | 7684 | 1636 | 21.290994% |
| C | 7683 | 283 | 3.683457% |
| D | 7683 | 506 | 6.585969% |
Noise dominated data is calculated using 1-second bins in cleaned event files. If a bin has >2000 counts, and if more than 50% of those come from <1% of pixels, then it is considered to be noise-dominated and hence unusable.
| Quadrant | # 1 sec bins | Bins with >0 counts | Bins with >2000 counts | High rate bins dominated by noise | Noise dominated (total time) | Noise dominated (detector-on time) | Marked lightcurve |
|---|---|---|---|---|---|---|---|
| A | 7684 | 7684 | 3 | 3 | 0.04% | 0.04% | 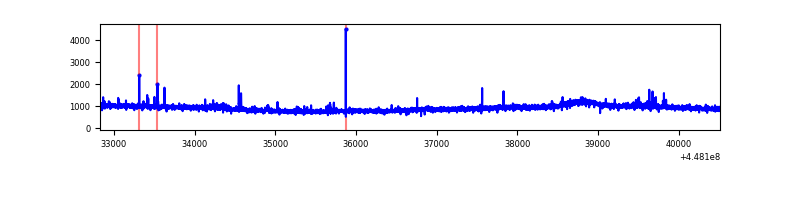 |
| B | 7684 | 7684 | 984 | 984 | 12.81% | 12.81% | 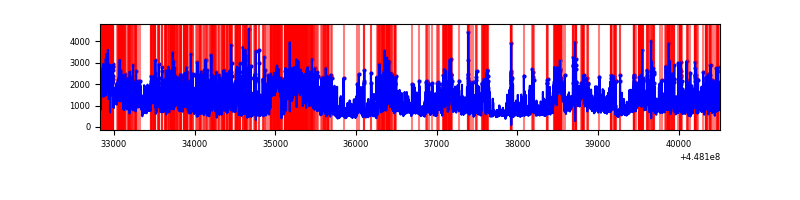 |
| C | 7683 | 7683 | 232 | 232 | 3.02% | 3.02% | 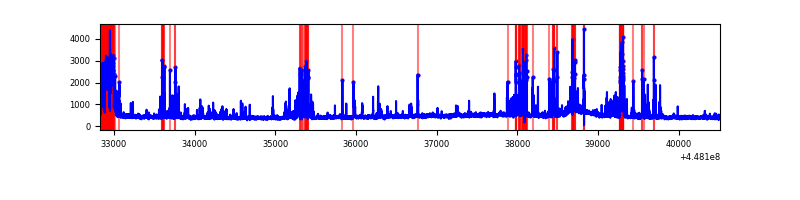 |
| D | 7683 | 7683 | 411 | 411 | 5.35% | 5.35% | 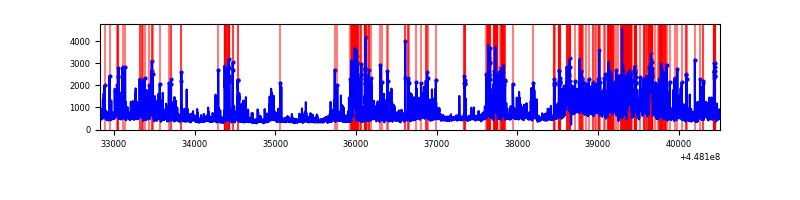 |
Top three noisy pixels from each quadrant. If the there are fewer than three noisy pixels in the level2.evt file, extra rows are filled as -1
| Pixel properties | Quadrant properties | ||||||
|---|---|---|---|---|---|---|---|
| Quadrant | DetID | PixID | Counts | Sigma | Mean | Median | Sigma |
| A | 10 | 83 | 3580701 | 19580.2 | 864 | 845 | 182.8 |
| A | 14 | 235 | 35061 | 187.15 | 864 | 845 | 182.8 |
| A | 13 | 248 | 31750 | 169.04 | 864 | 845 | 182.8 |
| B | 3 | 112 | 4368721 | 27258.43 | 809 | 784 | 160.2 |
| B | 12 | 18 | 706044 | 4401.23 | 809 | 784 | 160.2 |
| B | 5 | 172 | 494295 | 3079.79 | 809 | 784 | 160.2 |
| C | 14 | 254 | 1082619 | 5488.55 | 835 | 843 | 197.1 |
| C | 3 | 233 | 45056 | 224.32 | 835 | 843 | 197.1 |
| C | 12 | 2 | 12990 | 61.63 | 835 | 843 | 197.1 |
| D | 1 | 52 | 1180937 | 5578.57 | 828 | 801 | 211.5 |
| D | 1 | 47 | 577710 | 2727.08 | 828 | 801 | 211.5 |
| D | 13 | 249 | 312598 | 1473.88 | 828 | 801 | 211.5 |
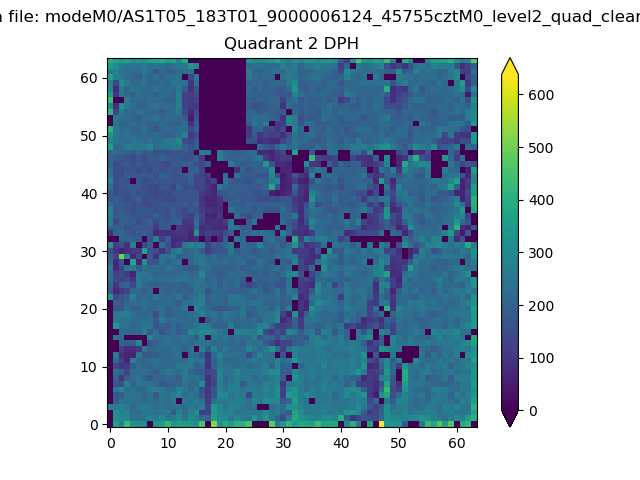
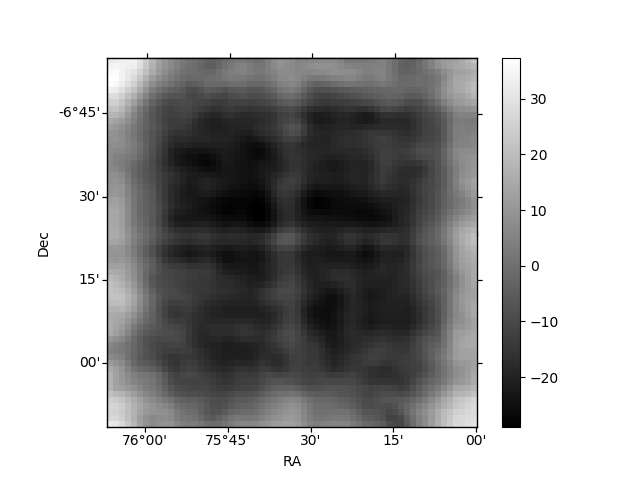
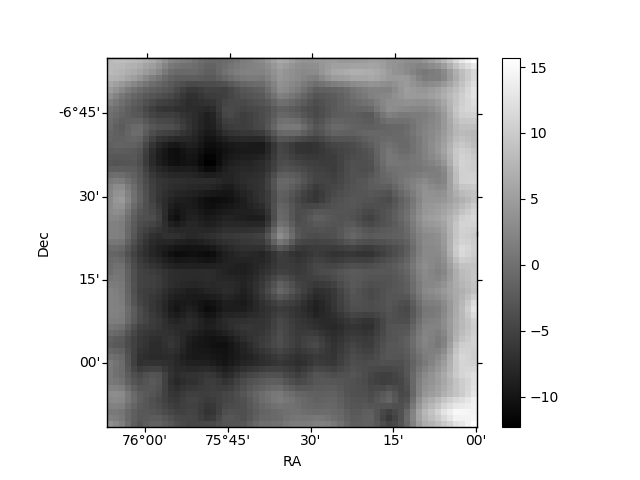
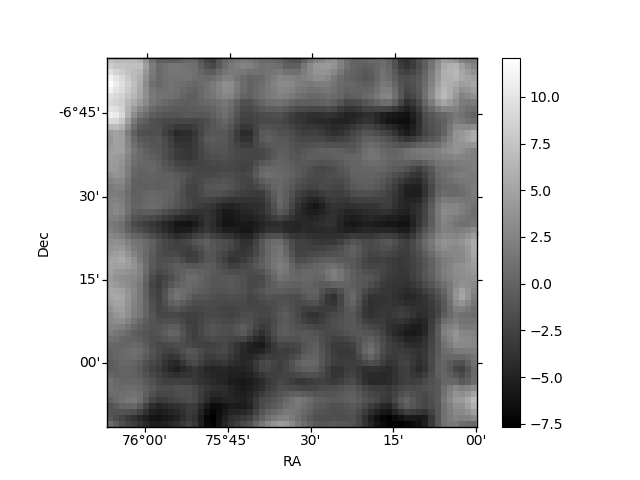
Histogram calculated using DETX and DETY for each event in the final _common_clean file
| Quadrant A | 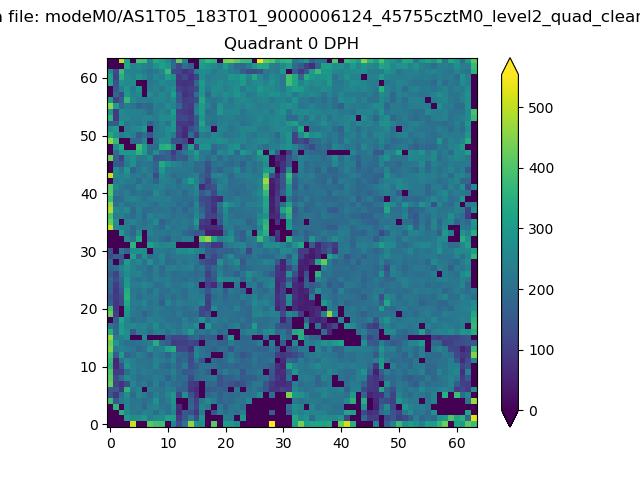 |
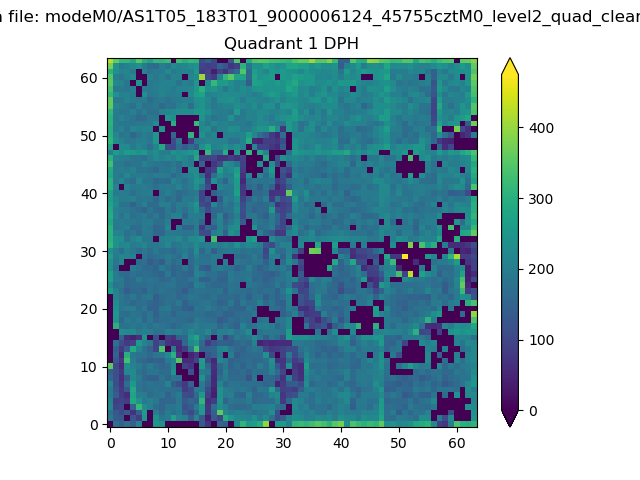 |
Quadrant B |
|---|---|---|---|
| Quadrant D | 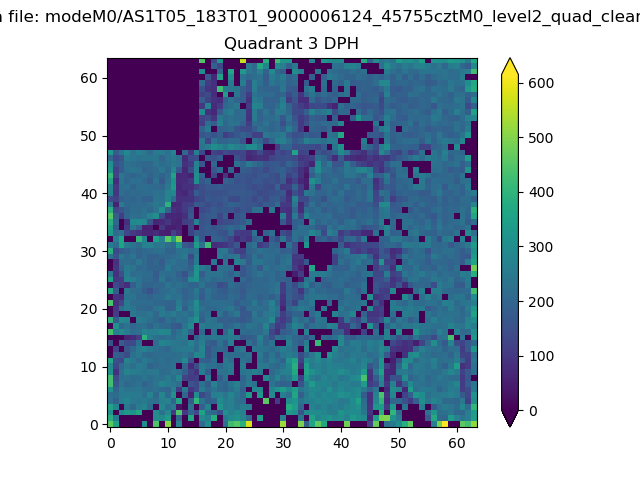 |
 |
Quadrant C |
| Plot type | Count rate plots | Images |
|---|---|---|
| Comparison with Poisson distribution Blue bars denote a histogram of data divided into 1 sec bins. Red curve is a Poisson curve with rate = median count rate of data. |
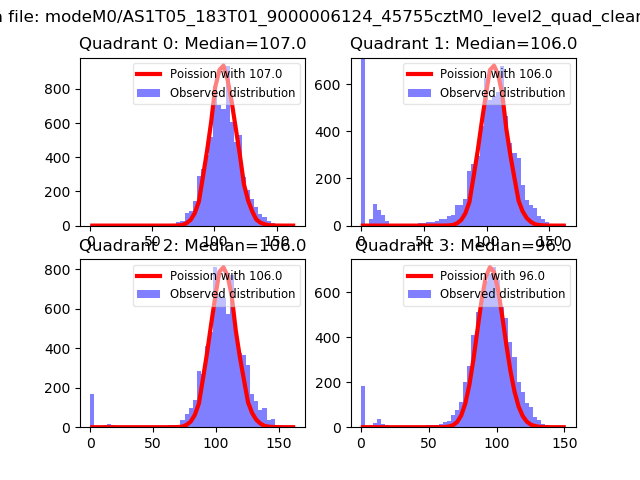 |
 |
| Quadrant-wise count rates Data is divided into 100 sec bins |
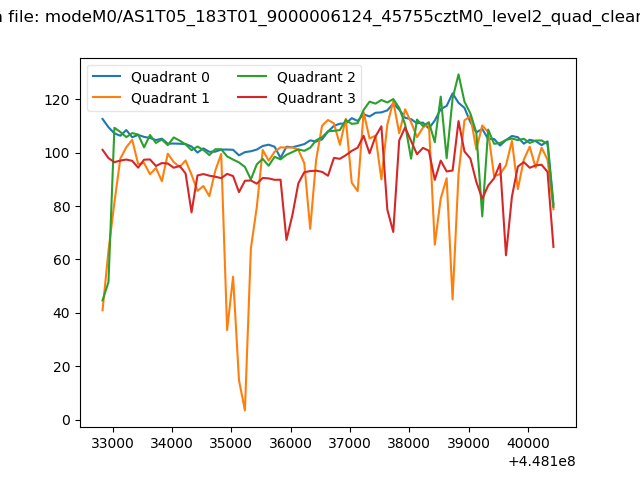 |
|
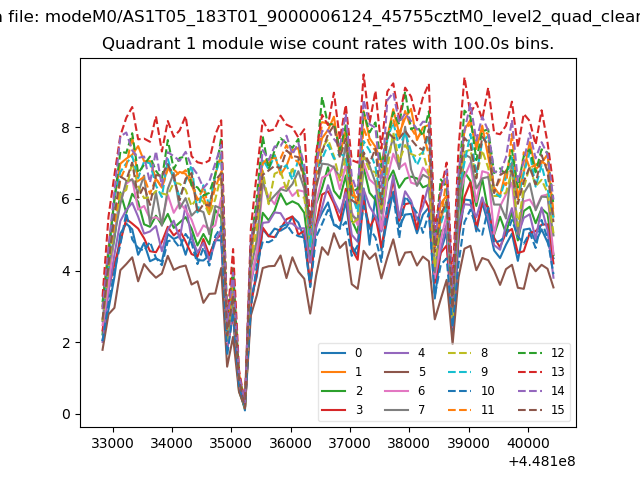
| Module-wise count rates for Quadrant A Data is divided into 100 sec bins |
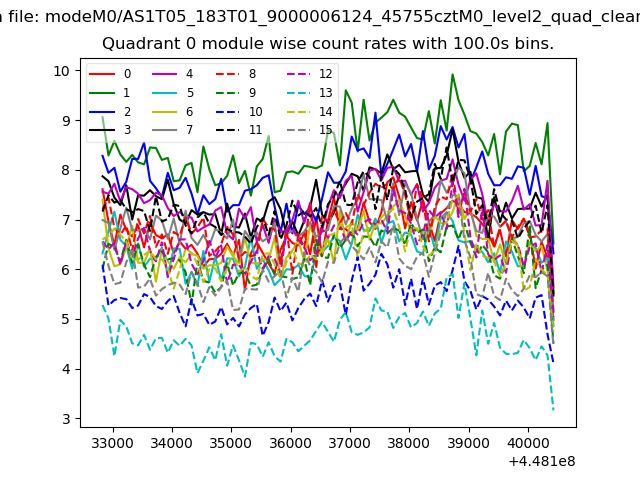 |
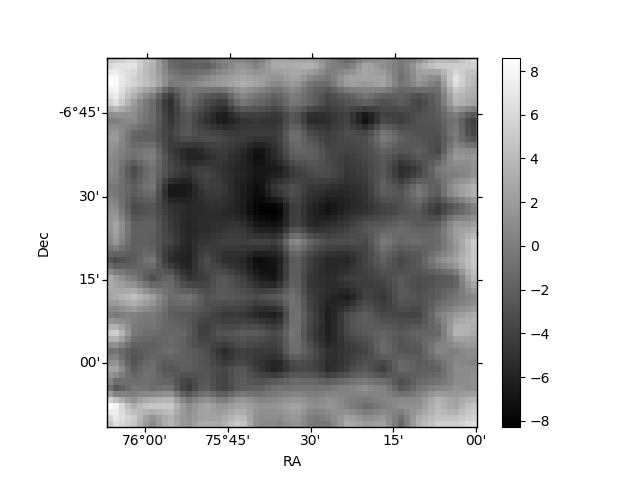 |
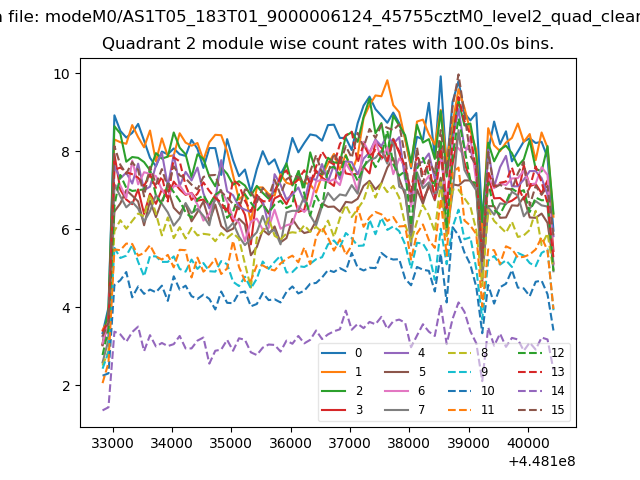
| Module-wise count rates for Quadrant B Data is divided into 100 sec bins |
 |
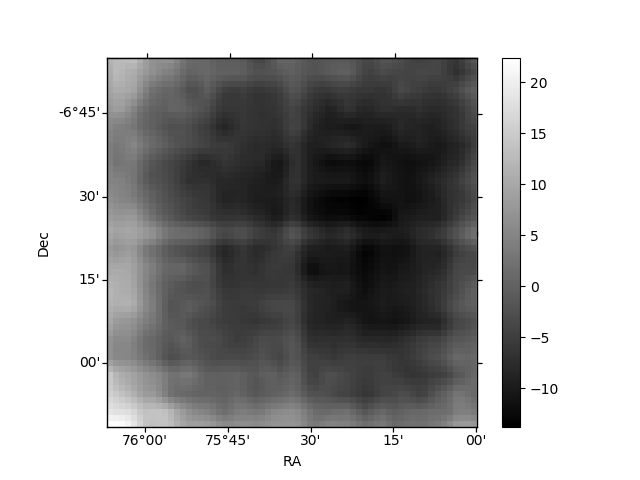 |
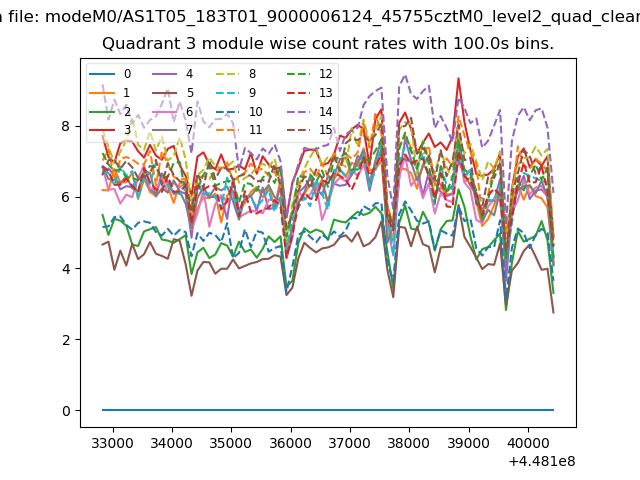
| Module-wise count rates for Quadrant C Data is divided into 100 sec bins |
 |
 |
| Module-wise count rates for Quadrant D Data is divided into 100 sec bins |
 |
 |
| Parameter | Plot |
|---|---|
| CZT HV Monitor | 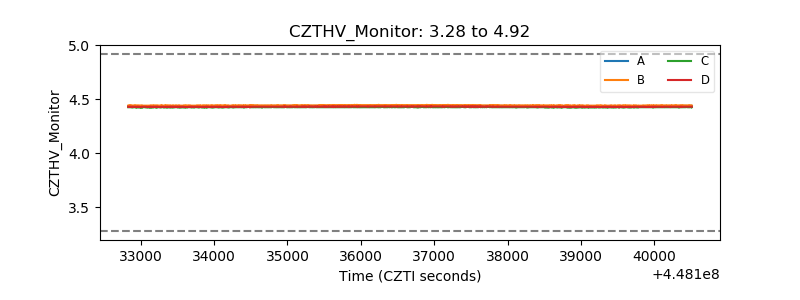 |
| D_VDD | 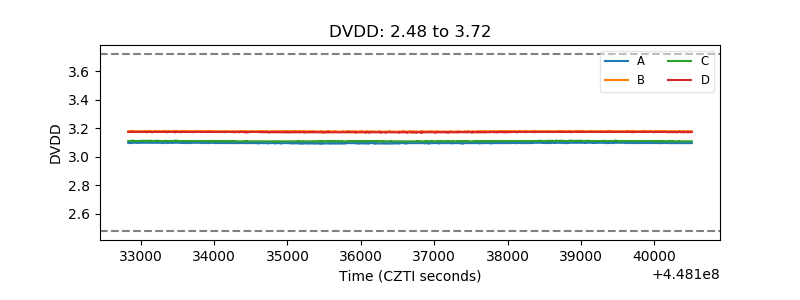 |
| Temperature 1 |  |
| Veto HV Monitor | 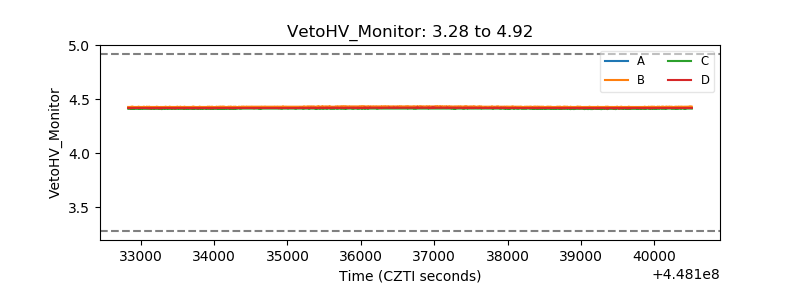 |
| Veto LLD | 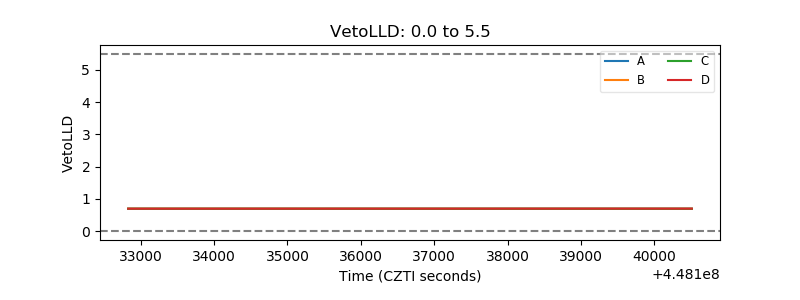 |
| Alpha Counter | 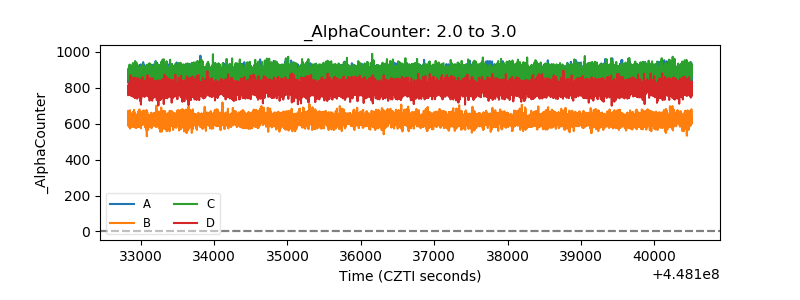 |
| _CPM_Rate | 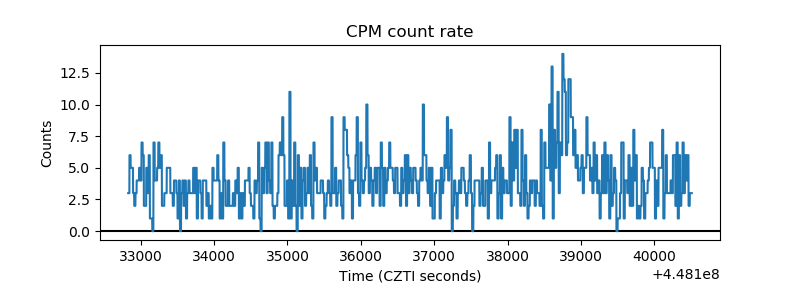 |
| CZT Counter | 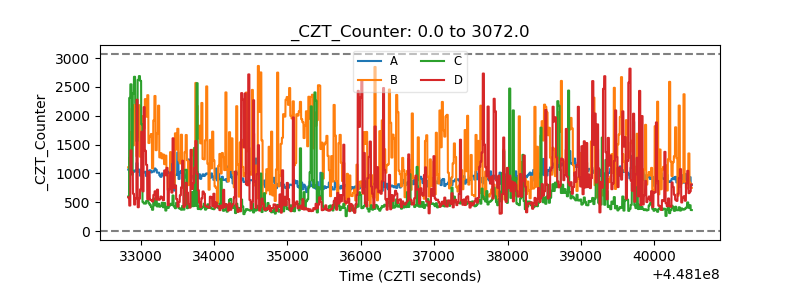 |
| +2.5 Volts monitor | 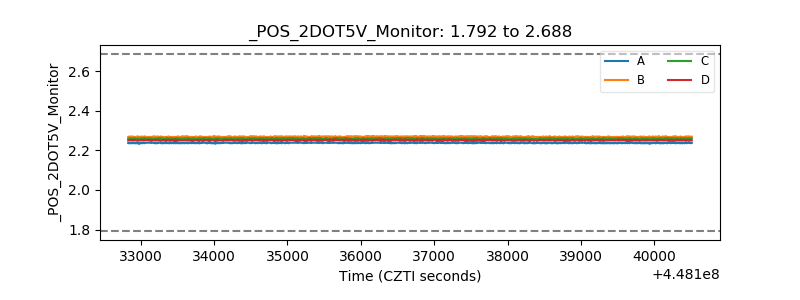 |
| +5 Volts monitor | 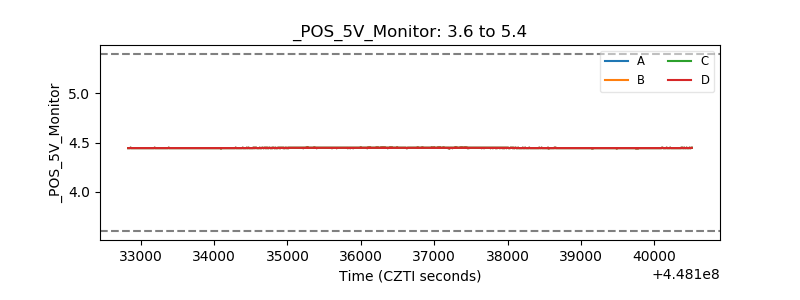 |
| _ROLL_ROT | 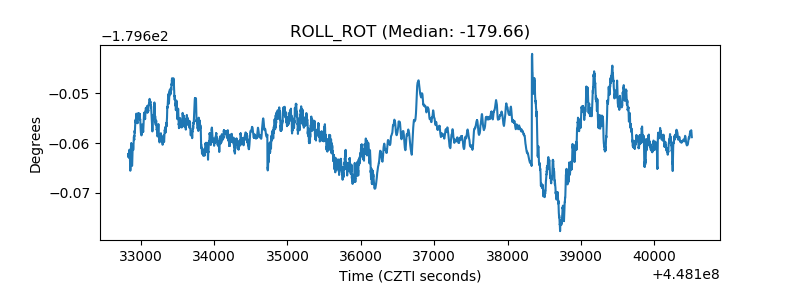 |
| _Roll_DEC | 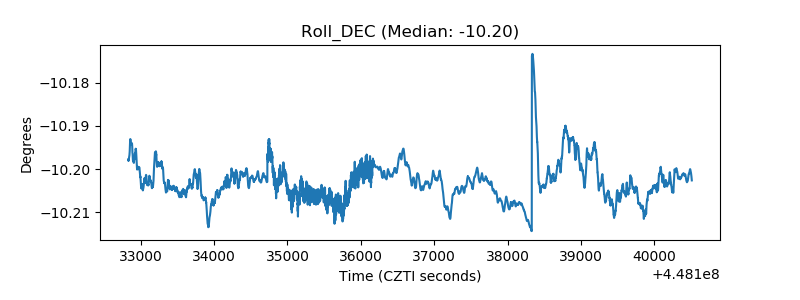 |
| _Roll_RA | 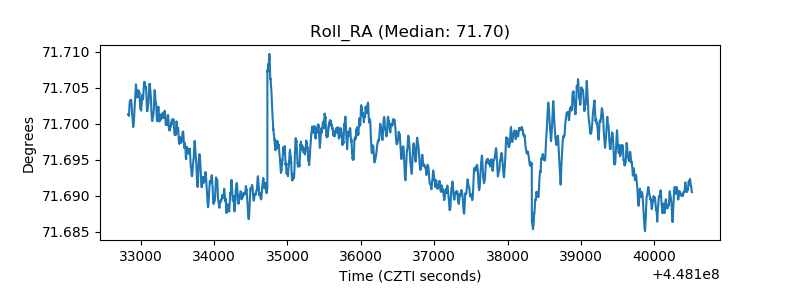 |
| Veto Counter | 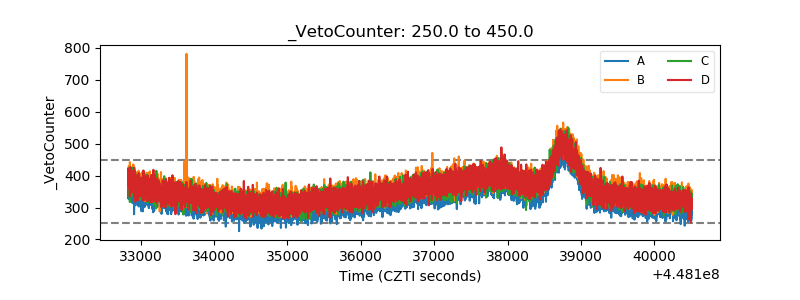 |