| Param | Original file | Final file |
|---|---|---|
| Filename | modeM0/AS1T05_183T01_9000006124_45758cztM0_level2.fits | modeM0/AS1T05_183T01_9000006124_45758cztM0_level2_quad_clean.evt |
| Size (bytes) | 1,802,672,640 | 286,617,600 |
| Size | 1.7 GB | 273.3 MB |
| Events in quadrant A | 17,179,035 | 1,967,942 |
| Events in quadrant B | 19,799,162 | 1,790,562 |
| Events in quadrant C | 11,022,508 | 1,960,853 |
| Events in quadrant D | 17,247,289 | 1,632,902 |
| Mode SS | |||
|---|---|---|---|
| Quadrant | BADHDUFLAG | Total packets | Discarded packets |
| A | 0 | 390 | 0 |
| B | 0 | 390 | 0 |
| C | 0 | 390 | 0 |
| D | 0 | 390 | 0 |
| Mode M0 | |||
|---|---|---|---|
| Quadrant | BADHDUFLAG | Total packets | Discarded packets |
| A | 0 | 64213 | 5 |
| B | 0 | 72090 | 2 |
| C | 0 | 46465 | 2 |
| D | 0 | 64536 | 2 |
| Mode M9 | |||
|---|---|---|---|
| Quadrant | BADHDUFLAG | Total packets | Discarded packets |
| A | 0 | 15 | 0 |
| B | 0 | 15 | 0 |
| C | 0 | 15 | 0 |
| D | 0 | 15 | 0 |
| Quadrant | Total seconds | Saturated seconds | Saturation percentage |
|---|---|---|---|
| A | 19222 | 453 | 2.356675% |
| B | 19223 | 2896 | 15.065286% |
| C | 19222 | 735 | 3.823744% |
| D | 19223 | 2054 | 10.685117% |
Noise dominated data is calculated using 1-second bins in cleaned event files. If a bin has >2000 counts, and if more than 50% of those come from <1% of pixels, then it is considered to be noise-dominated and hence unusable.
| Quadrant | # 1 sec bins | Bins with >0 counts | Bins with >2000 counts | High rate bins dominated by noise | Noise dominated (total time) | Noise dominated (detector-on time) | Marked lightcurve |
|---|---|---|---|---|---|---|---|
| A | 20663 | 19225 | 60 | 60 | 0.29% | 0.31% | 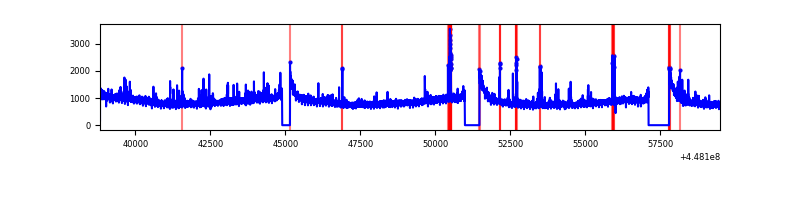 |
| B | 20663 | 19226 | 1884 | 1884 | 9.12% | 9.80% | 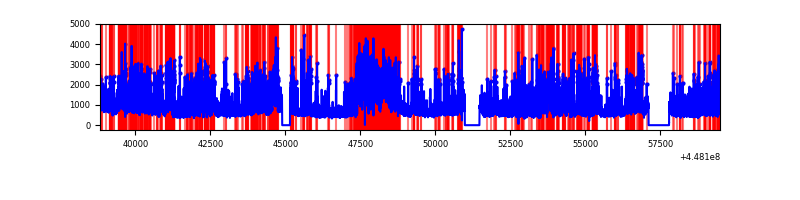 |
| C | 20662 | 19225 | 600 | 600 | 2.90% | 3.12% | 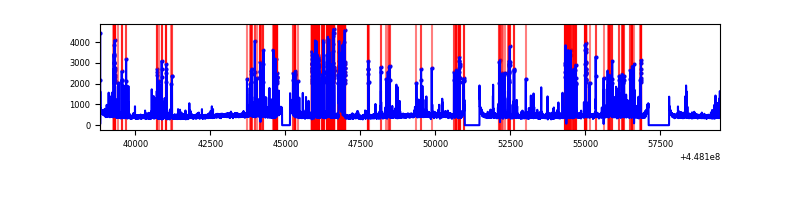 |
| D | 20663 | 19226 | 1733 | 1733 | 8.39% | 9.01% | 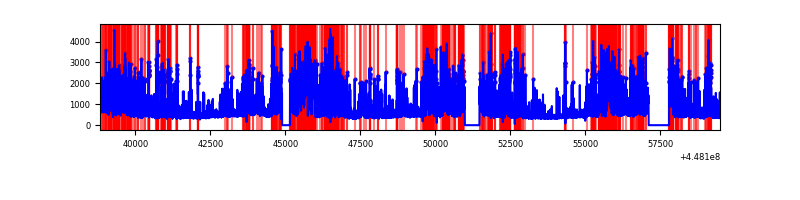 |
Top three noisy pixels from each quadrant. If the there are fewer than three noisy pixels in the level2.evt file, extra rows are filled as -1
| Pixel properties | Quadrant properties | ||||||
|---|---|---|---|---|---|---|---|
| Quadrant | DetID | PixID | Counts | Sigma | Mean | Median | Sigma |
| A | 10 | 83 | 8319740 | 18658.9 | 2147 | 2095 | 445.8 |
| A | 13 | 248 | 212596 | 472.21 | 2147 | 2095 | 445.8 |
| A | 14 | 235 | 100952 | 221.76 | 2147 | 2095 | 445.8 |
| B | 3 | 112 | 6760797 | 16789.33 | 2055 | 1988 | 402.6 |
| B | 12 | 3 | 1602233 | 3975.11 | 2055 | 1988 | 402.6 |
| B | 5 | 172 | 1274630 | 3161.33 | 2055 | 1988 | 402.6 |
| C | 12 | 2 | 1474434 | 2993.46 | 2091 | 2106 | 491.8 |
| C | 14 | 254 | 1232205 | 2500.98 | 2091 | 2106 | 491.8 |
| C | 3 | 233 | 97603 | 194.16 | 2091 | 2106 | 491.8 |
| D | 1 | 52 | 3851668 | 7447.01 | 2027 | 1961 | 516.9 |
| D | 2 | 249 | 1561211 | 3016.27 | 2027 | 1961 | 516.9 |
| D | 13 | 249 | 1438819 | 2779.51 | 2027 | 1961 | 516.9 |
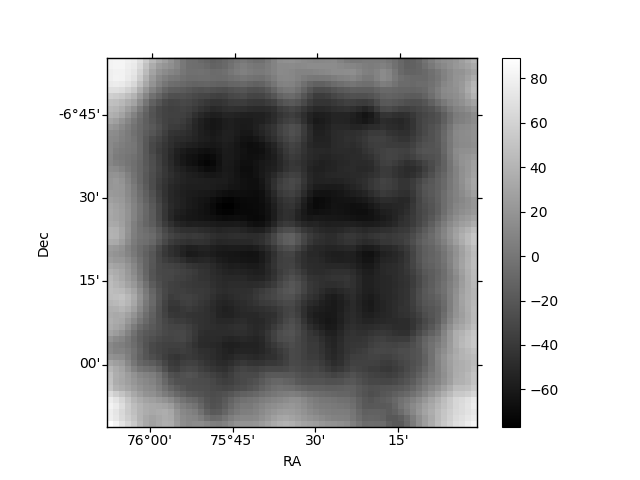
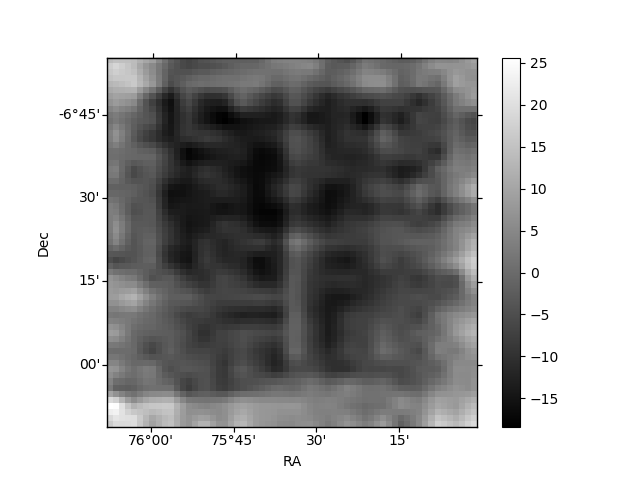
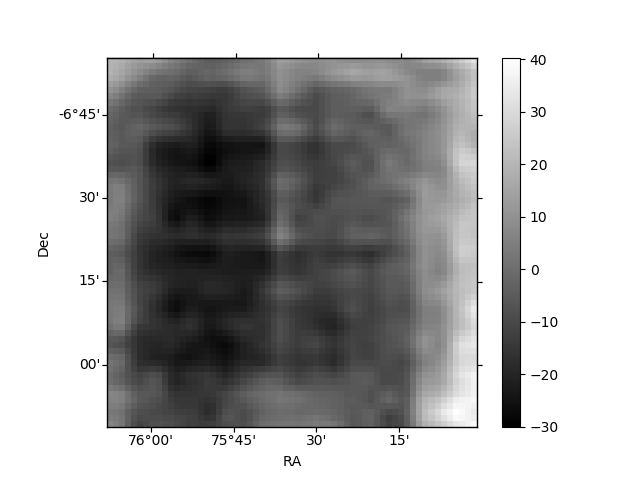
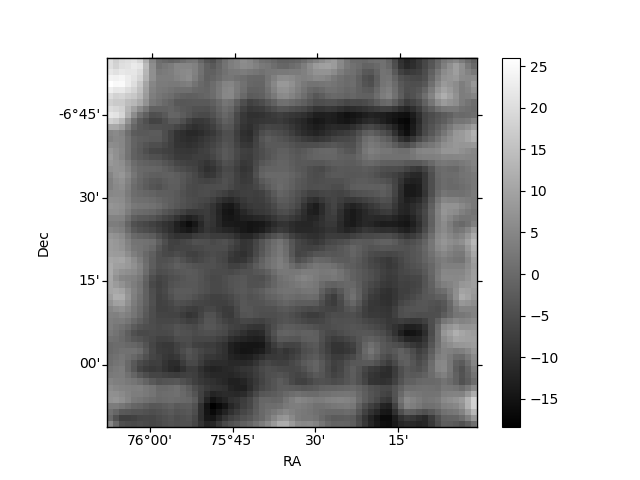
Histogram calculated using DETX and DETY for each event in the final _common_clean file
| Quadrant A | 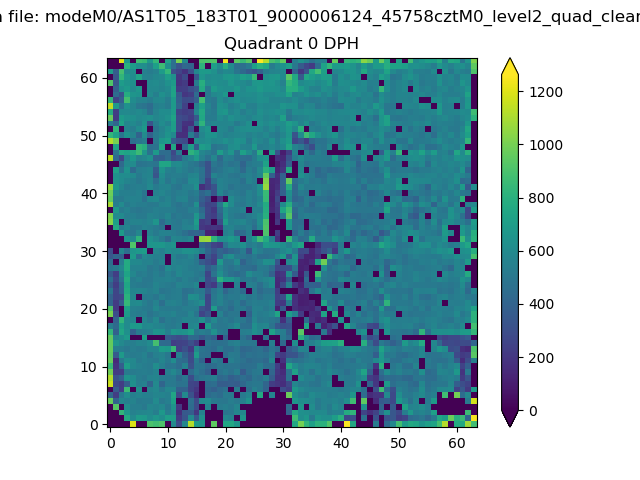 |
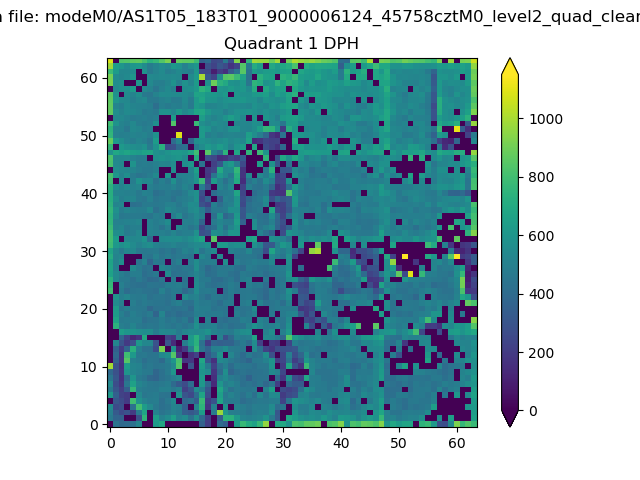 |
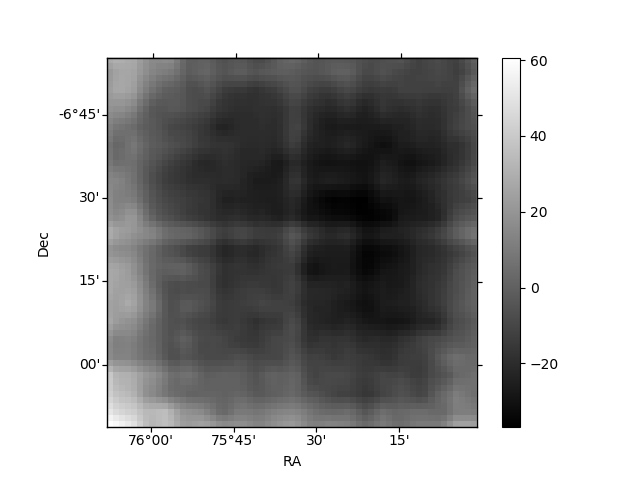
Quadrant B |
|---|---|---|---|
| Quadrant D | 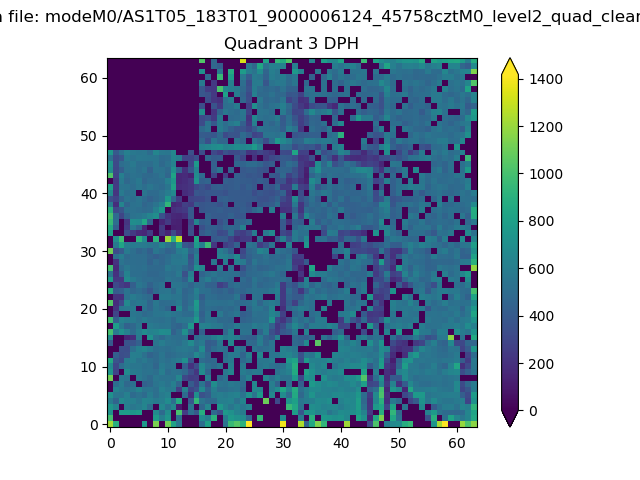 |
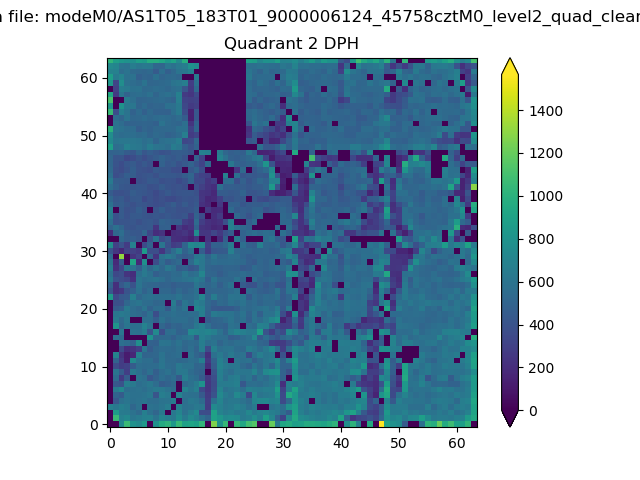 |
Quadrant C |
| Plot type | Count rate plots | Images |
|---|---|---|
| Comparison with Poisson distribution Blue bars denote a histogram of data divided into 1 sec bins. Red curve is a Poisson curve with rate = median count rate of data. |
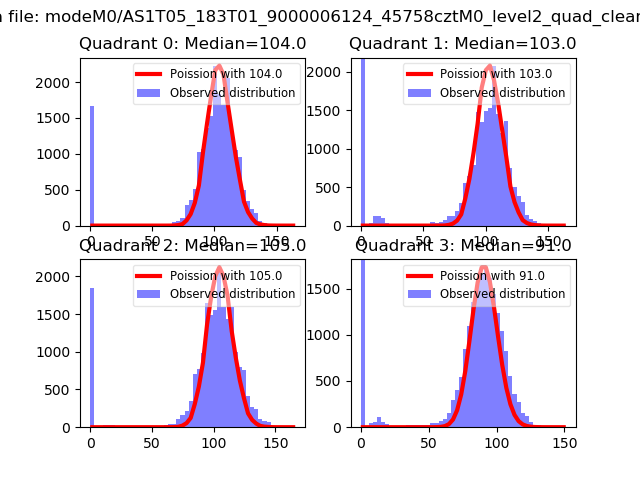 |
 |
| Quadrant-wise count rates Data is divided into 100 sec bins |
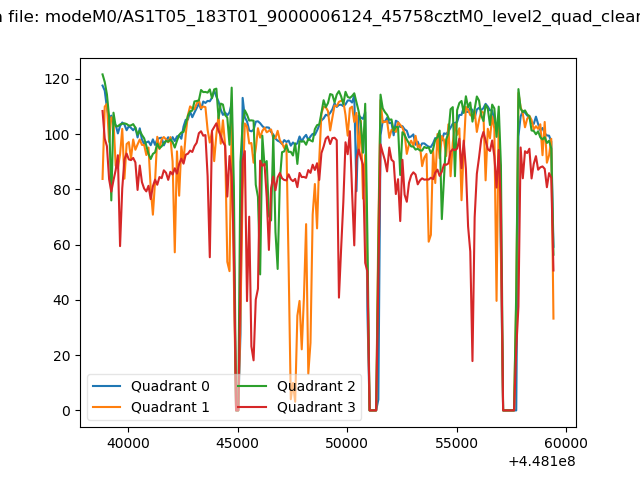 |
|
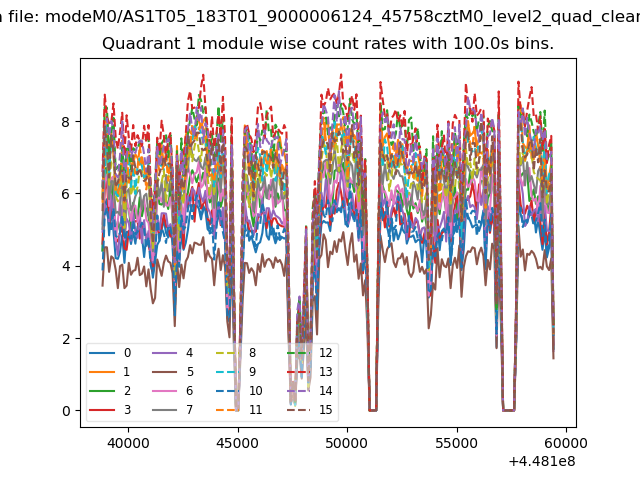
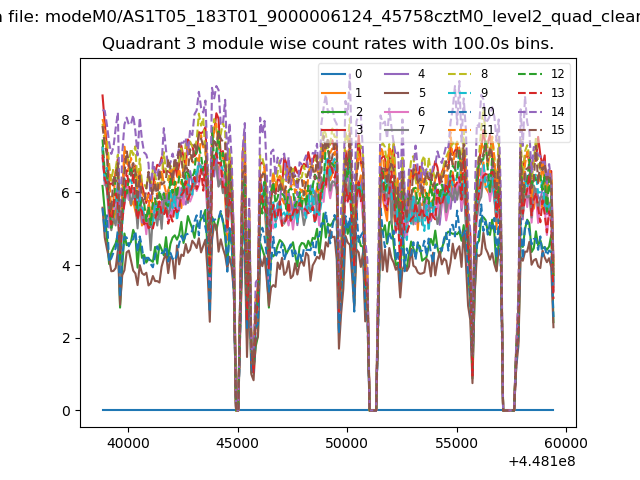
| Module-wise count rates for Quadrant A Data is divided into 100 sec bins |
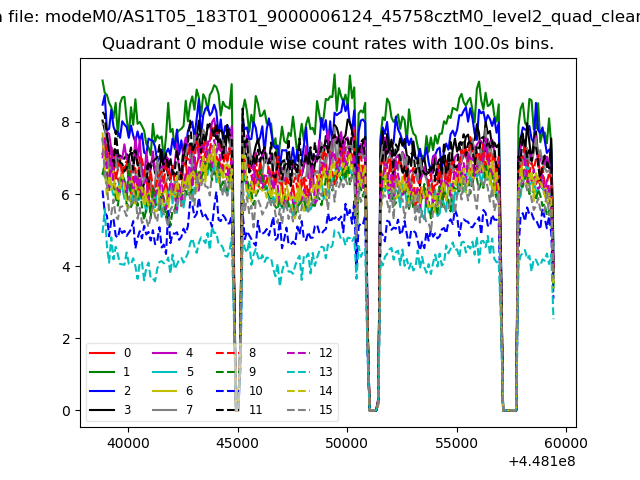 |
 |
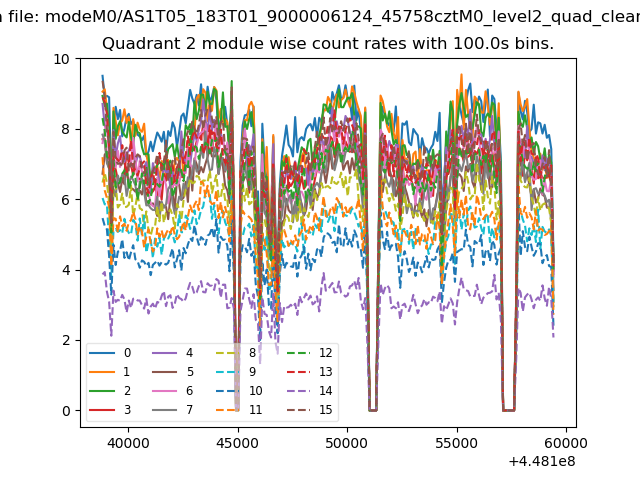
| Module-wise count rates for Quadrant B Data is divided into 100 sec bins |
 |
 |
| Module-wise count rates for Quadrant C Data is divided into 100 sec bins |
 |
 |
| Module-wise count rates for Quadrant D Data is divided into 100 sec bins |
 |
 |
| Parameter | Plot |
|---|---|
| CZT HV Monitor | 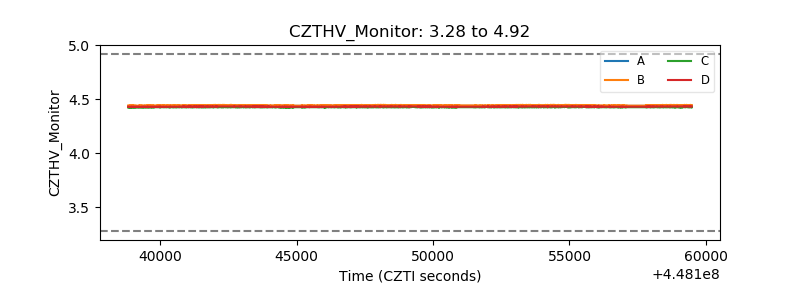 |
| D_VDD | 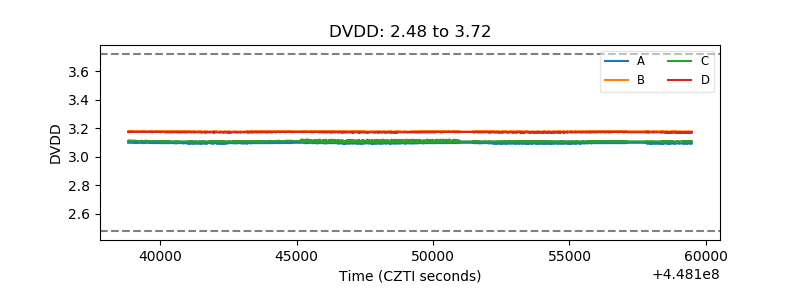 |
| Temperature 1 | 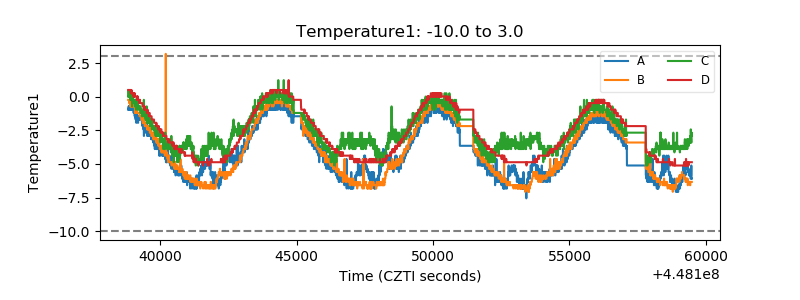 |
| Veto HV Monitor | 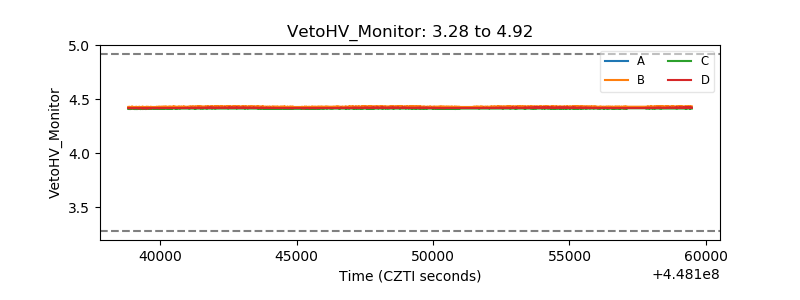 |
| Veto LLD | 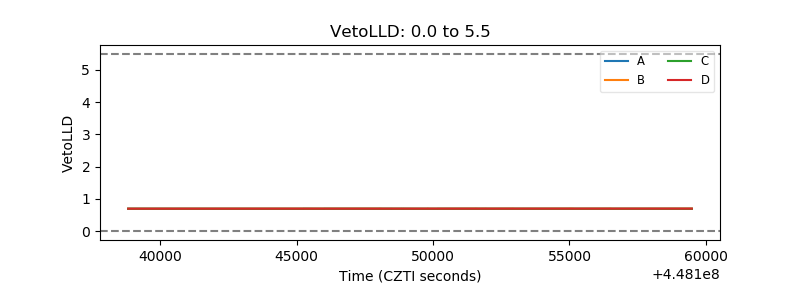 |
| Alpha Counter | 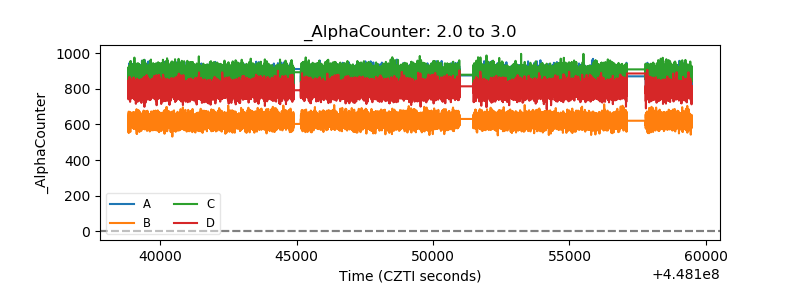 |
| _CPM_Rate | 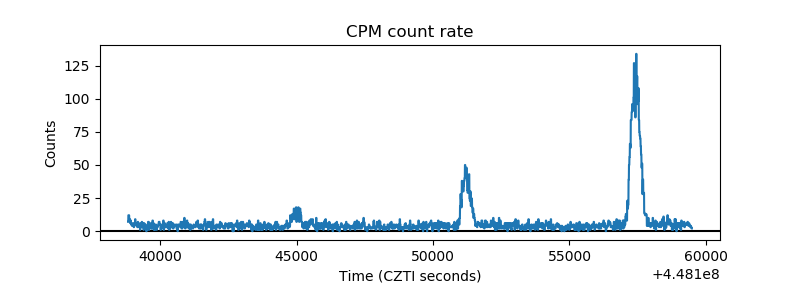 |
| CZT Counter | 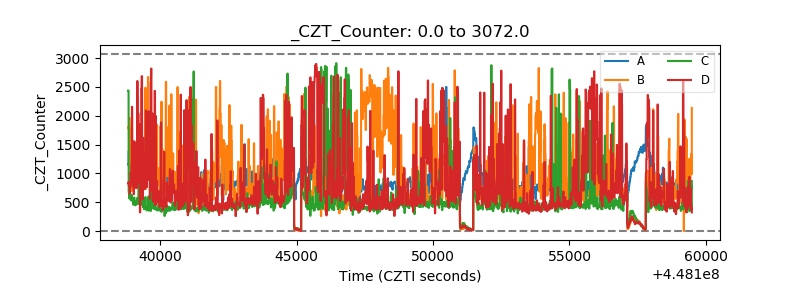 |
| +2.5 Volts monitor | 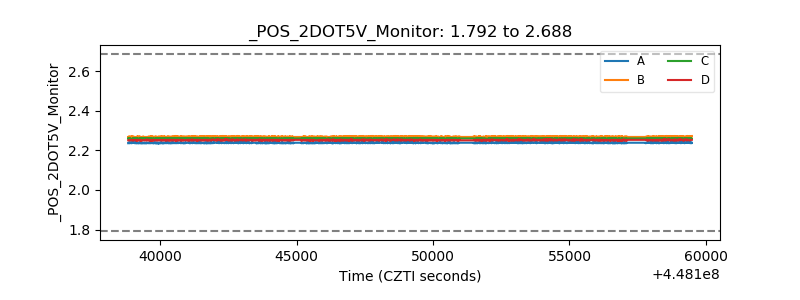 |
| +5 Volts monitor | 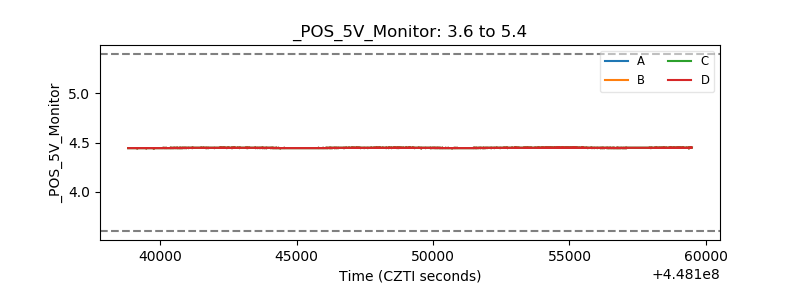 |
| _ROLL_ROT | 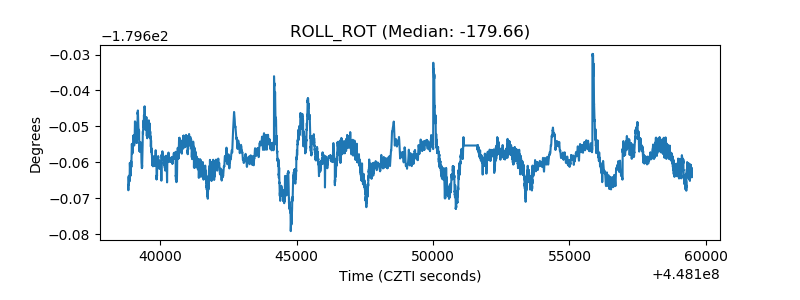 |
| _Roll_DEC | 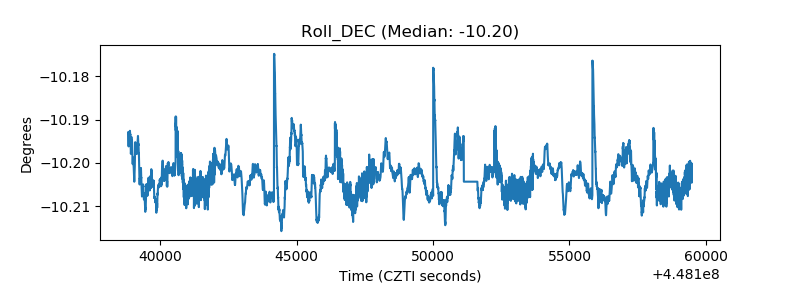 |
| _Roll_RA | 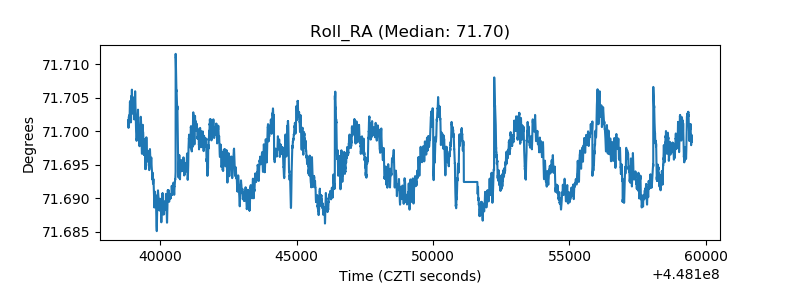 |
| Veto Counter | 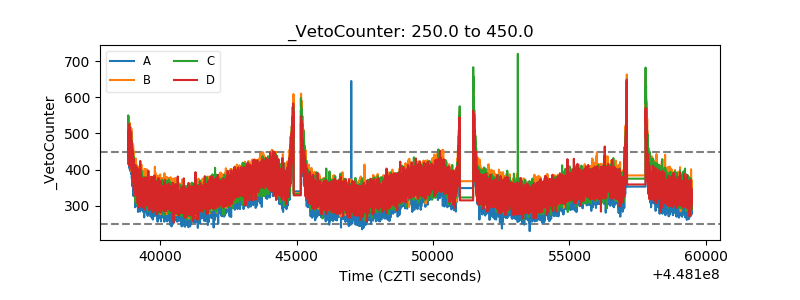 |