| Param | Original file | Final file |
|---|---|---|
| Filename | modeM0/AS1T05_183T01_9000006124_45759cztM0_level2.fits | modeM0/AS1T05_183T01_9000006124_45759cztM0_level2_quad_clean.evt |
| Size (bytes) | 647,521,920 | 106,081,920 |
| Size | 617.5 MB | 101.2 MB |
| Events in quadrant A | 6,623,310 | 714,122 |
| Events in quadrant B | 7,851,199 | 646,763 |
| Events in quadrant C | 3,683,616 | 724,508 |
| Events in quadrant D | 5,274,881 | 643,870 |
| Mode SS | |||
|---|---|---|---|
| Quadrant | BADHDUFLAG | Total packets | Discarded packets |
| A | 0 | 140 | 0 |
| B | 0 | 140 | 0 |
| C | 0 | 140 | 0 |
| D | 0 | 140 | 0 |
| Mode M0 | |||
|---|---|---|---|
| Quadrant | BADHDUFLAG | Total packets | Discarded packets |
| A | 0 | 24278 | 2 |
| B | 0 | 28214 | 2 |
| C | 0 | 15869 | 2 |
| D | 0 | 20402 | 2 |
| Mode M9 | |||
|---|---|---|---|
| Quadrant | BADHDUFLAG | Total packets | Discarded packets |
| A | 0 | 10 | 0 |
| B | 0 | 11 | 0 |
| C | 0 | 11 | 0 |
| D | 0 | 11 | 0 |
| Quadrant | Total seconds | Saturated seconds | Saturation percentage |
|---|---|---|---|
| A | 6926 | 319 | 4.605833% |
| B | 6926 | 1388 | 20.040427% |
| C | 6926 | 167 | 2.411204% |
| D | 6926 | 395 | 5.703148% |
Noise dominated data is calculated using 1-second bins in cleaned event files. If a bin has >2000 counts, and if more than 50% of those come from <1% of pixels, then it is considered to be noise-dominated and hence unusable.
| Quadrant | # 1 sec bins | Bins with >0 counts | Bins with >2000 counts | High rate bins dominated by noise | Noise dominated (total time) | Noise dominated (detector-on time) | Marked lightcurve |
|---|---|---|---|---|---|---|---|
| A | 7801 | 6927 | 147 | 147 | 1.88% | 2.12% | 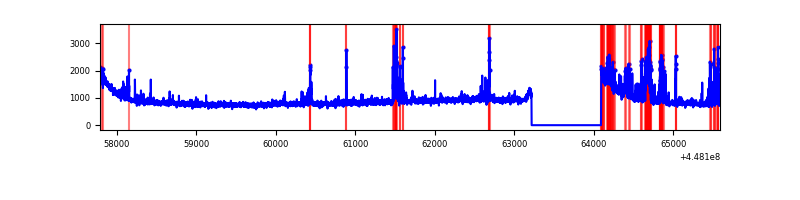 |
| B | 7801 | 6927 | 857 | 857 | 10.99% | 12.37% | 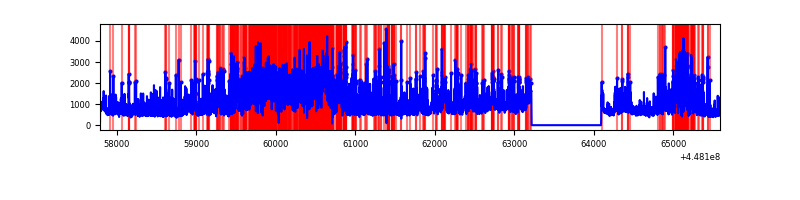 |
| C | 7801 | 6927 | 127 | 127 | 1.63% | 1.83% | 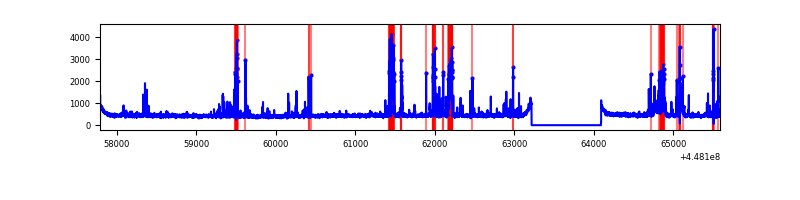 |
| D | 7801 | 6927 | 301 | 301 | 3.86% | 4.35% | 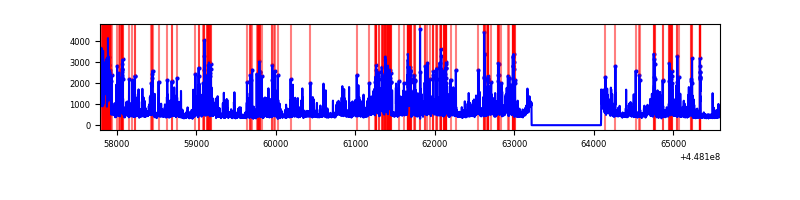 |
Top three noisy pixels from each quadrant. If the there are fewer than three noisy pixels in the level2.evt file, extra rows are filled as -1
| Pixel properties | Quadrant properties | ||||||
|---|---|---|---|---|---|---|---|
| Quadrant | DetID | PixID | Counts | Sigma | Mean | Median | Sigma |
| A | 10 | 83 | 3040598 | 18760.63 | 773 | 757 | 162.0 |
| A | 13 | 248 | 478872 | 2950.73 | 773 | 757 | 162.0 |
| A | 14 | 235 | 86900 | 531.64 | 773 | 757 | 162.0 |
| B | 3 | 112 | 2126747 | 14672.82 | 734 | 712 | 144.9 |
| B | 12 | 3 | 1055167 | 7277.31 | 734 | 712 | 144.9 |
| B | 5 | 172 | 841286 | 5801.22 | 734 | 712 | 144.9 |
| C | 14 | 254 | 558743 | 3083.24 | 768 | 772 | 181.0 |
| C | 12 | 2 | 111644 | 612.66 | 768 | 772 | 181.0 |
| C | 4 | 254 | 6780 | 33.2 | 768 | 772 | 181.0 |
| D | 1 | 52 | 1285837 | 6788.81 | 749 | 726 | 189.3 |
| D | 2 | 249 | 471242 | 2485.58 | 749 | 726 | 189.3 |
| D | 13 | 249 | 260957 | 1374.71 | 749 | 726 | 189.3 |
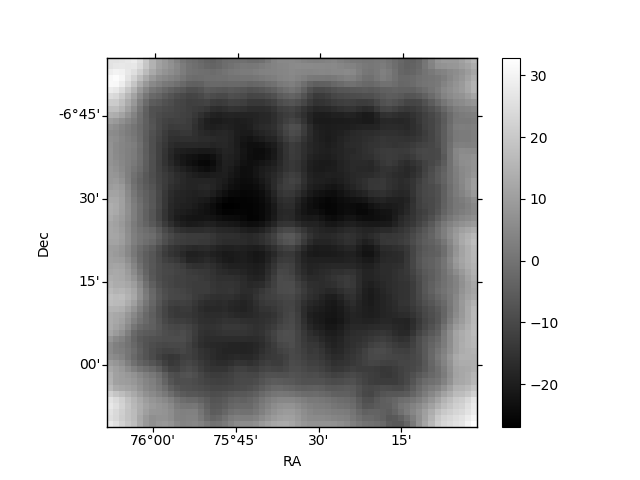
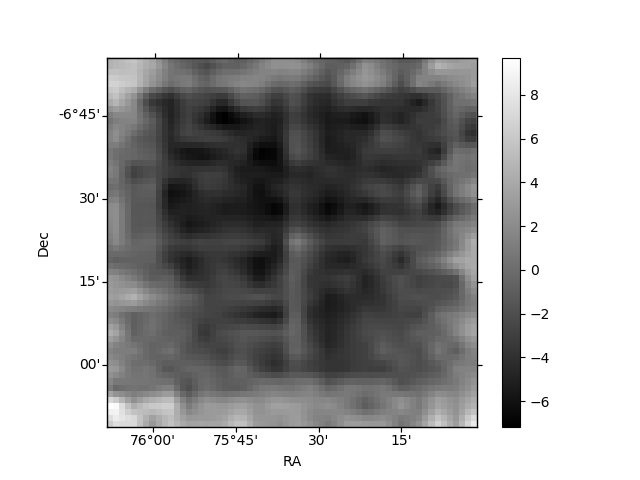
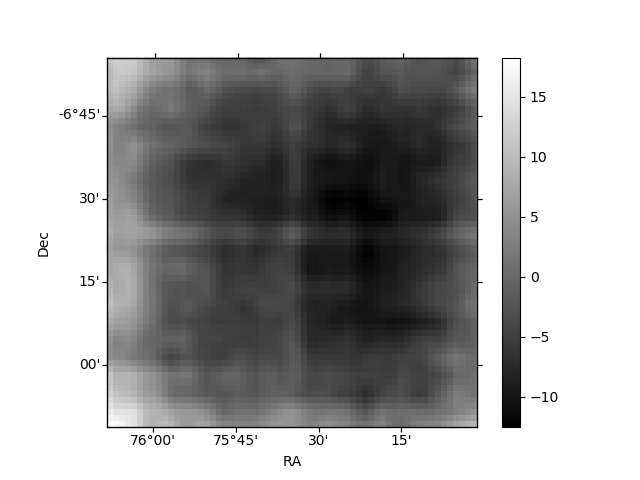
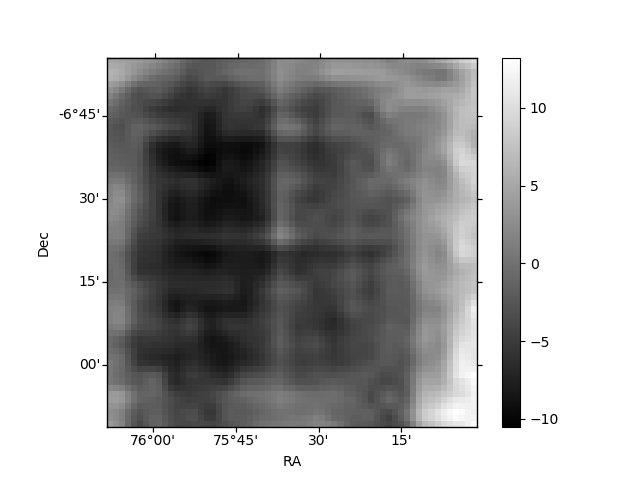
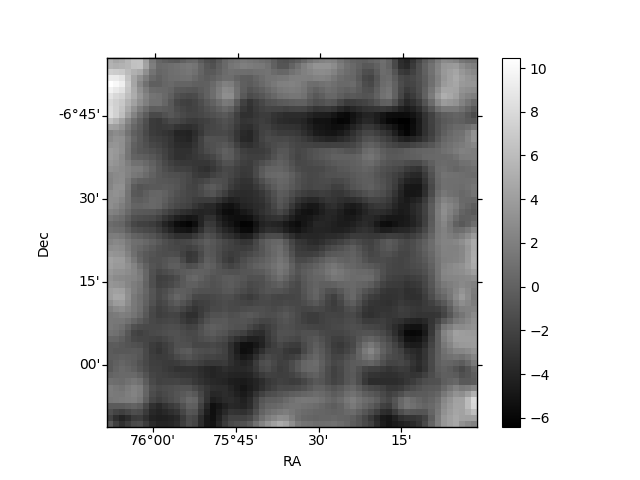
Histogram calculated using DETX and DETY for each event in the final _common_clean file
| Quadrant A | 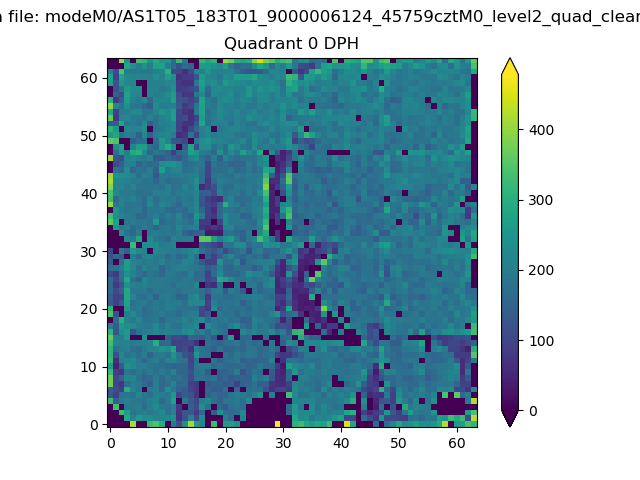 |
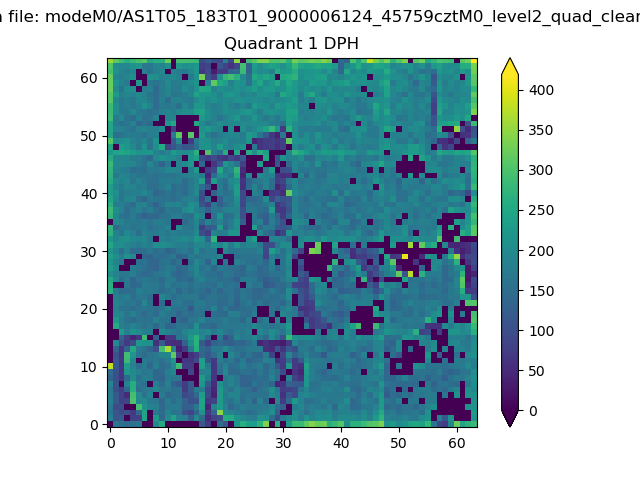 |
Quadrant B |
|---|---|---|---|
| Quadrant D | 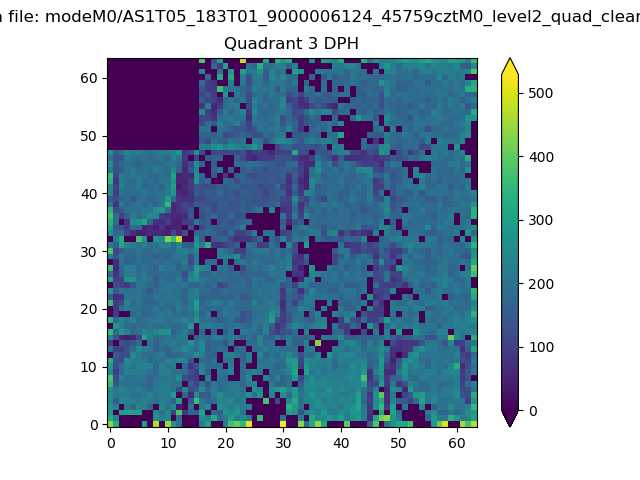 |
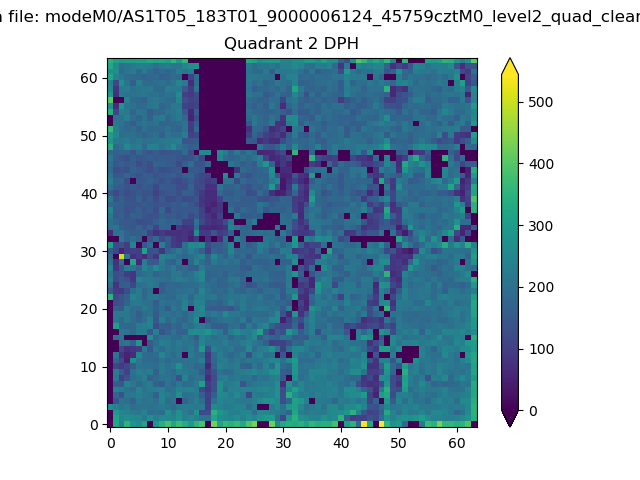 |
Quadrant C |
| Plot type | Count rate plots | Images |
|---|---|---|
| Comparison with Poisson distribution Blue bars denote a histogram of data divided into 1 sec bins. Red curve is a Poisson curve with rate = median count rate of data. |
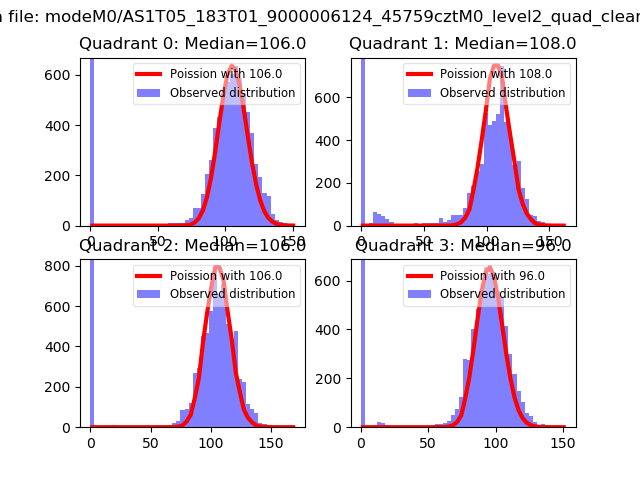 |
 |
| Quadrant-wise count rates Data is divided into 100 sec bins |
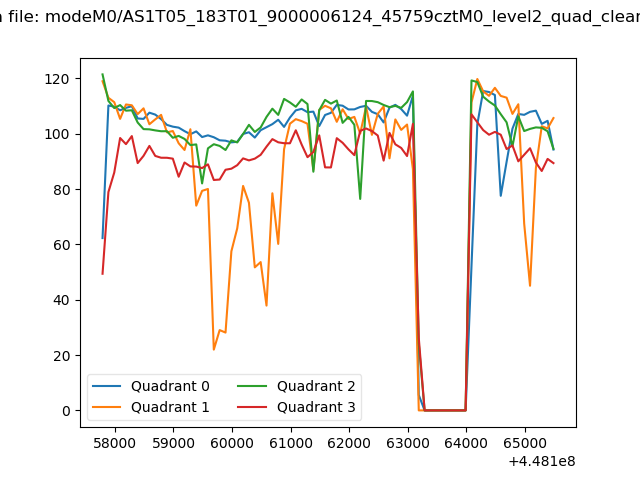 |
|
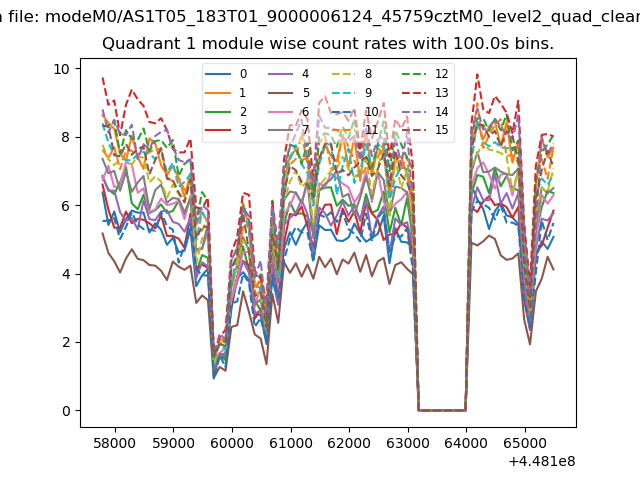
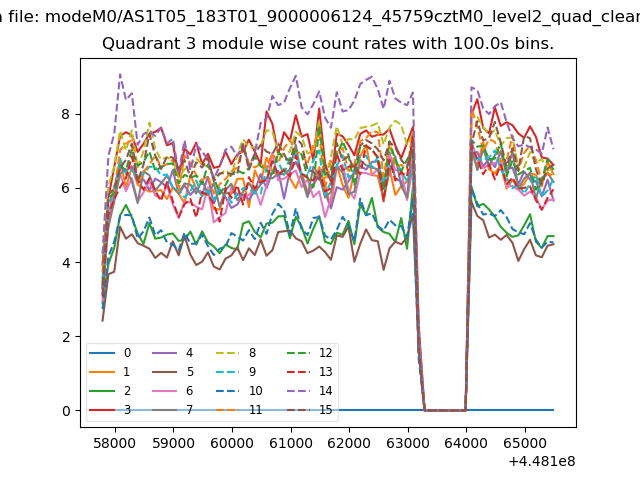
| Module-wise count rates for Quadrant A Data is divided into 100 sec bins |
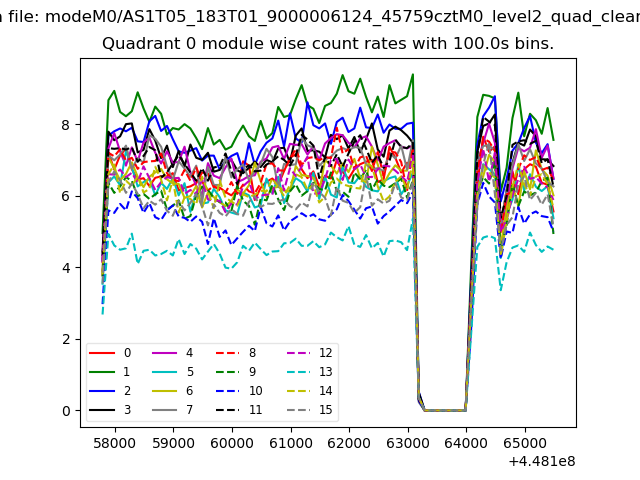 |
 |
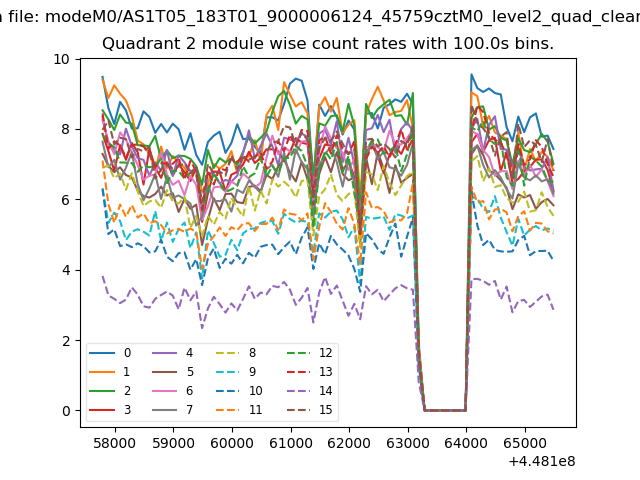
| Module-wise count rates for Quadrant B Data is divided into 100 sec bins |
 |
 |
| Module-wise count rates for Quadrant C Data is divided into 100 sec bins |
 |
 |
| Module-wise count rates for Quadrant D Data is divided into 100 sec bins |
 |
 |
| Parameter | Plot |
|---|---|
| CZT HV Monitor | 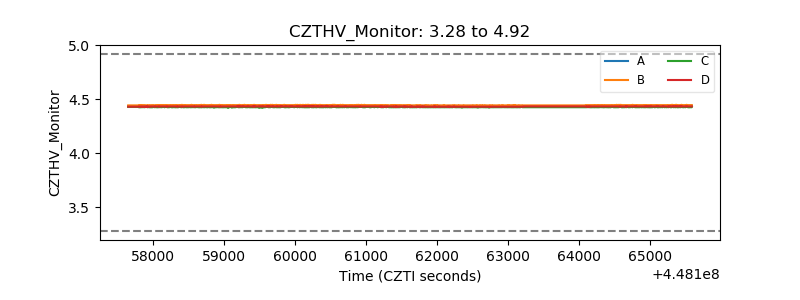 |
| D_VDD | 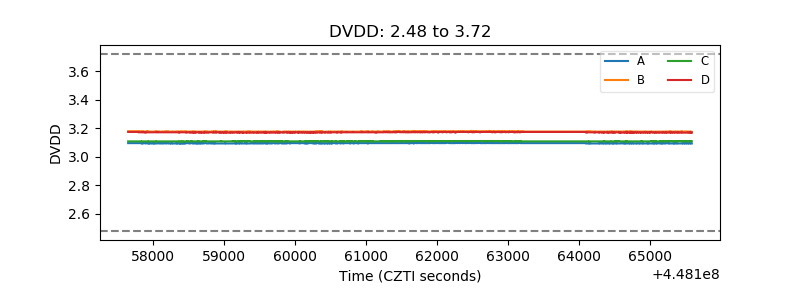 |
| Temperature 1 | 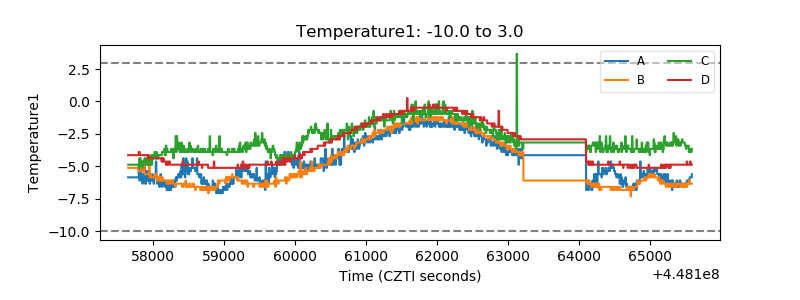 |
| Veto HV Monitor | 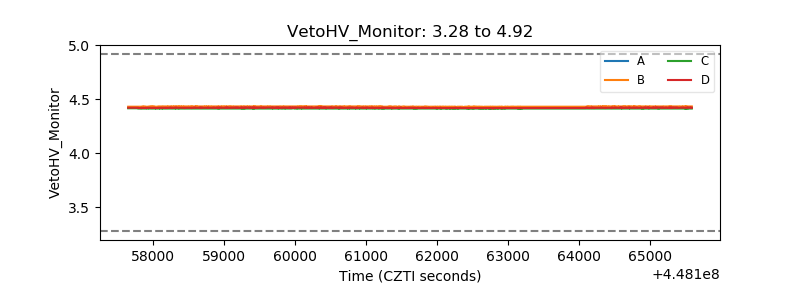 |
| Veto LLD | 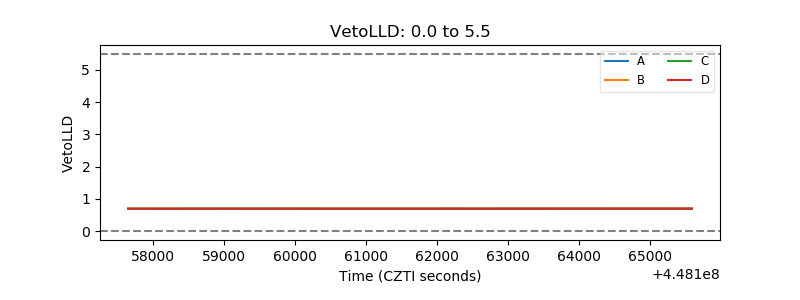 |
| Alpha Counter | 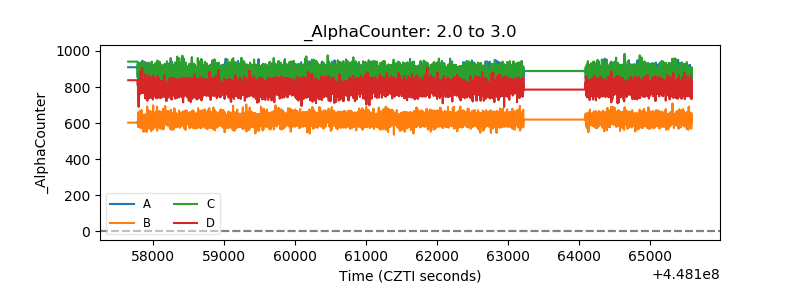 |
| _CPM_Rate | 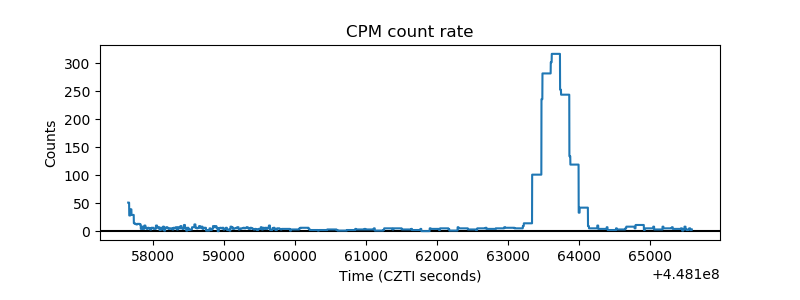 |
| CZT Counter | 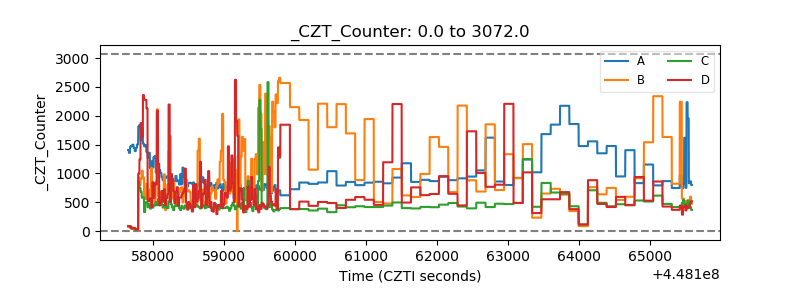 |
| +2.5 Volts monitor | 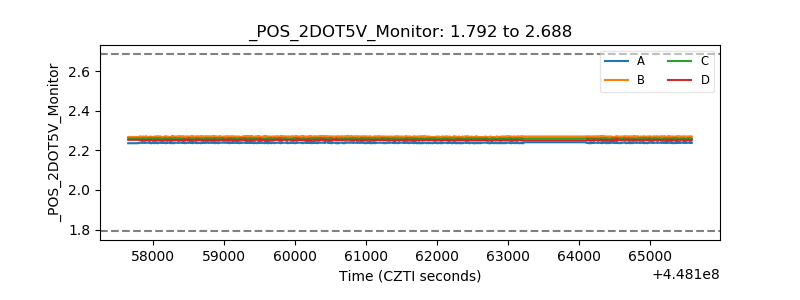 |
| +5 Volts monitor | 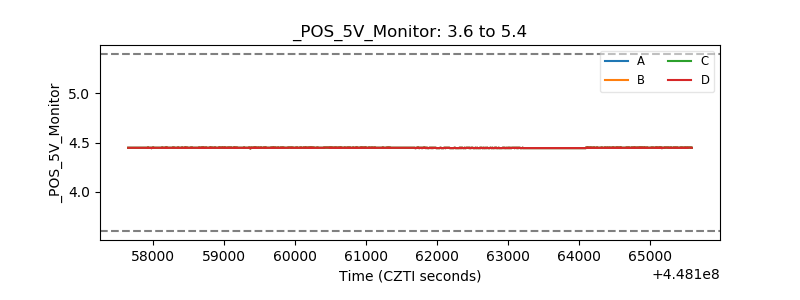 |
| _ROLL_ROT | 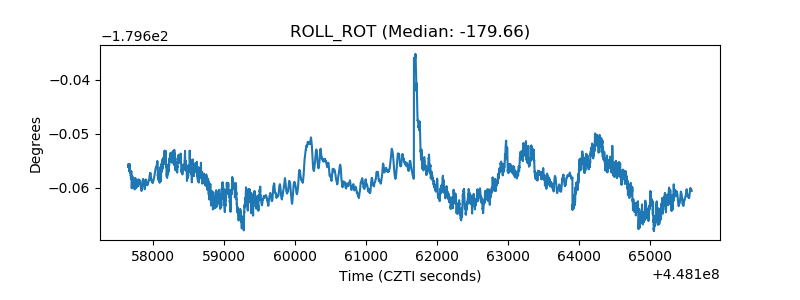 |
| _Roll_DEC | 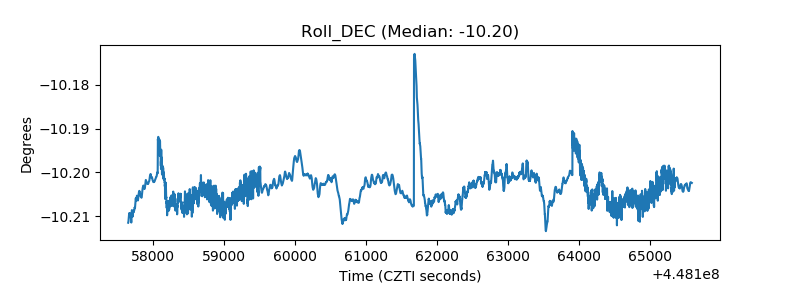 |
| _Roll_RA | 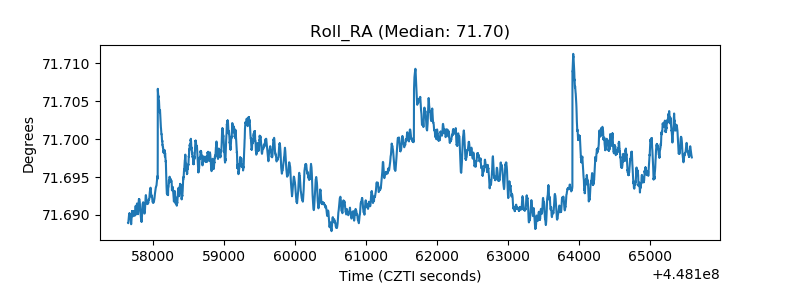 |
| Veto Counter | 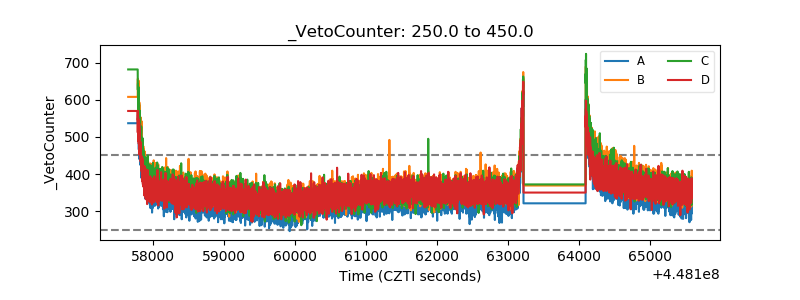 |